Download as PDF, PPTX
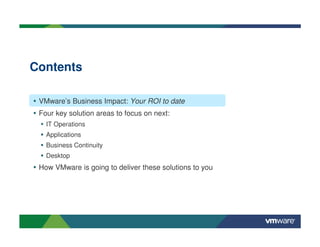
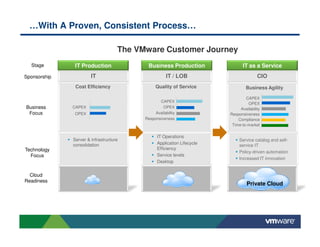
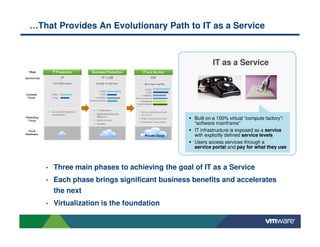
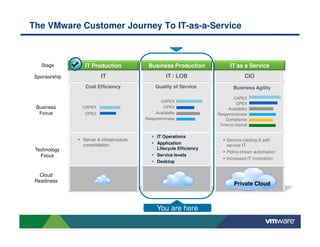
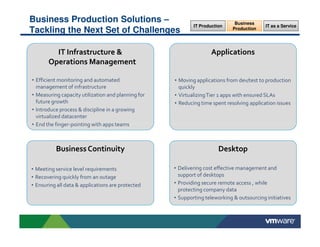
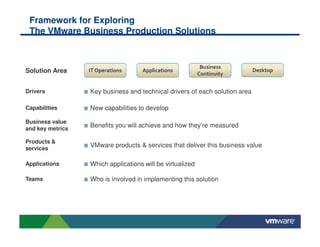
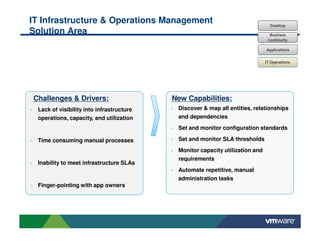
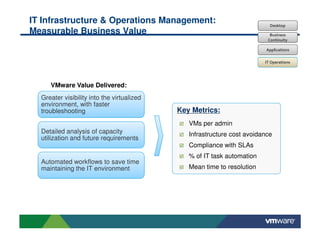
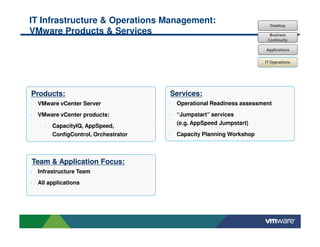
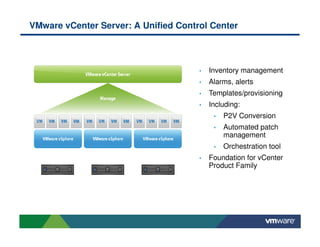


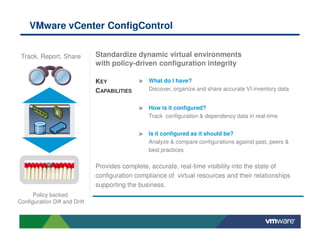
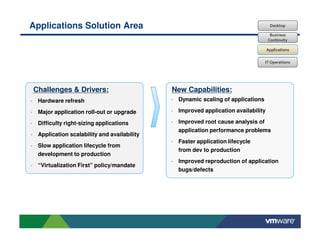
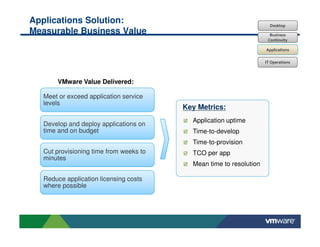
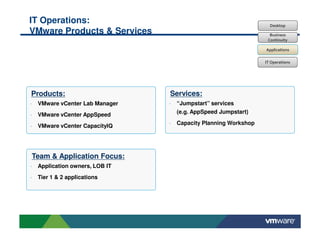


This document discusses VMware's business production solutions and how they can help customers progress from IT production to IT as a service. It outlines four key solution areas - IT operations, applications, business continuity, and desktop. For each area, it discusses challenges, capabilities VMware can provide, measurable business benefits, and relevant VMware products and services. It uses a framework to explore each solution area in detail and positions the customer at the business production stage of their journey to IT as a service with VMware.


![Getting Started with Apache Spark: Big Data Made Simple [Free Meetup]](https://cdn.slidesharecdn.com/ss_thumbnails/apachesparkgettingstarted-260203175547-8361bcc3-thumbnail.jpg?width=640&height=640&fit=bounds)