Download to read offline
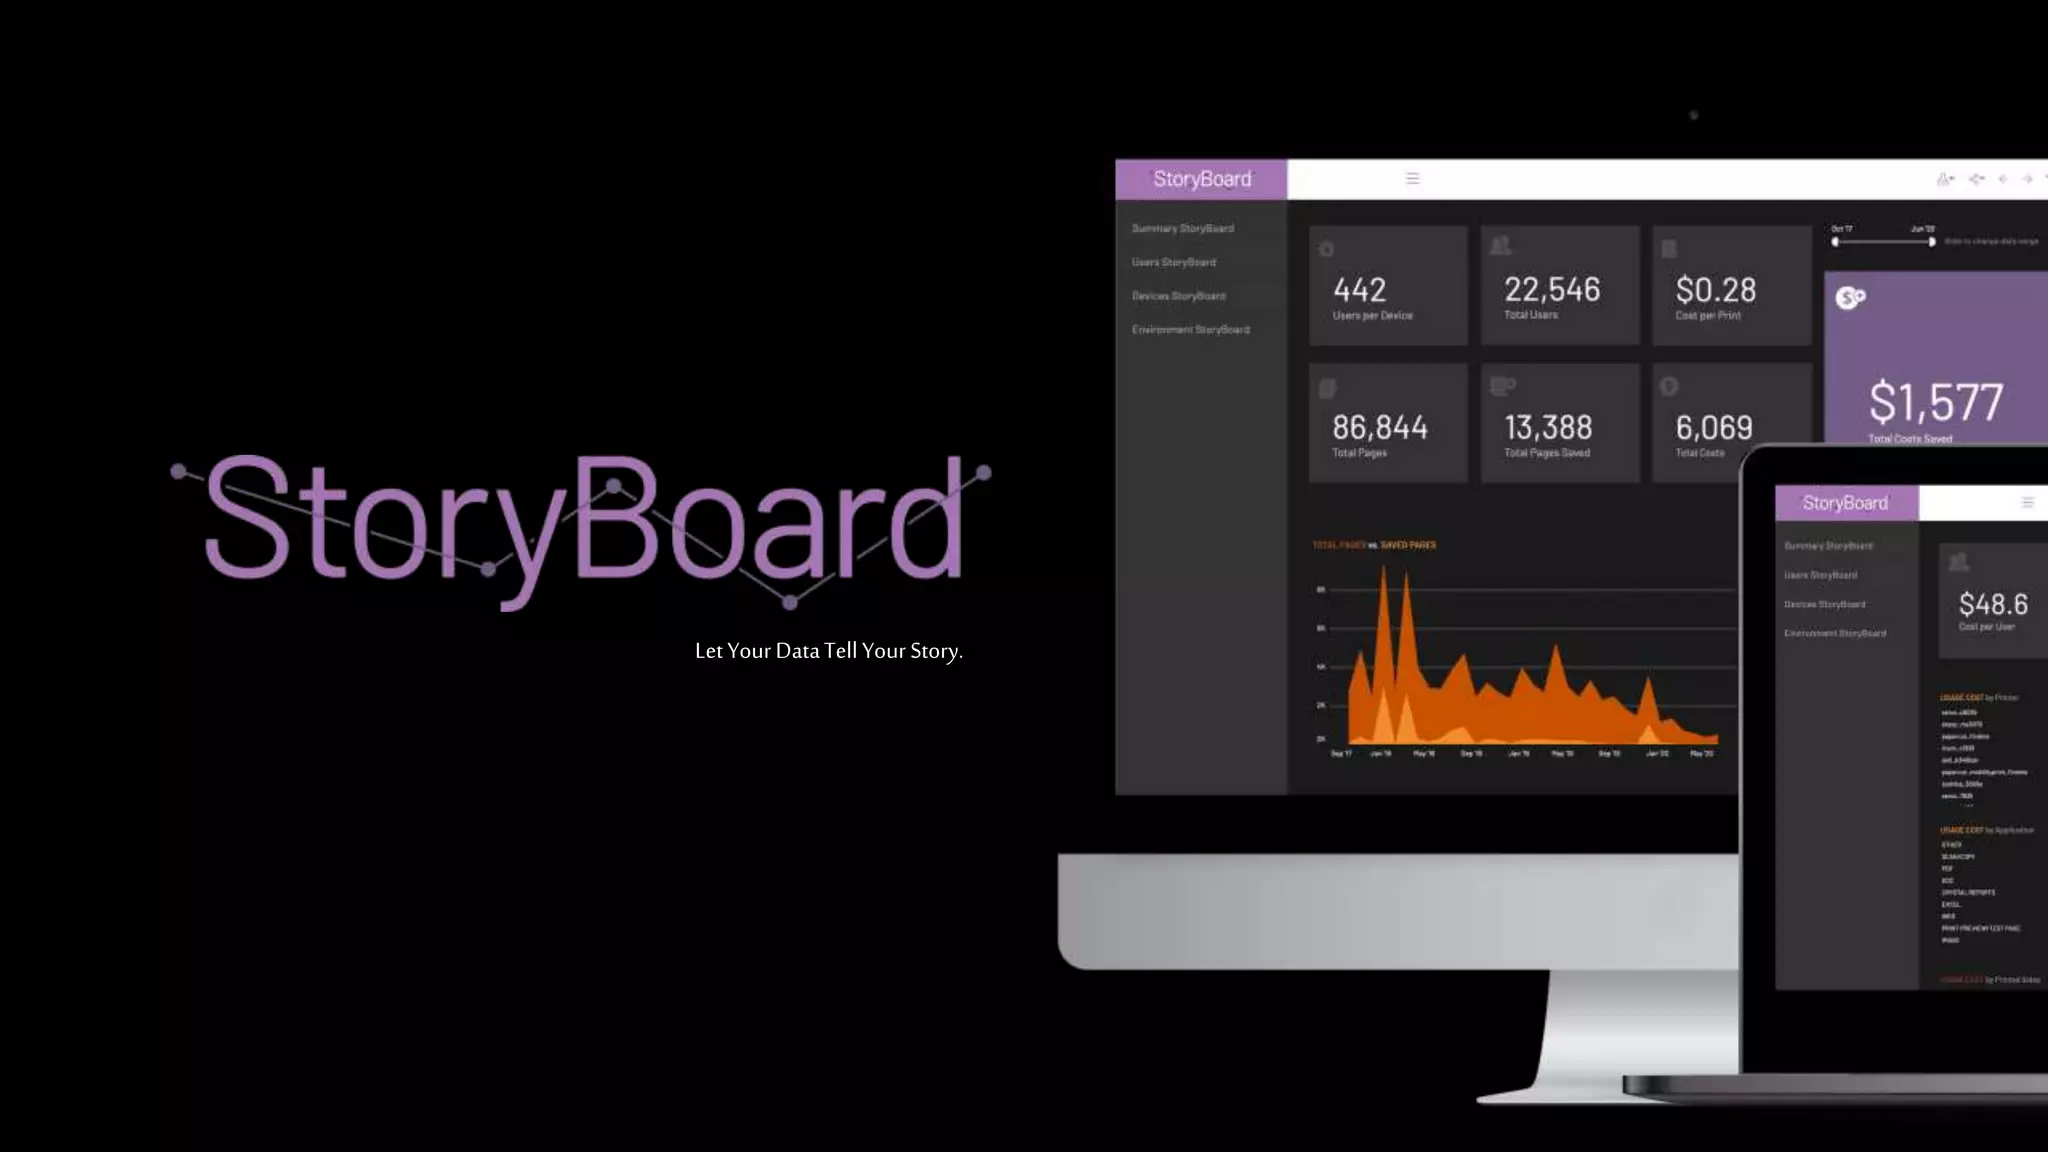


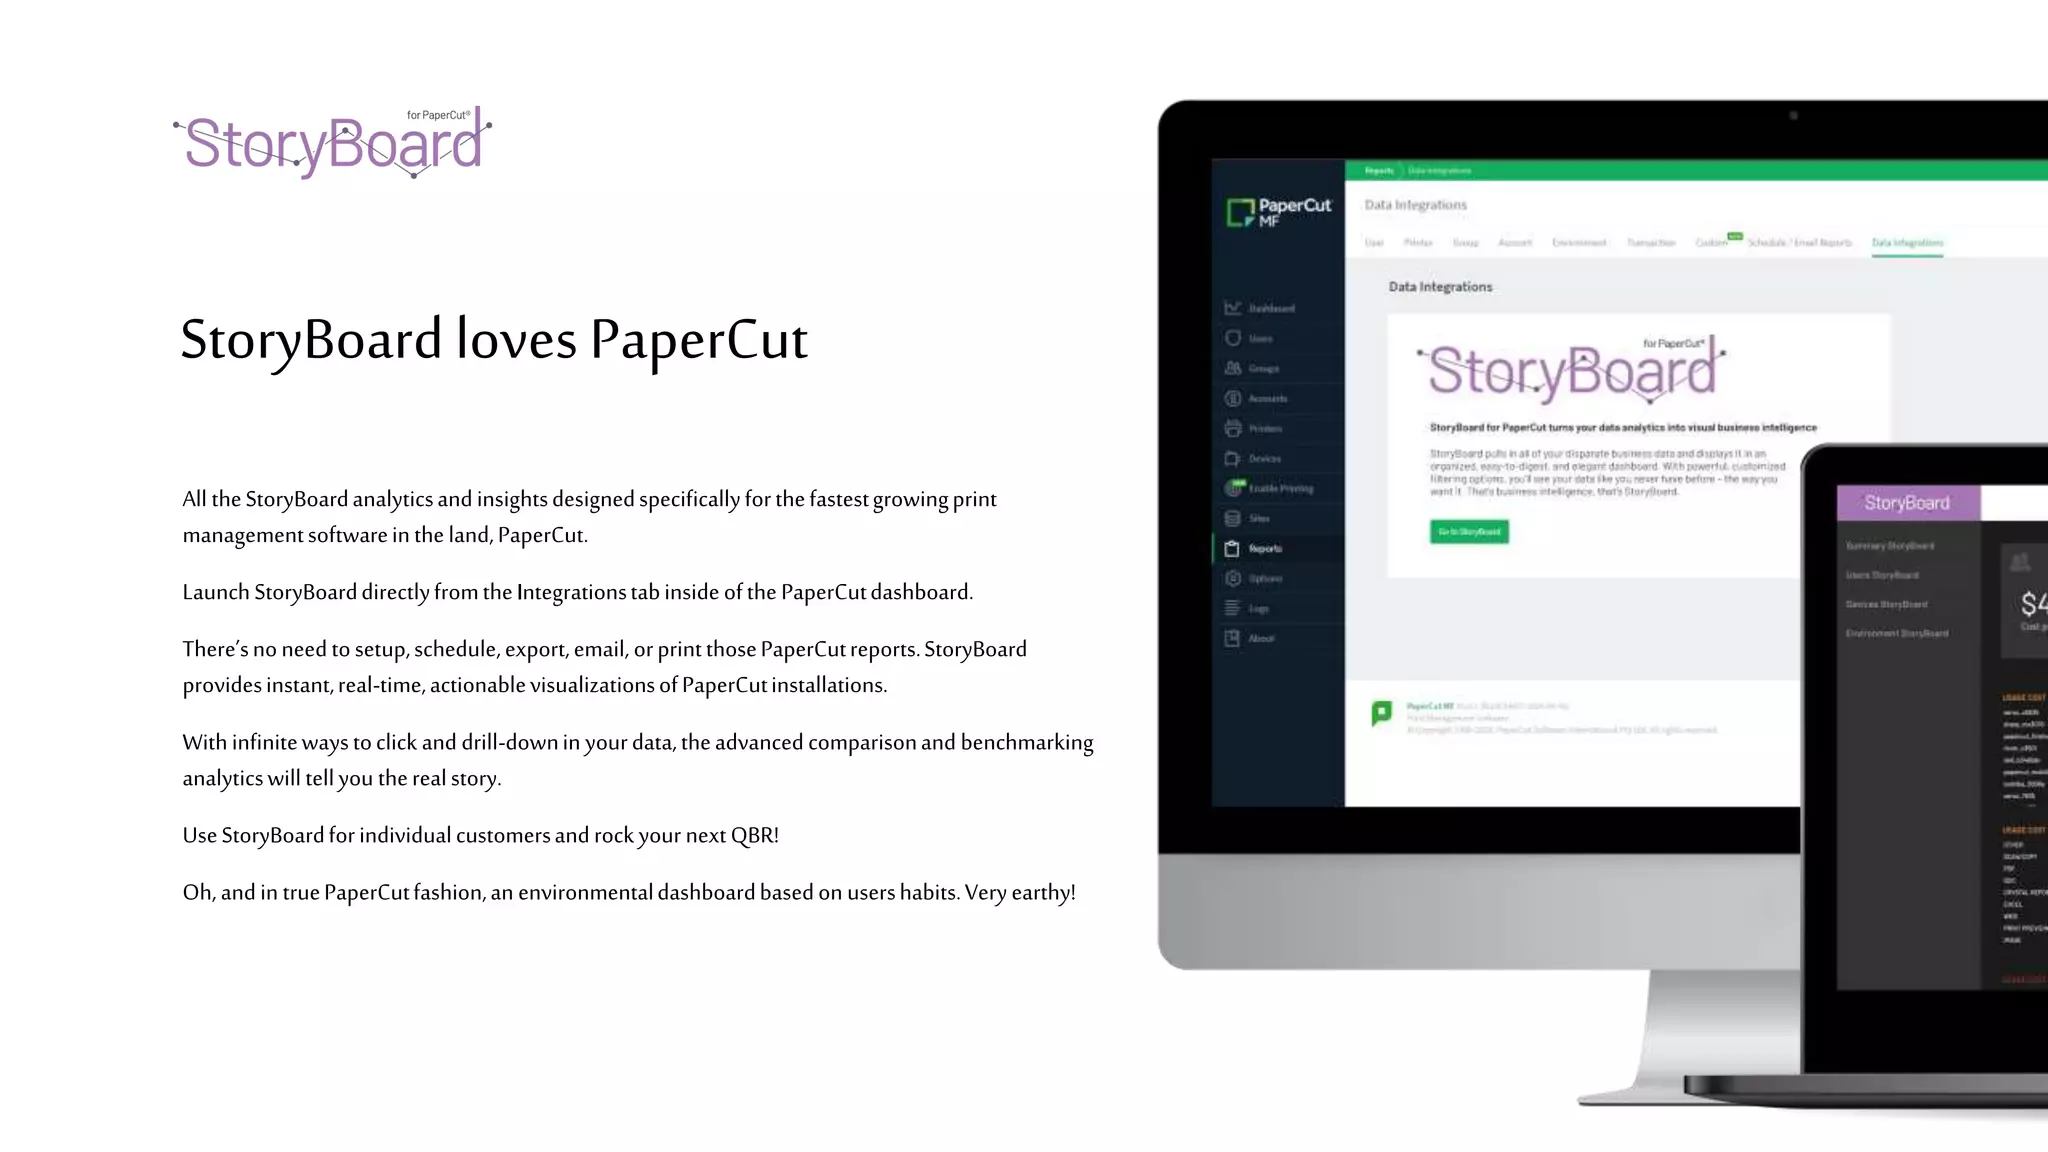


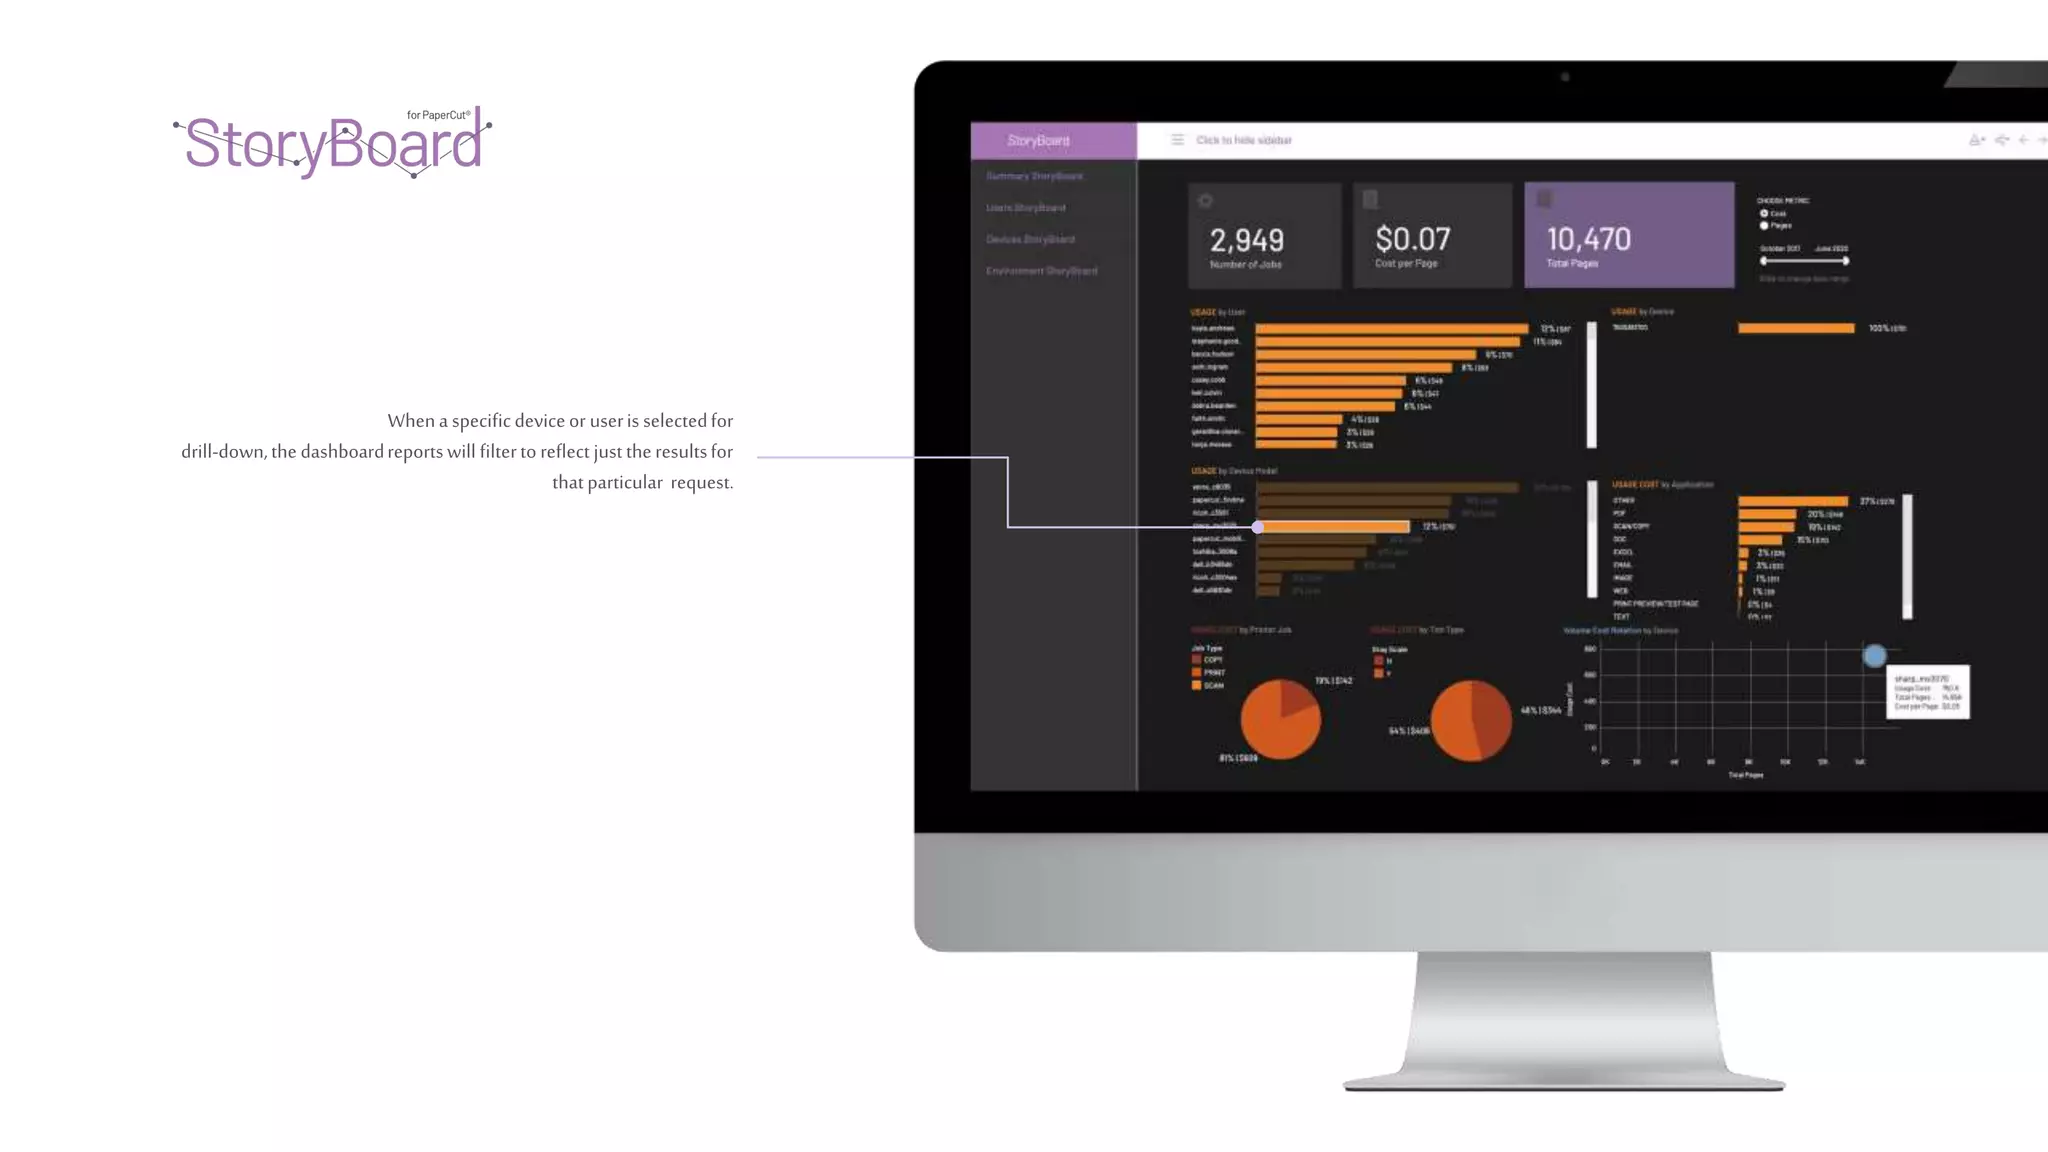


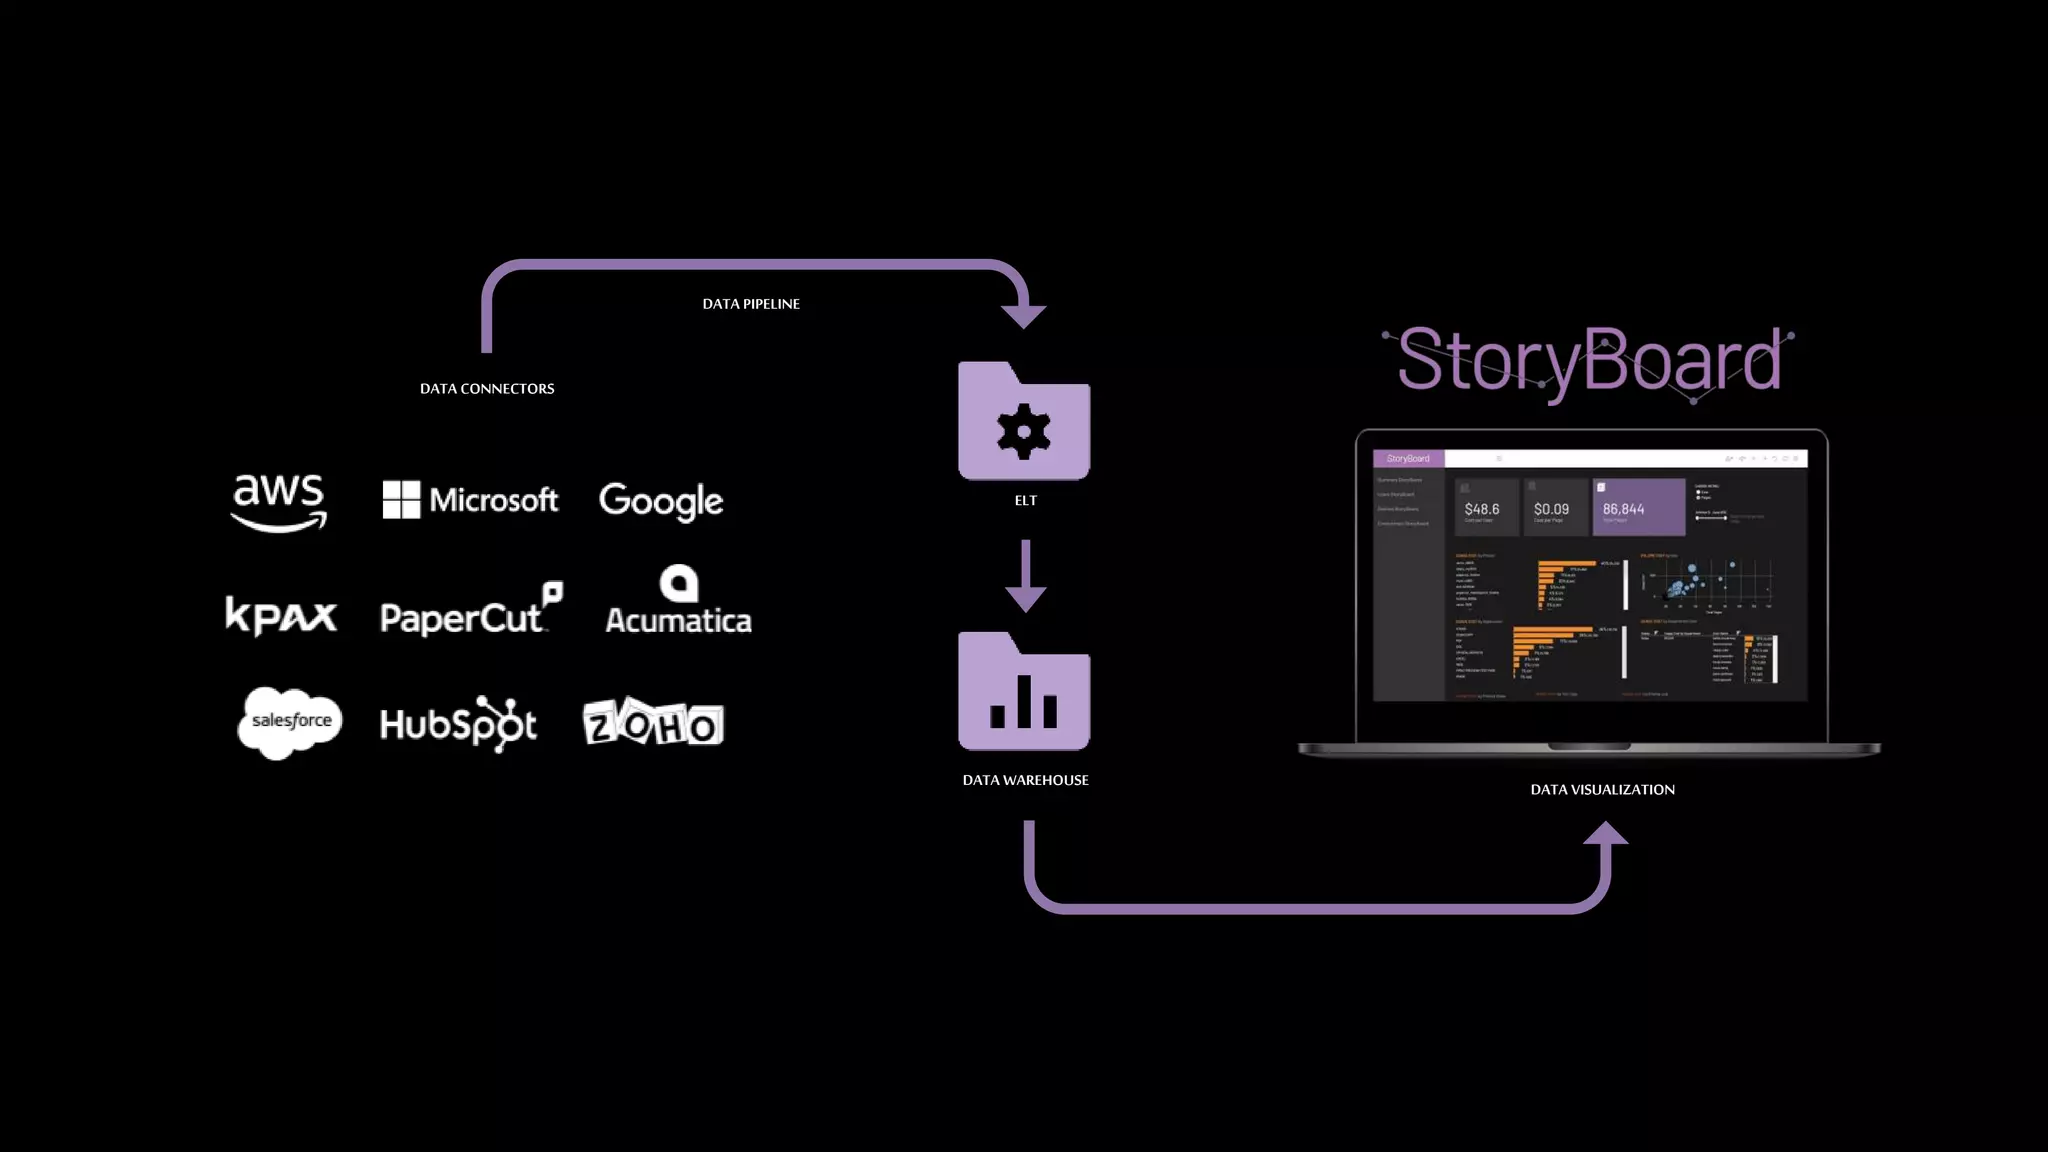

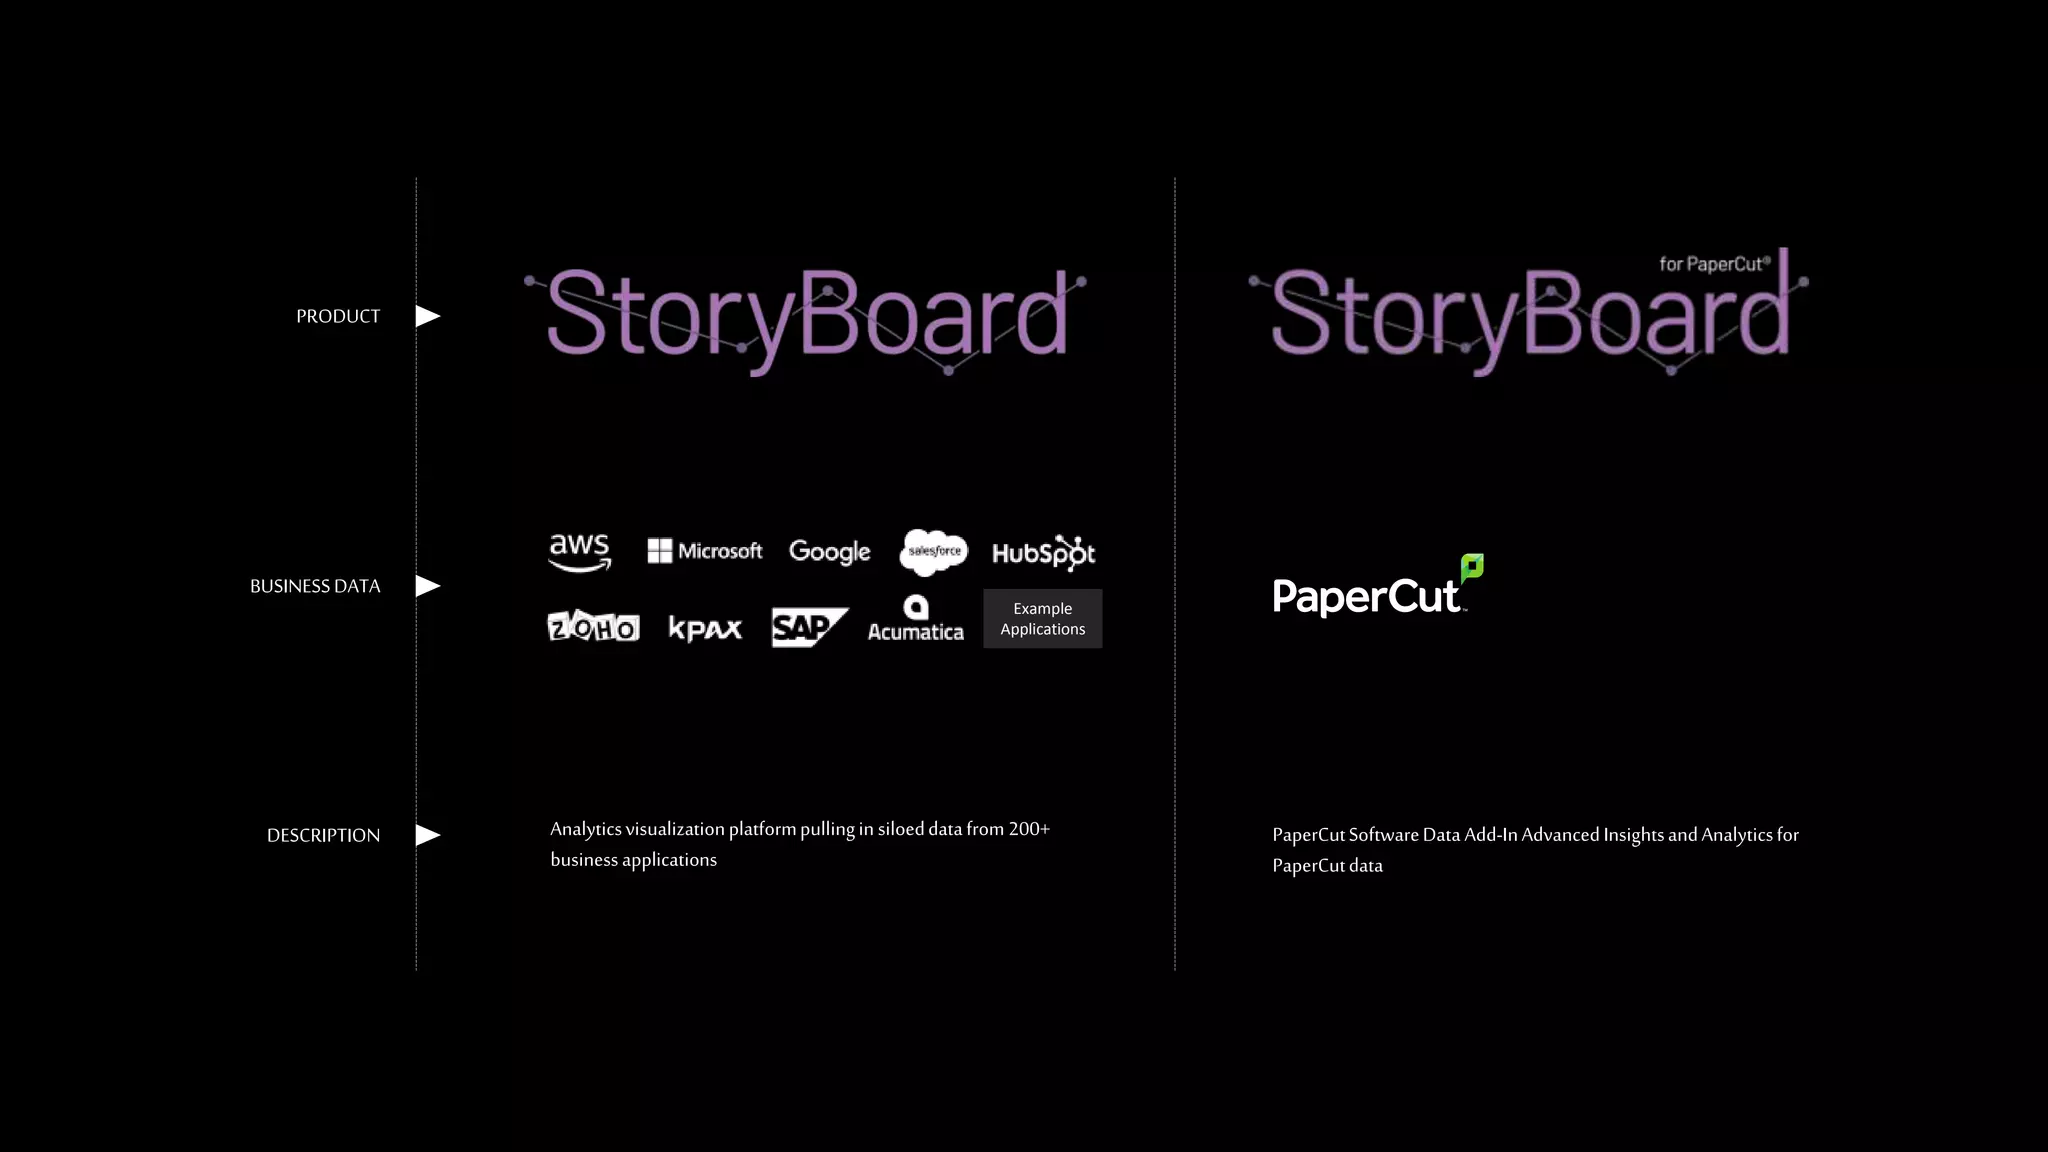


The document discusses StoryBoard, a business intelligence platform that combines data from multiple sources to provide a complete story through actionable visualizations. It can integrate data from over 200 applications using connectors and provide analytics and visualizations to help businesses with tasks like benchmarking, predicting needs, analyzing locations and costs, creating educational pathways, and detecting anomalies. Examples are given for healthcare, real estate, education, finance, manufacturing, and e-commerce. StoryBoard also has specific integrations and analytics for the PaperCut print management software.


