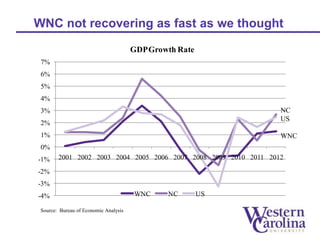
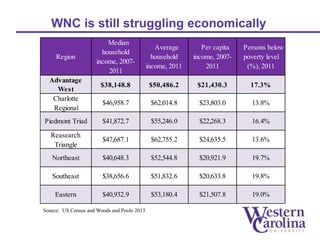
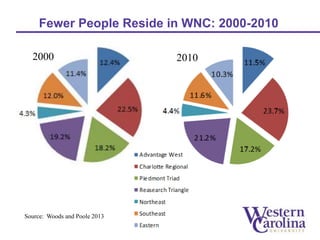
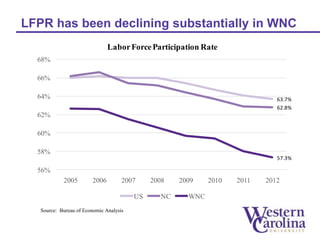
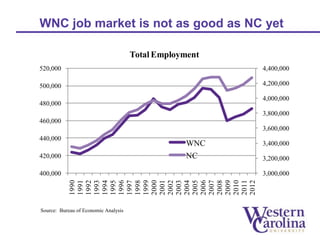
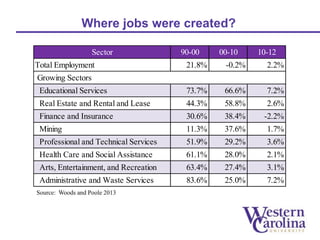
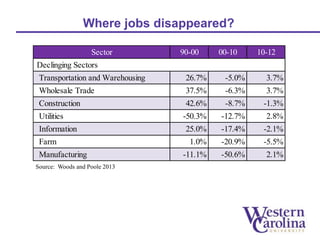
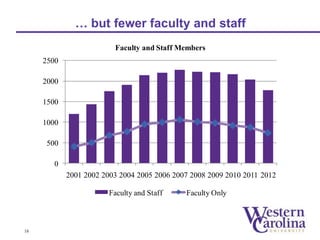
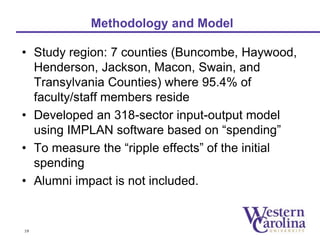
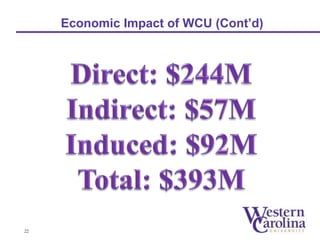
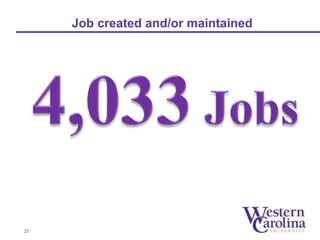
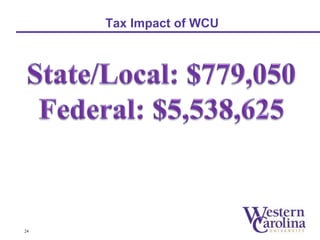
1 
Regional Outlook Report 2014 
Regional Economic Activities of Western North 
Carolina and Economic Impact of Western 
Carolina University 
Inhyuck “Steve” Ha, Ph.D. 
Professor of Economics 
College of Business 
November 12, 2014
WNC not recovering as fast as we thought 
7% 
6% 
5% 
4% 
3% 
2% 
1% 
0% 
-1% 
-2% 
-3% 
-4% 
2001 2002 2003 2004 2005 2006 2007 2008 2009 2010 2011 2012 
Source: Bureau of Economic Analysis 
GDP Growth Rate 
WNC NC US 
NC 
US 
WNC
Seven Economic Development Partnerships
WNC is still struggling economically 
Region 
Median 
household 
income, 2007- 
2011 
Average 
household 
income, 2011 
Per capita 
income, 2007- 
2011 
Persons below 
poverty level 
(%), 2011 
Advantage 
West 
$38,148.8 $50,486.2 $21,430.3 17.3% 
Charlotte 
Regional 
$46,958.7 $62,014.8 $23,803.0 13.8% 
Piedmont Triad $41,872.7 $55,246.0 $22,268.3 16.4% 
Reasearch 
Triangle 
$47,687.1 $62,755.2 $24,635.5 13.6% 
Northeast $40,648.3 $52,544.8 $20,921.9 19.7% 
Southeast $38,656.6 $51,832.6 $20,633.8 19.8% 
Eastern $40,932.9 $53,180.4 $21,507.8 19.0% 
Source: US Census and Woods and Poole 2013
Fewer People Reside in WNC: 2000-2010 
2000 2010 
Source: Woods and Poole 2013
LFPR has been declining substantially in WNC 
68% 
66% 
64% 
62% 
60% 
58% 
Labor Force Participation Rate 
Source: Bureau of Economic Analysis 
63.7% 
62.8% 
57.3% 
56% 
2005 2006 2007 2008 2009 2010 2011 2012 
US NC WNC
WNC job market is not as good as NC yet 
520,000 
500,000 
480,000 
460,000 
440,000 
420,000 
Source: Bureau of Economic Analysis 
4,400,000 
4,200,000 
4,000,000 
3,800,000 
3,600,000 
3,400,000 
3,200,000 
3,000,000 
400,000 
Total Employment 
WNC 
NC 
1990 
1991 
1992 
1993 
1994 
1995 
1996 
1997 
1998 
1999 
2000 
2001 
2002 
2003 
2004 
2005 
2006 
2007 
2008 
2009 
2010 
2011 
2012
Where jobs were created? 
Sector 90-00 00-10 10-12 
Total Employment 21.8% -0.2% 2.2% 
Growing Sectors 
Educational Services 73.7% 66.6% 7.2% 
Real Estate and Rental and Lease 44.3% 58.8% 2.6% 
Finance and Insurance 30.6% 38.4% -2.2% 
Mining 11.3% 37.6% 1.7% 
Professional and Technical Services 51.9% 29.2% 3.6% 
Health Care and Social Assistance 61.1% 28.0% 2.1% 
Arts, Entertainment, and Recreation 63.4% 27.4% 3.1% 
Administrative and Waste Services 83.6% 25.0% 7.2% 
Source: Woods and Poole 2013
Where jobs disappeared? 
Sector 90-00 00-10 10-12 
Declinging Sectors 
Transportation and Warehousing 26.7% -5.0% 3.7% 
Wholesale Trade 37.5% -6.3% 3.7% 
Construction 42.6% -8.7% -1.3% 
Utilities -50.3% -12.7% 2.8% 
Information 25.0% -17.4% -2.1% 
Farm 1.0% -20.9% -5.5% 
Manufacturing -11.1% -50.6% 2.1% 
Source: Woods and Poole 2013
Location Quotient Analysis 
• To identify the unique characteristics of an 
economy’s industrial structure 
• LQ indicates the employment density of an 
economy - to measure an industry’s labor 
concentration in a specific region 
• If LQ > 1, then it means the industry employs a 
larger share of the work force regionally than on 
a statewide basis. 
10
Location Quotient Analysis Results 
Sector 
Top Five Sectors 
Source: IMPLAN Data 2012 
Percent of Employment Location 
WNC NC 
Quotient 
Mining 0.2% 0.2% 1.44 
Utilities 0.4% 0.3% 1.39 
Construction 7.8% 5.9% 1.33 
Real estate & rental 5.1% 4.2% 1.23 
Health & social services 12.3% 10.1% 1.22
Location Quotient Analysis Results (Cont’d) 
Sector 
Bottom Five Sectors 
Source: IMPLAN Data 2012 
Percent of Employment Location 
WNC NC 
Quotient 
Educational services 1.4% 2.0% 0.72 
Wholesale Trade 2.5% 3.4% 0.72 
Information 1.0% 1.5% 0.68 
Finance & insurance 3.7% 5.4% 0.67 
Management of companies 0.7% 1.4% 0.48
Economic Multiplier Analysis 
• Any initial spending has a ripple effect through the 
economy as successive rounds of re-spending 
enlarge its impact. 
• The direct effect is the original impact of new 
spending on the first tier of suppliers. 
• The indirect effect estimates the changes in inter-industry 
purchases as they respond to new demand. 
• The induced effect refers to the changes in 
spending from households due to changes in 
production. 
13
Employment Multipliers 
Sector Employment Multiplier 
Top Five Sectors 
Information 2.24 
Utilities 2.18 
Finance & insurance 2.15 
Manufacturing 2.13 
Management of companies 2.03 
Source: IMPLAN Data 2012
Employment Multipliers (Cont’d) 
Sector Employment Multiplier 
Bottom Five Sectors 
Real estate & rental 1.38 
Retail trade 1.36 
Arts- entertainment & recreation 1.33 
Administrative & waste services 1.33 
Accomodation & food services 1.30 
Source: IMPLAN Data 2012
The Economic and Fiscal Impact 
of Western Carolina University 
in Western North Carolina 
16
Enrollment increased tremendously 
17 
11000 
10,382 
5000 
6000 
7000 
8000 
9000 
10000 
1972 
1974 
1976 
1978 
1980 
1982 
1984 
1986 
1988 
1990 
1992 
1994 
1996 
1998 
2000 
2002 
2004 
2006 
2008 
2010 
2012 
2014 
Total Enrollment: 1972 - 2014
… but fewer faculty and staff 
18 
2500 
2000 
1500 
1000 
500 
0 
Faculty and Staff Members 
2001 2002 2003 2004 2005 2006 2007 2008 2009 2010 2011 2012 
Faculty and Staff Faculty Only
Methodology and Model 
• Study region: 7 counties (Buncombe, Haywood, 
Henderson, Jackson, Macon, Swain, and 
Transylvania Counties) where 95.4% of 
faculty/staff members reside 
• Developed an 318-sector input-output model 
using IMPLAN software based on “spending” 
• To measure the “ripple effects” of the initial 
spending 
• Alumni impact is not included. 
19
Data Collection 
• Data included: 
– Payroll expenditures 
– WCU’s operating expenditures 
– WCU’s capital expenditures 
– Student expenditures 
– Visitor expenditures 
• WCU student and faculty/staff surveys 
conducted 
• Directors interviewed 
20
Economic Impact of WCU 
21
Economic Impact of WCU (Cont’d) 
22
Job created and/or maintained 
23
Tax Impact of WCU 
24
25 
Thank you!

Regional Outlook Report - Steve Ha - LEAD:WNC 2014

  • 1.
    1 Regional OutlookReport 2014 Regional Economic Activities of Western North Carolina and Economic Impact of Western Carolina University Inhyuck “Steve” Ha, Ph.D. Professor of Economics College of Business November 12, 2014
  • 2.
    WNC not recoveringas fast as we thought 7% 6% 5% 4% 3% 2% 1% 0% -1% -2% -3% -4% 2001 2002 2003 2004 2005 2006 2007 2008 2009 2010 2011 2012 Source: Bureau of Economic Analysis GDP Growth Rate WNC NC US NC US WNC
  • 3.
  • 4.
    WNC is stillstruggling economically Region Median household income, 2007- 2011 Average household income, 2011 Per capita income, 2007- 2011 Persons below poverty level (%), 2011 Advantage West $38,148.8 $50,486.2 $21,430.3 17.3% Charlotte Regional $46,958.7 $62,014.8 $23,803.0 13.8% Piedmont Triad $41,872.7 $55,246.0 $22,268.3 16.4% Reasearch Triangle $47,687.1 $62,755.2 $24,635.5 13.6% Northeast $40,648.3 $52,544.8 $20,921.9 19.7% Southeast $38,656.6 $51,832.6 $20,633.8 19.8% Eastern $40,932.9 $53,180.4 $21,507.8 19.0% Source: US Census and Woods and Poole 2013
  • 5.
    Fewer People Residein WNC: 2000-2010 2000 2010 Source: Woods and Poole 2013
  • 6.
    LFPR has beendeclining substantially in WNC 68% 66% 64% 62% 60% 58% Labor Force Participation Rate Source: Bureau of Economic Analysis 63.7% 62.8% 57.3% 56% 2005 2006 2007 2008 2009 2010 2011 2012 US NC WNC
  • 7.
    WNC job marketis not as good as NC yet 520,000 500,000 480,000 460,000 440,000 420,000 Source: Bureau of Economic Analysis 4,400,000 4,200,000 4,000,000 3,800,000 3,600,000 3,400,000 3,200,000 3,000,000 400,000 Total Employment WNC NC 1990 1991 1992 1993 1994 1995 1996 1997 1998 1999 2000 2001 2002 2003 2004 2005 2006 2007 2008 2009 2010 2011 2012
  • 8.
    Where jobs werecreated? Sector 90-00 00-10 10-12 Total Employment 21.8% -0.2% 2.2% Growing Sectors Educational Services 73.7% 66.6% 7.2% Real Estate and Rental and Lease 44.3% 58.8% 2.6% Finance and Insurance 30.6% 38.4% -2.2% Mining 11.3% 37.6% 1.7% Professional and Technical Services 51.9% 29.2% 3.6% Health Care and Social Assistance 61.1% 28.0% 2.1% Arts, Entertainment, and Recreation 63.4% 27.4% 3.1% Administrative and Waste Services 83.6% 25.0% 7.2% Source: Woods and Poole 2013
  • 9.
    Where jobs disappeared? Sector 90-00 00-10 10-12 Declinging Sectors Transportation and Warehousing 26.7% -5.0% 3.7% Wholesale Trade 37.5% -6.3% 3.7% Construction 42.6% -8.7% -1.3% Utilities -50.3% -12.7% 2.8% Information 25.0% -17.4% -2.1% Farm 1.0% -20.9% -5.5% Manufacturing -11.1% -50.6% 2.1% Source: Woods and Poole 2013
  • 10.
    Location Quotient Analysis • To identify the unique characteristics of an economy’s industrial structure • LQ indicates the employment density of an economy - to measure an industry’s labor concentration in a specific region • If LQ > 1, then it means the industry employs a larger share of the work force regionally than on a statewide basis. 10
  • 11.
    Location Quotient AnalysisResults Sector Top Five Sectors Source: IMPLAN Data 2012 Percent of Employment Location WNC NC Quotient Mining 0.2% 0.2% 1.44 Utilities 0.4% 0.3% 1.39 Construction 7.8% 5.9% 1.33 Real estate & rental 5.1% 4.2% 1.23 Health & social services 12.3% 10.1% 1.22
  • 12.
    Location Quotient AnalysisResults (Cont’d) Sector Bottom Five Sectors Source: IMPLAN Data 2012 Percent of Employment Location WNC NC Quotient Educational services 1.4% 2.0% 0.72 Wholesale Trade 2.5% 3.4% 0.72 Information 1.0% 1.5% 0.68 Finance & insurance 3.7% 5.4% 0.67 Management of companies 0.7% 1.4% 0.48
  • 13.
    Economic Multiplier Analysis • Any initial spending has a ripple effect through the economy as successive rounds of re-spending enlarge its impact. • The direct effect is the original impact of new spending on the first tier of suppliers. • The indirect effect estimates the changes in inter-industry purchases as they respond to new demand. • The induced effect refers to the changes in spending from households due to changes in production. 13
  • 14.
    Employment Multipliers SectorEmployment Multiplier Top Five Sectors Information 2.24 Utilities 2.18 Finance & insurance 2.15 Manufacturing 2.13 Management of companies 2.03 Source: IMPLAN Data 2012
  • 15.
    Employment Multipliers (Cont’d) Sector Employment Multiplier Bottom Five Sectors Real estate & rental 1.38 Retail trade 1.36 Arts- entertainment & recreation 1.33 Administrative & waste services 1.33 Accomodation & food services 1.30 Source: IMPLAN Data 2012
  • 16.
    The Economic andFiscal Impact of Western Carolina University in Western North Carolina 16
  • 17.
    Enrollment increased tremendously 17 11000 10,382 5000 6000 7000 8000 9000 10000 1972 1974 1976 1978 1980 1982 1984 1986 1988 1990 1992 1994 1996 1998 2000 2002 2004 2006 2008 2010 2012 2014 Total Enrollment: 1972 - 2014
  • 18.
    … but fewerfaculty and staff 18 2500 2000 1500 1000 500 0 Faculty and Staff Members 2001 2002 2003 2004 2005 2006 2007 2008 2009 2010 2011 2012 Faculty and Staff Faculty Only
  • 19.
    Methodology and Model • Study region: 7 counties (Buncombe, Haywood, Henderson, Jackson, Macon, Swain, and Transylvania Counties) where 95.4% of faculty/staff members reside • Developed an 318-sector input-output model using IMPLAN software based on “spending” • To measure the “ripple effects” of the initial spending • Alumni impact is not included. 19
  • 20.
    Data Collection •Data included: – Payroll expenditures – WCU’s operating expenditures – WCU’s capital expenditures – Student expenditures – Visitor expenditures • WCU student and faculty/staff surveys conducted • Directors interviewed 20
  • 21.
  • 22.
    Economic Impact ofWCU (Cont’d) 22
  • 23.
    Job created and/ormaintained 23
  • 24.
  • 25.

Editor's Notes

  • #18 Enrollment has increased by 8.1% for the past three years.