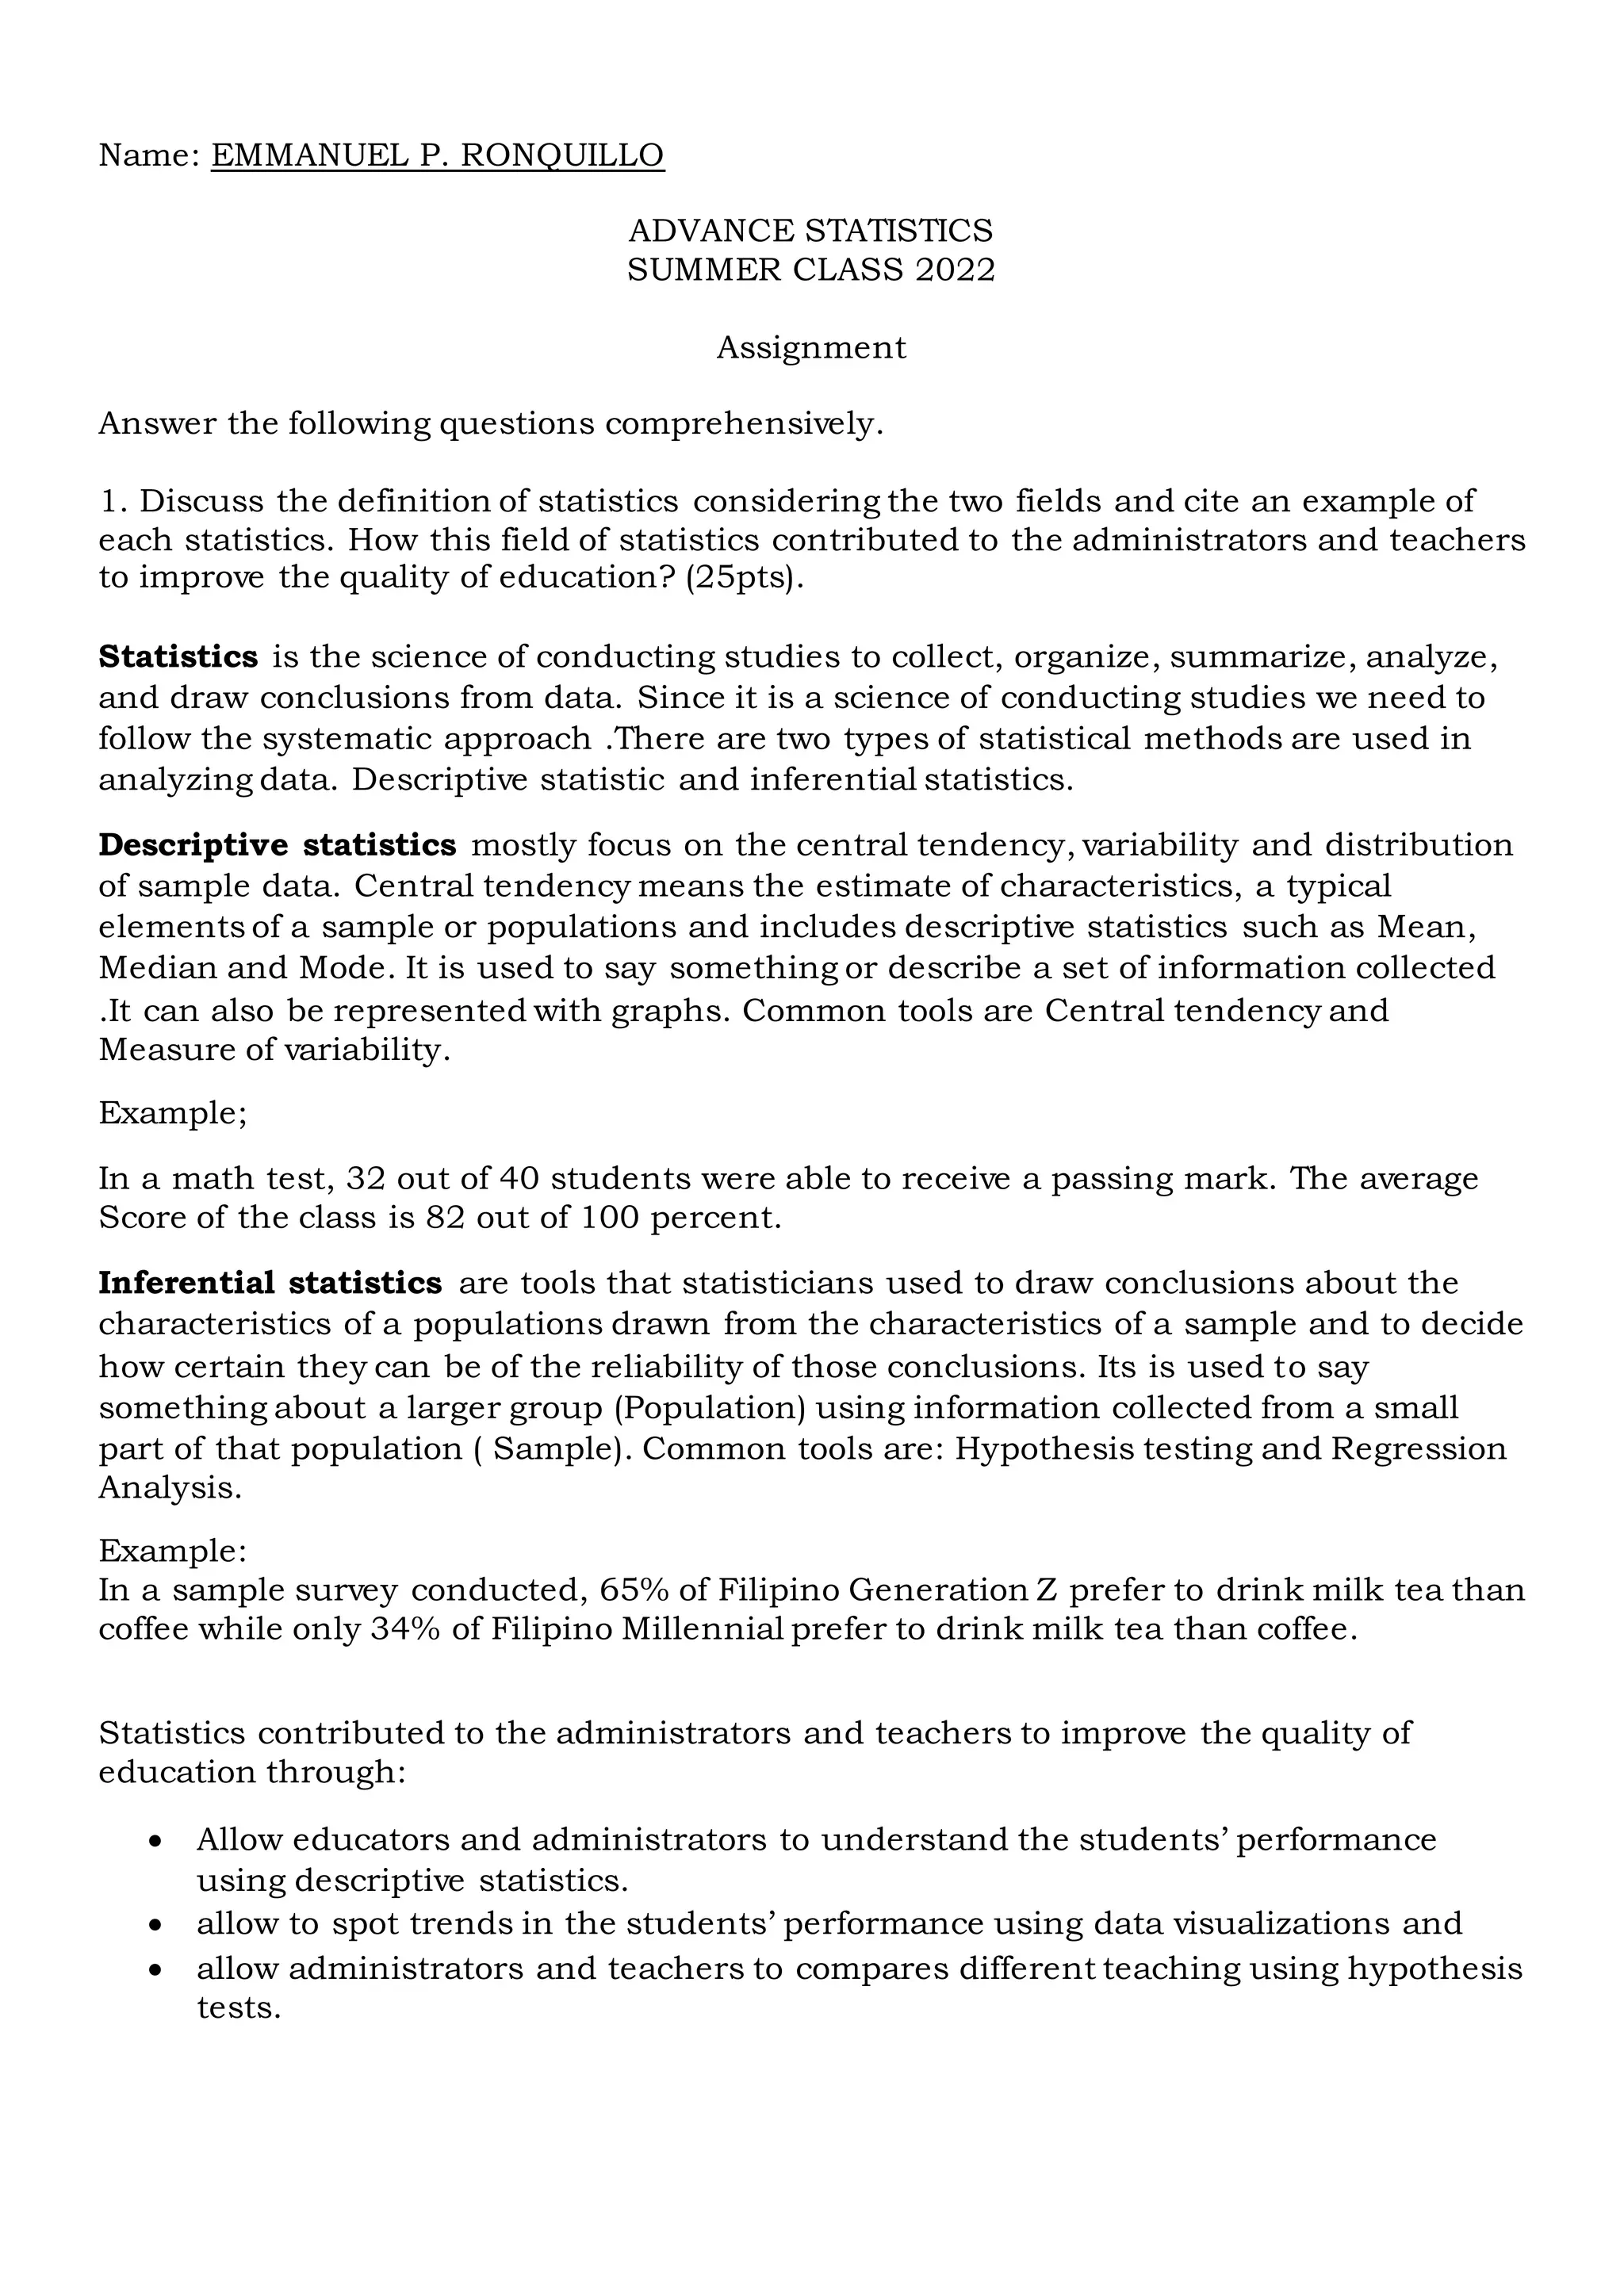
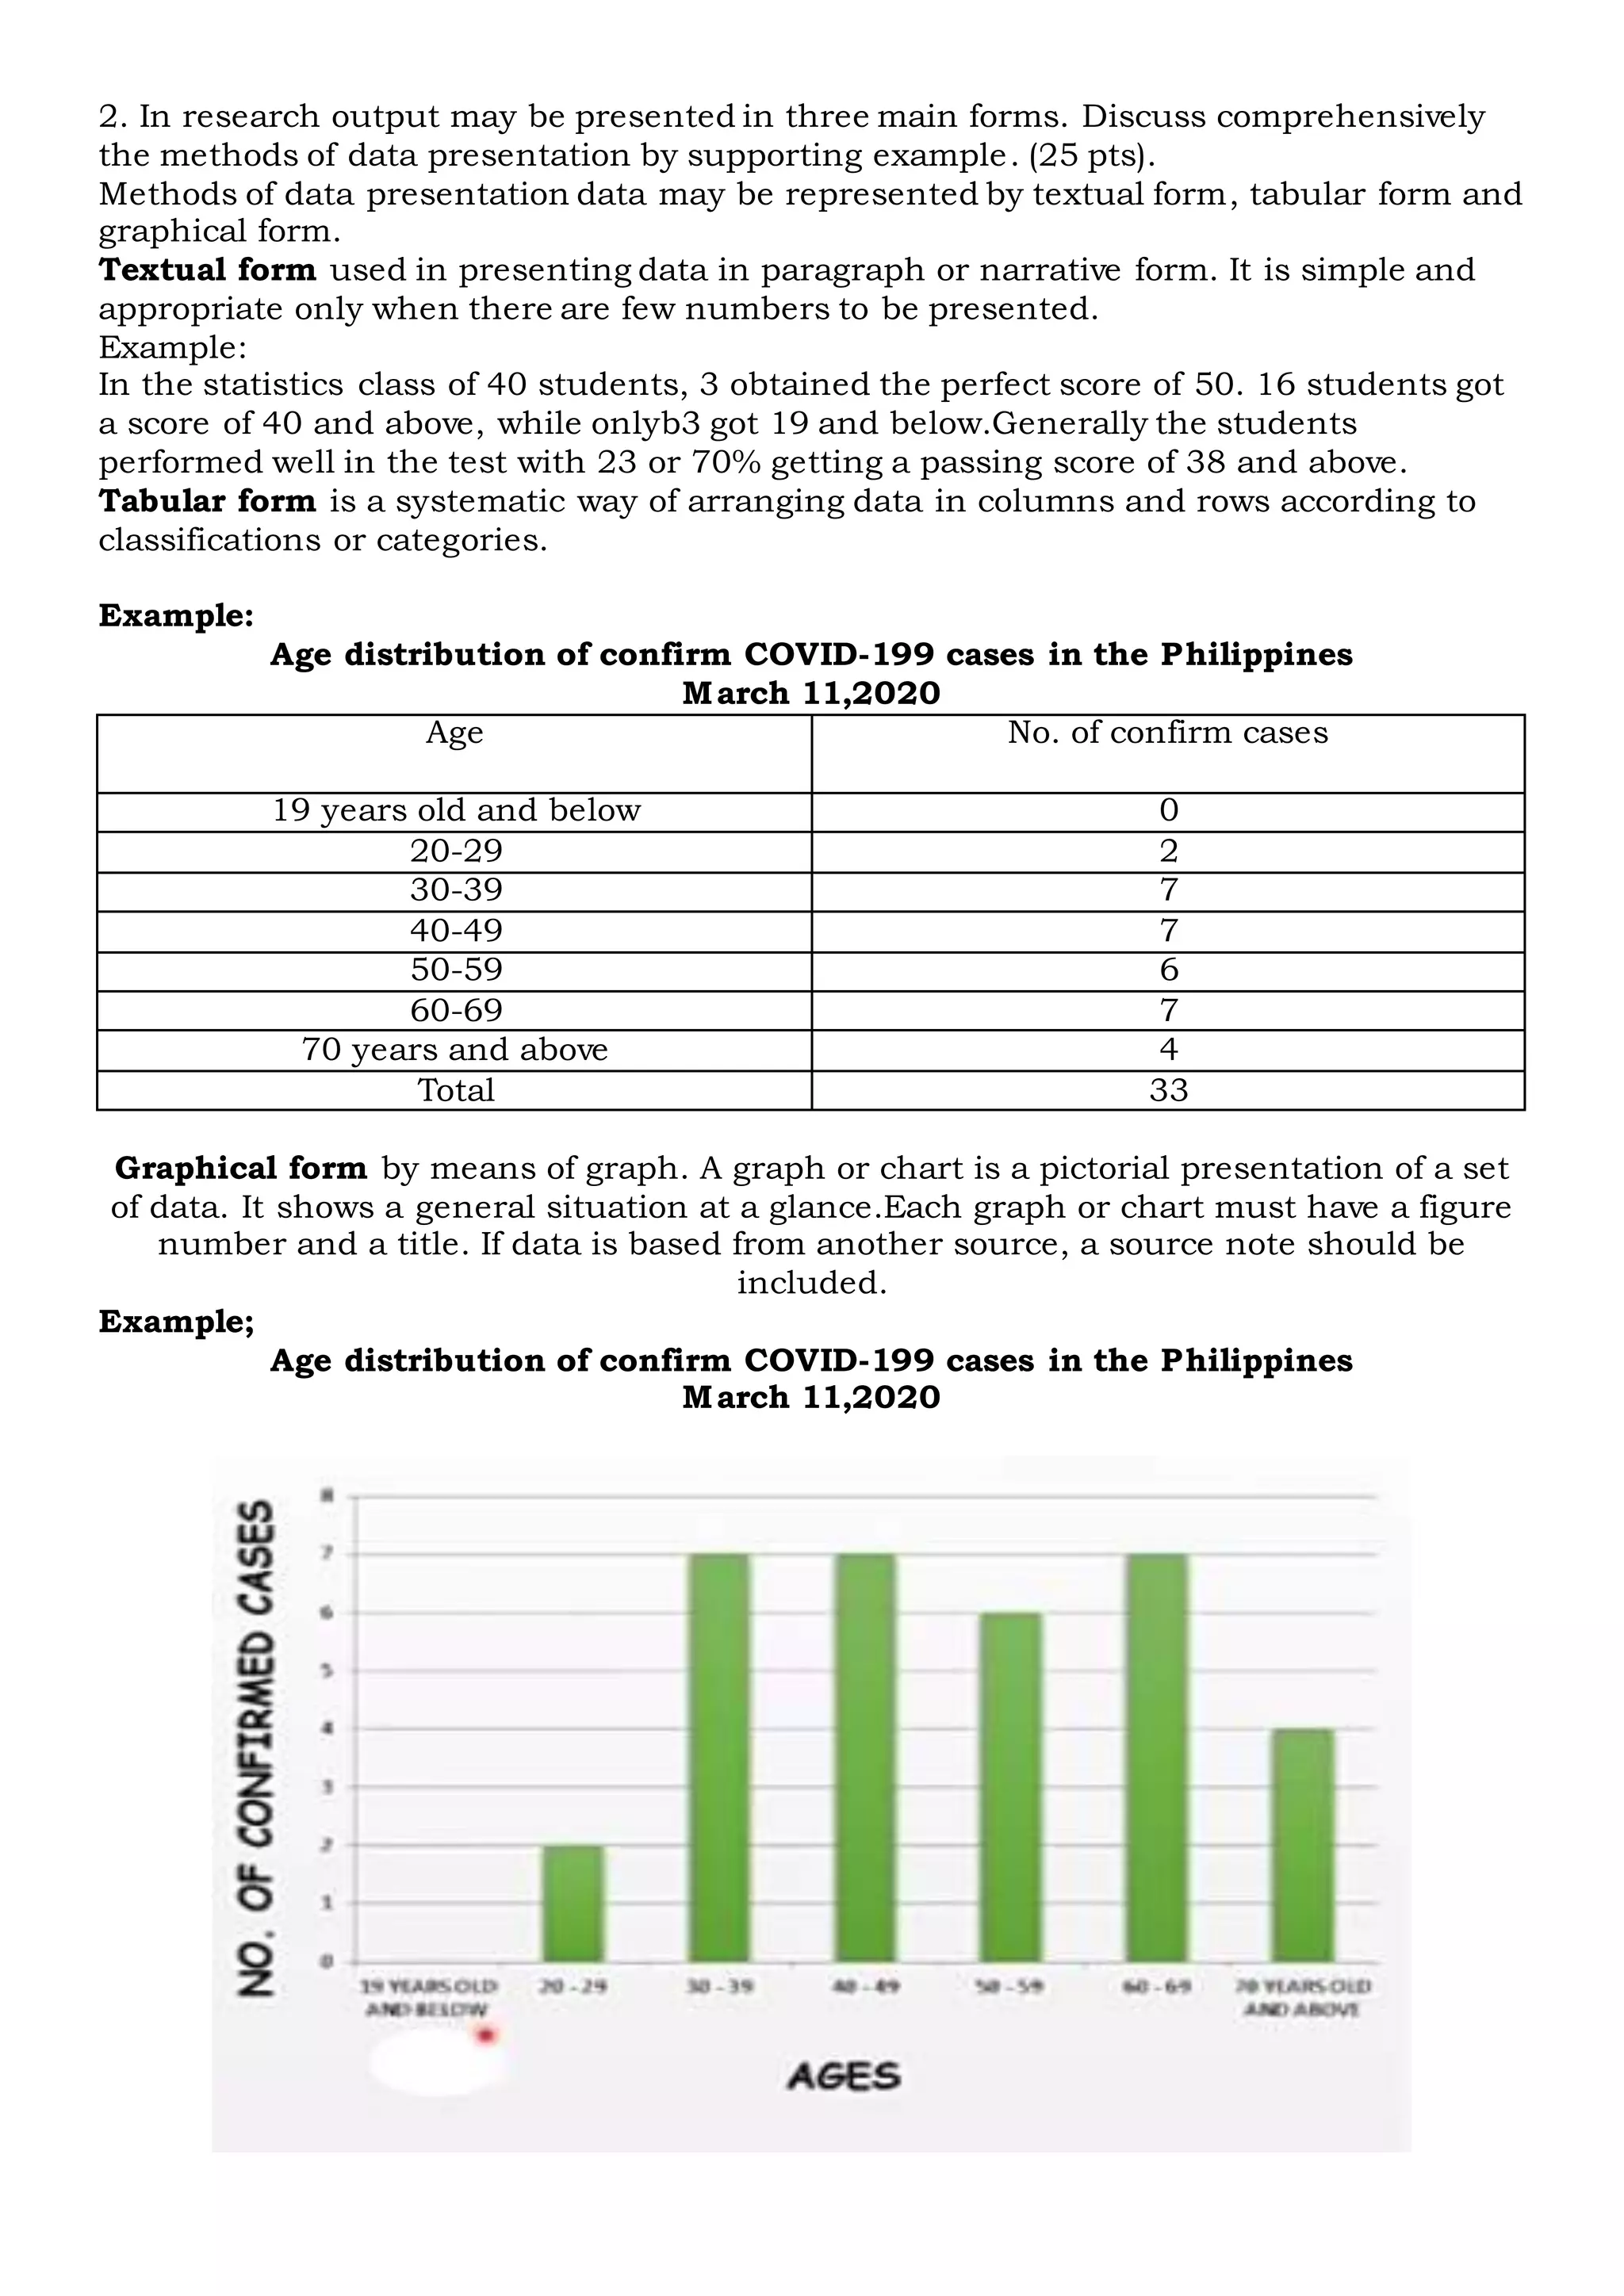
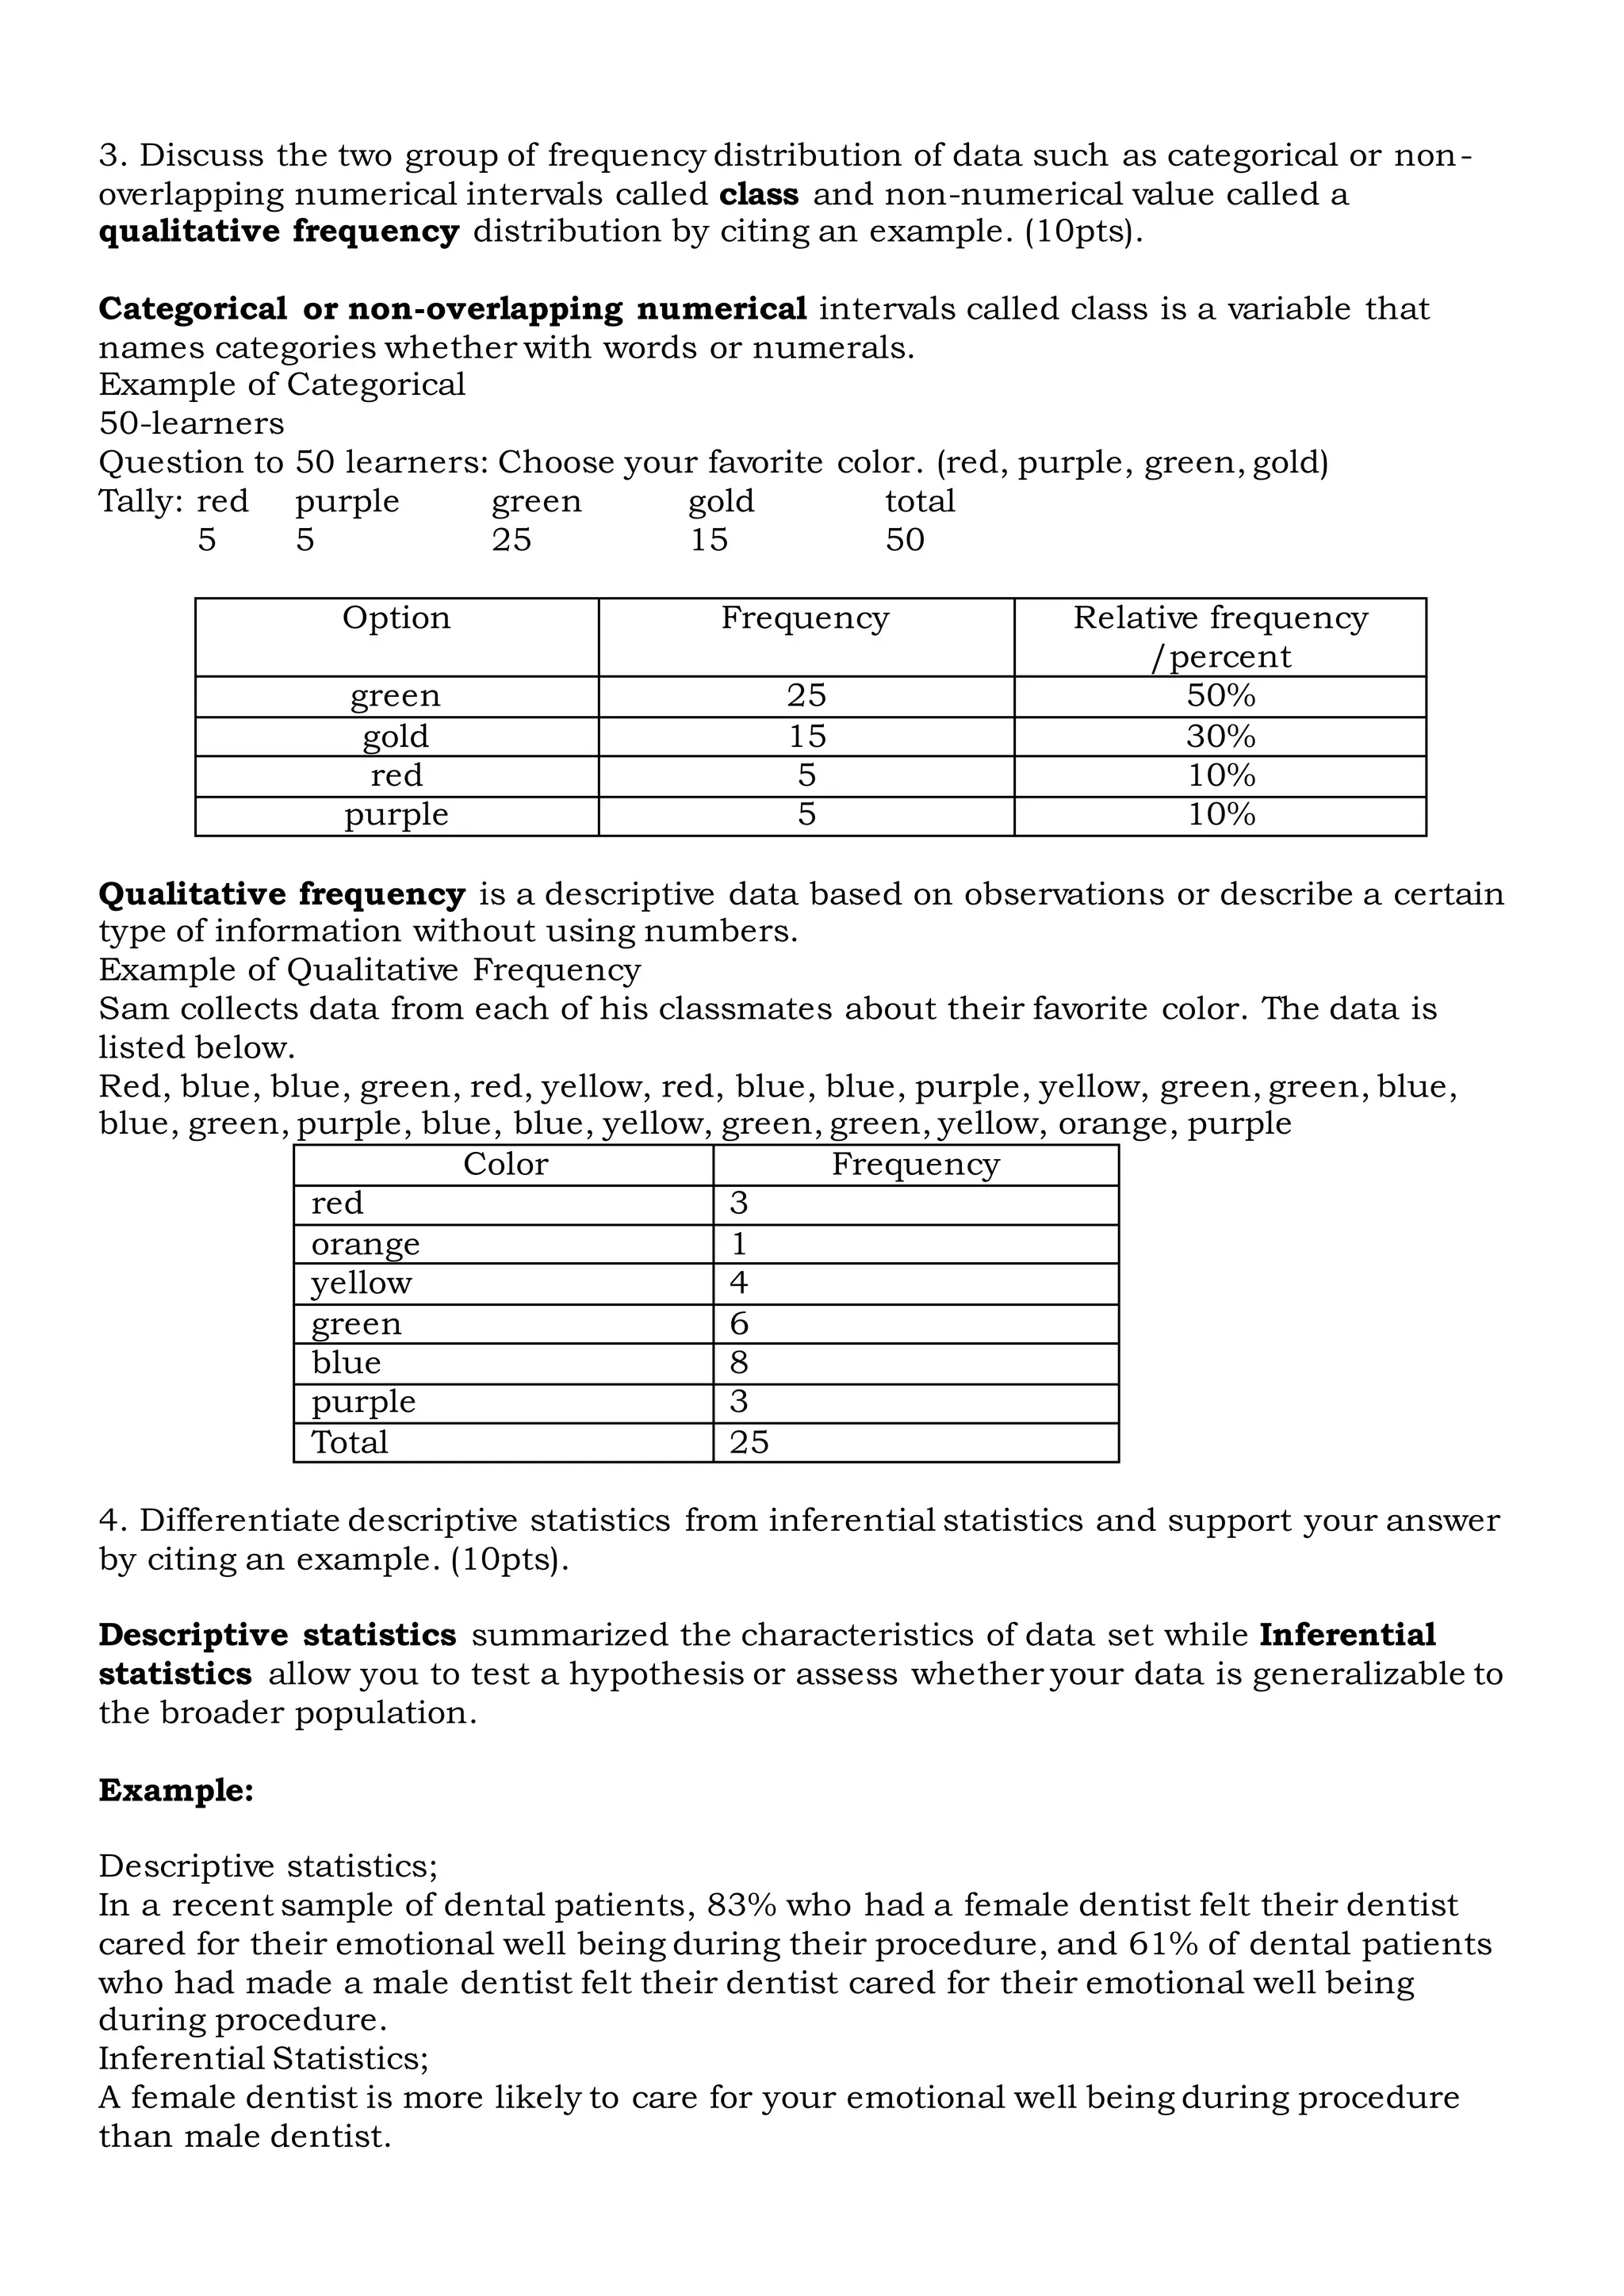
SlideShare a Scribd company logo
Name: EMMANUEL P. RONQUILLO
ADVANCE STATISTICS
SUMMER CLASS 2022
Assignment
Answer the following questions comprehensively.
1. Discuss the definition of statistics considering the two fields and cite an example of
each statistics. How this field of statistics contributed to the administrators and teachers
to improve the quality of education? (25pts).
Statistics is the science of conducting studies to collect, organize, summarize, analyze,
and draw conclusions from data. Since it is a science of conducting studies we need to
follow the systematic approach .There are two types of statistical methods are used in
analyzing data. Descriptive statistic and inferential statistics.
Descriptive statistics mostly focus on the central tendency, variability and distribution
of sample data. Central tendency means the estimate of characteristics, a typical
elements of a sample or populations and includes descriptive statistics such as Mean,
Median and Mode. It is used to say something or describe a set of information collected
.It can also be represented with graphs. Common tools are Central tendency and
Measure of variability.
Example;
In a math test, 32 out of 40 students were able to receive a passing mark. The average
Score of the class is 82 out of 100 percent.
Inferential statistics are tools that statisticians used to draw conclusions about the
characteristics of a populations drawn from the characteristics of a sample and to decide
how certain they can be of the reliability of those conclusions. Its is used to say
something about a larger group (Population) using information collected from a small
part of that population ( Sample). Common tools are: Hypothesis testing and Regression
Analysis.
Example:
In a sample survey conducted, 65% of Filipino Generation Z prefer to drink milk tea than
coffee while only 34% of Filipino Millennial prefer to drink milk tea than coffee.
Statistics contributed to the administrators and teachers to improve the quality of
education through:
 Allow educators and administrators to understand the students’ performance
using descriptive statistics.
 allow to spot trends in the students’ performance using data visualizations and
 allow administrators and teachers to compares different teaching using hypothesis
tests.
2. In research output may be presented in three main forms. Discuss comprehensively
the methods of data presentation by supporting example. (25 pts).
Methods of data presentation data may be represented by textual form, tabular form and
graphical form.
Textual form used in presenting data in paragraph or narrative form. It is simple and
appropriate only when there are few numbers to be presented.
Example:
In the statistics class of 40 students, 3 obtained the perfect score of 50. 16 students got
a score of 40 and above, while onlyb3 got 19 and below.Generally the students
performed well in the test with 23 or 70% getting a passing score of 38 and above.
Tabular form is a systematic way of arranging data in columns and rows according to
classifications or categories.
Example:
Age distribution of confirm COVID-199 cases in the Philippines
March 11,2020
Age No. of confirm cases
19 years old and below 0
20-29 2
30-39 7
40-49 7
50-59 6
60-69 7
70 years and above 4
Total 33
Graphical form by means of graph. A graph or chart is a pictorial presentation of a set
of data. It shows a general situation at a glance.Each graph or chart must have a figure
number and a title. If data is based from another source, a source note should be
included.
Example;
Age distribution of confirm COVID-199 cases in the Philippines
March 11,2020
3. Discuss the two group of frequency distribution of data such as categorical or non-
overlapping numerical intervals called class and non-numerical value called a
qualitative frequency distribution by citing an example. (10pts).
Categorical or non-overlapping numerical intervals called class is a variable that
names categories whether with words or numerals.
Example of Categorical
50-learners
Question to 50 learners: Choose your favorite color. (red, purple, green, gold)
Tally: red purple green gold total
5 5 25 15 50
Option Frequency Relative frequency
/percent
green 25 50%
gold 15 30%
red 5 10%
purple 5 10%
Qualitative frequency is a descriptive data based on observations or describe a certain
type of information without using numbers.
Example of Qualitative Frequency
Sam collects data from each of his classmates about their favorite color. The data is
listed below.
Red, blue, blue, green, red, yellow, red, blue, blue, purple, yellow, green, green, blue,
blue, green, purple, blue, blue, yellow, green, green, yellow, orange, purple
Color Frequency
red 3
orange 1
yellow 4
green 6
blue 8
purple 3
Total 25
4. Differentiate descriptive statistics from inferential statistics and support your answer
by citing an example. (10pts).
Descriptive statistics summarized the characteristics of data set while Inferential
statistics allow you to test a hypothesis or assess whether your data is generalizable to
the broader population.
Example:
Descriptive statistics;
In a recent sample of dental patients, 83% who had a female dentist felt their dentist
cared for their emotional well being during their procedure, and 61% of dental patients
who had made a male dentist felt their dentist cared for their emotional well being
during procedure.
Inferential Statistics;
A female dentist is more likely to care for your emotional well being during procedure
than male dentist.
Statistics

More Related Content

Similar to Statistics

Descriptive statistics. final
Descriptive statistics. finalDescriptive statistics. final
Descriptive statistics. final
Lyceljine Tañedo
 
Chapter three
Chapter threeChapter three
Chapter three
Andrew Domingo
 
Chapter three
Chapter threeChapter three
Chapter three
Andrew Domingo
 
New statistics
New statisticsNew statistics
New statistics
Fatima Bianca Gueco
 
Probability and statistics
Probability and statisticsProbability and statistics
Probability and statistics
Fatima Bianca Gueco
 
Probability and statistics(exercise answers)
Probability and statistics(exercise answers)Probability and statistics(exercise answers)
Probability and statistics(exercise answers)
Fatima Bianca Gueco
 
Probability and statistics
Probability and statisticsProbability and statistics
Probability and statistics
Fatima Bianca Gueco
 
Statistics1(finals)
Statistics1(finals)Statistics1(finals)
Statistics1(finals)
Fatima Bianca Gueco
 
Finals Stat 1
Finals Stat 1Finals Stat 1
Finals Stat 1
Fatima Bianca Gueco
 
Probability and statistics
Probability and statisticsProbability and statistics
Probability and statistics
trixiacruz
 
Chapter 3
Chapter 3Chapter 3
Chapter 3
klaus70
 
Probability and statistics(assign 7 and 8)
Probability and statistics(assign 7 and 8)Probability and statistics(assign 7 and 8)
Probability and statistics(assign 7 and 8)
Fatima Bianca Gueco
 
BASIC STATISTICAL TREATMENT IN RESEARCH.pptx
BASIC STATISTICAL TREATMENT IN RESEARCH.pptxBASIC STATISTICAL TREATMENT IN RESEARCH.pptx
BASIC STATISTICAL TREATMENT IN RESEARCH.pptx
ardrianmalangen2
 
Chap1 BStat SemA201 Intro.ppt
Chap1 BStat SemA201 Intro.pptChap1 BStat SemA201 Intro.ppt
Chap1 BStat SemA201 Intro.ppt
najwalyaa
 
Data Analysis
Data Analysis Data Analysis
Data Analysis
DawitDibekulu
 
Collecting Quantitative Datafinished
Collecting Quantitative DatafinishedCollecting Quantitative Datafinished
Collecting Quantitative Datafinished
zainab85
 
Week 6 - Scoring and Rating
Week 6 - Scoring and RatingWeek 6 - Scoring and Rating
Week 6 - Scoring and Rating
Syamsul Nor Azlan Mohamad
 
Useful tools with chart1
Useful tools with chart1Useful tools with chart1
Useful tools with chart1
Thomas Salvin
 
MAC411(A) Analysis in Communication Researc.ppt
MAC411(A) Analysis in Communication Researc.pptMAC411(A) Analysis in Communication Researc.ppt
MAC411(A) Analysis in Communication Researc.ppt
PreciousOsoOla
 
Time To Practice Week 3
Time To Practice Week 3Time To Practice Week 3
Time To Practice Week 3
Sarah Jimenez
 

Similar to Statistics (20)

Descriptive statistics. final
Descriptive statistics. finalDescriptive statistics. final
Descriptive statistics. final
 
Chapter three
Chapter threeChapter three
Chapter three
 
Chapter three
Chapter threeChapter three
Chapter three
 
New statistics
New statisticsNew statistics
New statistics
 
Probability and statistics
Probability and statisticsProbability and statistics
Probability and statistics
 
Probability and statistics(exercise answers)
Probability and statistics(exercise answers)Probability and statistics(exercise answers)
Probability and statistics(exercise answers)
 
Probability and statistics
Probability and statisticsProbability and statistics
Probability and statistics
 
Statistics1(finals)
Statistics1(finals)Statistics1(finals)
Statistics1(finals)
 
Finals Stat 1
Finals Stat 1Finals Stat 1
Finals Stat 1
 
Probability and statistics
Probability and statisticsProbability and statistics
Probability and statistics
 
Chapter 3
Chapter 3Chapter 3
Chapter 3
 
Probability and statistics(assign 7 and 8)
Probability and statistics(assign 7 and 8)Probability and statistics(assign 7 and 8)
Probability and statistics(assign 7 and 8)
 
BASIC STATISTICAL TREATMENT IN RESEARCH.pptx
BASIC STATISTICAL TREATMENT IN RESEARCH.pptxBASIC STATISTICAL TREATMENT IN RESEARCH.pptx
BASIC STATISTICAL TREATMENT IN RESEARCH.pptx
 
Chap1 BStat SemA201 Intro.ppt
Chap1 BStat SemA201 Intro.pptChap1 BStat SemA201 Intro.ppt
Chap1 BStat SemA201 Intro.ppt
 
Data Analysis
Data Analysis Data Analysis
Data Analysis
 
Collecting Quantitative Datafinished
Collecting Quantitative DatafinishedCollecting Quantitative Datafinished
Collecting Quantitative Datafinished
 
Week 6 - Scoring and Rating
Week 6 - Scoring and RatingWeek 6 - Scoring and Rating
Week 6 - Scoring and Rating
 
Useful tools with chart1
Useful tools with chart1Useful tools with chart1
Useful tools with chart1
 
MAC411(A) Analysis in Communication Researc.ppt
MAC411(A) Analysis in Communication Researc.pptMAC411(A) Analysis in Communication Researc.ppt
MAC411(A) Analysis in Communication Researc.ppt
 
Time To Practice Week 3
Time To Practice Week 3Time To Practice Week 3
Time To Practice Week 3
 

More from emmanuel193758

Life science
Life scienceLife science
Life science
emmanuel193758
 
biology.ppt
biology.pptbiology.ppt
biology.ppt
emmanuel193758
 
DANTE IS DRRM.pptx
DANTE IS DRRM.pptxDANTE IS DRRM.pptx
DANTE IS DRRM.pptx
emmanuel193758
 
OUTLINE PROJECTS OF THE FILIPINO ETHICS.pptx
OUTLINE PROJECTS OF THE FILIPINO ETHICS.pptxOUTLINE PROJECTS OF THE FILIPINO ETHICS.pptx
OUTLINE PROJECTS OF THE FILIPINO ETHICS.pptx
emmanuel193758
 
Earth and life science
Earth and life scienceEarth and life science
Earth and life science
emmanuel193758
 
Psychology
PsychologyPsychology
Psychology
emmanuel193758
 
emman stat.docx
emman stat.docxemman stat.docx
emman stat.docx
emmanuel193758
 
HBO.pptx
HBO.pptxHBO.pptx
HBO.pptx
emmanuel193758
 
HBO.pptx
HBO.pptxHBO.pptx
HBO.pptx
emmanuel193758
 

More from emmanuel193758 (9)

Life science
Life scienceLife science
Life science
 
biology.ppt
biology.pptbiology.ppt
biology.ppt
 
DANTE IS DRRM.pptx
DANTE IS DRRM.pptxDANTE IS DRRM.pptx
DANTE IS DRRM.pptx
 
OUTLINE PROJECTS OF THE FILIPINO ETHICS.pptx
OUTLINE PROJECTS OF THE FILIPINO ETHICS.pptxOUTLINE PROJECTS OF THE FILIPINO ETHICS.pptx
OUTLINE PROJECTS OF THE FILIPINO ETHICS.pptx
 
Earth and life science
Earth and life scienceEarth and life science
Earth and life science
 
Psychology
PsychologyPsychology
Psychology
 
emman stat.docx
emman stat.docxemman stat.docx
emman stat.docx
 
HBO.pptx
HBO.pptxHBO.pptx
HBO.pptx
 
HBO.pptx
HBO.pptxHBO.pptx
HBO.pptx
 

Recently uploaded

Pride Month Slides 2024 David Douglas School District
Pride Month Slides 2024 David Douglas School DistrictPride Month Slides 2024 David Douglas School District
Pride Month Slides 2024 David Douglas School District
David Douglas School District
 
C1 Rubenstein AP HuG xxxxxxxxxxxxxx.pptx
C1 Rubenstein AP HuG xxxxxxxxxxxxxx.pptxC1 Rubenstein AP HuG xxxxxxxxxxxxxx.pptx
C1 Rubenstein AP HuG xxxxxxxxxxxxxx.pptx
mulvey2
 
World environment day ppt For 5 June 2024
World environment day ppt For 5 June 2024World environment day ppt For 5 June 2024
World environment day ppt For 5 June 2024
ak6969907
 
RPMS TEMPLATE FOR SCHOOL YEAR 2023-2024 FOR TEACHER 1 TO TEACHER 3
RPMS TEMPLATE FOR SCHOOL YEAR 2023-2024 FOR TEACHER 1 TO TEACHER 3RPMS TEMPLATE FOR SCHOOL YEAR 2023-2024 FOR TEACHER 1 TO TEACHER 3
RPMS TEMPLATE FOR SCHOOL YEAR 2023-2024 FOR TEACHER 1 TO TEACHER 3
IreneSebastianRueco1
 
Lapbook sobre os Regimes Totalitários.pdf
Lapbook sobre os Regimes Totalitários.pdfLapbook sobre os Regimes Totalitários.pdf
Lapbook sobre os Regimes Totalitários.pdf
Jean Carlos Nunes Paixão
 
clinical examination of hip joint (1).pdf
clinical examination of hip joint (1).pdfclinical examination of hip joint (1).pdf
clinical examination of hip joint (1).pdf
Priyankaranawat4
 
How to Manage Your Lost Opportunities in Odoo 17 CRM
How to Manage Your Lost Opportunities in Odoo 17 CRMHow to Manage Your Lost Opportunities in Odoo 17 CRM
How to Manage Your Lost Opportunities in Odoo 17 CRM
Celine George
 
How to Build a Module in Odoo 17 Using the Scaffold Method
How to Build a Module in Odoo 17 Using the Scaffold MethodHow to Build a Module in Odoo 17 Using the Scaffold Method
How to Build a Module in Odoo 17 Using the Scaffold Method
Celine George
 
A Survey of Techniques for Maximizing LLM Performance.pptx
A Survey of Techniques for Maximizing LLM Performance.pptxA Survey of Techniques for Maximizing LLM Performance.pptx
A Survey of Techniques for Maximizing LLM Performance.pptx
thanhdowork
 
The simplified electron and muon model, Oscillating Spacetime: The Foundation...
The simplified electron and muon model, Oscillating Spacetime: The Foundation...The simplified electron and muon model, Oscillating Spacetime: The Foundation...
The simplified electron and muon model, Oscillating Spacetime: The Foundation...
RitikBhardwaj56
 
Exploiting Artificial Intelligence for Empowering Researchers and Faculty, In...
Exploiting Artificial Intelligence for Empowering Researchers and Faculty, In...Exploiting Artificial Intelligence for Empowering Researchers and Faculty, In...
Exploiting Artificial Intelligence for Empowering Researchers and Faculty, In...
Dr. Vinod Kumar Kanvaria
 
The History of Stoke Newington Street Names
The History of Stoke Newington Street NamesThe History of Stoke Newington Street Names
The History of Stoke Newington Street Names
History of Stoke Newington
 
Types of Herbal Cosmetics its standardization.
Types of Herbal Cosmetics its standardization.Types of Herbal Cosmetics its standardization.
Types of Herbal Cosmetics its standardization.
Ashokrao Mane college of Pharmacy Peth-Vadgaon
 
Digital Artifact 1 - 10VCD Environments Unit
Digital Artifact 1 - 10VCD Environments UnitDigital Artifact 1 - 10VCD Environments Unit
Digital Artifact 1 - 10VCD Environments Unit
chanes7
 
Film vocab for eal 3 students: Australia the movie
Film vocab for eal 3 students: Australia the movieFilm vocab for eal 3 students: Australia the movie
Film vocab for eal 3 students: Australia the movie
Nicholas Montgomery
 
Your Skill Boost Masterclass: Strategies for Effective Upskilling
Your Skill Boost Masterclass: Strategies for Effective UpskillingYour Skill Boost Masterclass: Strategies for Effective Upskilling
Your Skill Boost Masterclass: Strategies for Effective Upskilling
Excellence Foundation for South Sudan
 
BÀI TẬP BỔ TRỢ TIẾNG ANH 8 CẢ NĂM - GLOBAL SUCCESS - NĂM HỌC 2023-2024 (CÓ FI...
BÀI TẬP BỔ TRỢ TIẾNG ANH 8 CẢ NĂM - GLOBAL SUCCESS - NĂM HỌC 2023-2024 (CÓ FI...BÀI TẬP BỔ TRỢ TIẾNG ANH 8 CẢ NĂM - GLOBAL SUCCESS - NĂM HỌC 2023-2024 (CÓ FI...
BÀI TẬP BỔ TRỢ TIẾNG ANH 8 CẢ NĂM - GLOBAL SUCCESS - NĂM HỌC 2023-2024 (CÓ FI...
Nguyen Thanh Tu Collection
 
বাংলাদেশ অর্থনৈতিক সমীক্ষা (Economic Review) ২০২৪ UJS App.pdf
বাংলাদেশ অর্থনৈতিক সমীক্ষা (Economic Review) ২০২৪ UJS App.pdfবাংলাদেশ অর্থনৈতিক সমীক্ষা (Economic Review) ২০২৪ UJS App.pdf
বাংলাদেশ অর্থনৈতিক সমীক্ষা (Economic Review) ২০২৪ UJS App.pdf
eBook.com.bd (প্রয়োজনীয় বাংলা বই)
 
Pollock and Snow "DEIA in the Scholarly Landscape, Session One: Setting Expec...
Pollock and Snow "DEIA in the Scholarly Landscape, Session One: Setting Expec...Pollock and Snow "DEIA in the Scholarly Landscape, Session One: Setting Expec...
Pollock and Snow "DEIA in the Scholarly Landscape, Session One: Setting Expec...
National Information Standards Organization (NISO)
 
CACJapan - GROUP Presentation 1- Wk 4.pdf
CACJapan - GROUP Presentation 1- Wk 4.pdfCACJapan - GROUP Presentation 1- Wk 4.pdf
CACJapan - GROUP Presentation 1- Wk 4.pdf
camakaiclarkmusic
 

Recently uploaded (20)

Pride Month Slides 2024 David Douglas School District
Pride Month Slides 2024 David Douglas School DistrictPride Month Slides 2024 David Douglas School District
Pride Month Slides 2024 David Douglas School District
 
C1 Rubenstein AP HuG xxxxxxxxxxxxxx.pptx
C1 Rubenstein AP HuG xxxxxxxxxxxxxx.pptxC1 Rubenstein AP HuG xxxxxxxxxxxxxx.pptx
C1 Rubenstein AP HuG xxxxxxxxxxxxxx.pptx
 
World environment day ppt For 5 June 2024
World environment day ppt For 5 June 2024World environment day ppt For 5 June 2024
World environment day ppt For 5 June 2024
 
RPMS TEMPLATE FOR SCHOOL YEAR 2023-2024 FOR TEACHER 1 TO TEACHER 3
RPMS TEMPLATE FOR SCHOOL YEAR 2023-2024 FOR TEACHER 1 TO TEACHER 3RPMS TEMPLATE FOR SCHOOL YEAR 2023-2024 FOR TEACHER 1 TO TEACHER 3
RPMS TEMPLATE FOR SCHOOL YEAR 2023-2024 FOR TEACHER 1 TO TEACHER 3
 
Lapbook sobre os Regimes Totalitários.pdf
Lapbook sobre os Regimes Totalitários.pdfLapbook sobre os Regimes Totalitários.pdf
Lapbook sobre os Regimes Totalitários.pdf
 
clinical examination of hip joint (1).pdf
clinical examination of hip joint (1).pdfclinical examination of hip joint (1).pdf
clinical examination of hip joint (1).pdf
 
How to Manage Your Lost Opportunities in Odoo 17 CRM
How to Manage Your Lost Opportunities in Odoo 17 CRMHow to Manage Your Lost Opportunities in Odoo 17 CRM
How to Manage Your Lost Opportunities in Odoo 17 CRM
 
How to Build a Module in Odoo 17 Using the Scaffold Method
How to Build a Module in Odoo 17 Using the Scaffold MethodHow to Build a Module in Odoo 17 Using the Scaffold Method
How to Build a Module in Odoo 17 Using the Scaffold Method
 
A Survey of Techniques for Maximizing LLM Performance.pptx
A Survey of Techniques for Maximizing LLM Performance.pptxA Survey of Techniques for Maximizing LLM Performance.pptx
A Survey of Techniques for Maximizing LLM Performance.pptx
 
The simplified electron and muon model, Oscillating Spacetime: The Foundation...
The simplified electron and muon model, Oscillating Spacetime: The Foundation...The simplified electron and muon model, Oscillating Spacetime: The Foundation...
The simplified electron and muon model, Oscillating Spacetime: The Foundation...
 
Exploiting Artificial Intelligence for Empowering Researchers and Faculty, In...
Exploiting Artificial Intelligence for Empowering Researchers and Faculty, In...Exploiting Artificial Intelligence for Empowering Researchers and Faculty, In...
Exploiting Artificial Intelligence for Empowering Researchers and Faculty, In...
 
The History of Stoke Newington Street Names
The History of Stoke Newington Street NamesThe History of Stoke Newington Street Names
The History of Stoke Newington Street Names
 
Types of Herbal Cosmetics its standardization.
Types of Herbal Cosmetics its standardization.Types of Herbal Cosmetics its standardization.
Types of Herbal Cosmetics its standardization.
 
Digital Artifact 1 - 10VCD Environments Unit
Digital Artifact 1 - 10VCD Environments UnitDigital Artifact 1 - 10VCD Environments Unit
Digital Artifact 1 - 10VCD Environments Unit
 
Film vocab for eal 3 students: Australia the movie
Film vocab for eal 3 students: Australia the movieFilm vocab for eal 3 students: Australia the movie
Film vocab for eal 3 students: Australia the movie
 
Your Skill Boost Masterclass: Strategies for Effective Upskilling
Your Skill Boost Masterclass: Strategies for Effective UpskillingYour Skill Boost Masterclass: Strategies for Effective Upskilling
Your Skill Boost Masterclass: Strategies for Effective Upskilling
 
BÀI TẬP BỔ TRỢ TIẾNG ANH 8 CẢ NĂM - GLOBAL SUCCESS - NĂM HỌC 2023-2024 (CÓ FI...
BÀI TẬP BỔ TRỢ TIẾNG ANH 8 CẢ NĂM - GLOBAL SUCCESS - NĂM HỌC 2023-2024 (CÓ FI...BÀI TẬP BỔ TRỢ TIẾNG ANH 8 CẢ NĂM - GLOBAL SUCCESS - NĂM HỌC 2023-2024 (CÓ FI...
BÀI TẬP BỔ TRỢ TIẾNG ANH 8 CẢ NĂM - GLOBAL SUCCESS - NĂM HỌC 2023-2024 (CÓ FI...
 
বাংলাদেশ অর্থনৈতিক সমীক্ষা (Economic Review) ২০২৪ UJS App.pdf
বাংলাদেশ অর্থনৈতিক সমীক্ষা (Economic Review) ২০২৪ UJS App.pdfবাংলাদেশ অর্থনৈতিক সমীক্ষা (Economic Review) ২০২৪ UJS App.pdf
বাংলাদেশ অর্থনৈতিক সমীক্ষা (Economic Review) ২০২৪ UJS App.pdf
 
Pollock and Snow "DEIA in the Scholarly Landscape, Session One: Setting Expec...
Pollock and Snow "DEIA in the Scholarly Landscape, Session One: Setting Expec...Pollock and Snow "DEIA in the Scholarly Landscape, Session One: Setting Expec...
Pollock and Snow "DEIA in the Scholarly Landscape, Session One: Setting Expec...
 
CACJapan - GROUP Presentation 1- Wk 4.pdf
CACJapan - GROUP Presentation 1- Wk 4.pdfCACJapan - GROUP Presentation 1- Wk 4.pdf
CACJapan - GROUP Presentation 1- Wk 4.pdf
 

Statistics

  • 1. Name: EMMANUEL P. RONQUILLO ADVANCE STATISTICS SUMMER CLASS 2022 Assignment Answer the following questions comprehensively. 1. Discuss the definition of statistics considering the two fields and cite an example of each statistics. How this field of statistics contributed to the administrators and teachers to improve the quality of education? (25pts). Statistics is the science of conducting studies to collect, organize, summarize, analyze, and draw conclusions from data. Since it is a science of conducting studies we need to follow the systematic approach .There are two types of statistical methods are used in analyzing data. Descriptive statistic and inferential statistics. Descriptive statistics mostly focus on the central tendency, variability and distribution of sample data. Central tendency means the estimate of characteristics, a typical elements of a sample or populations and includes descriptive statistics such as Mean, Median and Mode. It is used to say something or describe a set of information collected .It can also be represented with graphs. Common tools are Central tendency and Measure of variability. Example; In a math test, 32 out of 40 students were able to receive a passing mark. The average Score of the class is 82 out of 100 percent. Inferential statistics are tools that statisticians used to draw conclusions about the characteristics of a populations drawn from the characteristics of a sample and to decide how certain they can be of the reliability of those conclusions. Its is used to say something about a larger group (Population) using information collected from a small part of that population ( Sample). Common tools are: Hypothesis testing and Regression Analysis. Example: In a sample survey conducted, 65% of Filipino Generation Z prefer to drink milk tea than coffee while only 34% of Filipino Millennial prefer to drink milk tea than coffee. Statistics contributed to the administrators and teachers to improve the quality of education through:  Allow educators and administrators to understand the students’ performance using descriptive statistics.  allow to spot trends in the students’ performance using data visualizations and  allow administrators and teachers to compares different teaching using hypothesis tests.
  • 2. 2. In research output may be presented in three main forms. Discuss comprehensively the methods of data presentation by supporting example. (25 pts). Methods of data presentation data may be represented by textual form, tabular form and graphical form. Textual form used in presenting data in paragraph or narrative form. It is simple and appropriate only when there are few numbers to be presented. Example: In the statistics class of 40 students, 3 obtained the perfect score of 50. 16 students got a score of 40 and above, while onlyb3 got 19 and below.Generally the students performed well in the test with 23 or 70% getting a passing score of 38 and above. Tabular form is a systematic way of arranging data in columns and rows according to classifications or categories. Example: Age distribution of confirm COVID-199 cases in the Philippines March 11,2020 Age No. of confirm cases 19 years old and below 0 20-29 2 30-39 7 40-49 7 50-59 6 60-69 7 70 years and above 4 Total 33 Graphical form by means of graph. A graph or chart is a pictorial presentation of a set of data. It shows a general situation at a glance.Each graph or chart must have a figure number and a title. If data is based from another source, a source note should be included. Example; Age distribution of confirm COVID-199 cases in the Philippines March 11,2020
  • 3. 3. Discuss the two group of frequency distribution of data such as categorical or non- overlapping numerical intervals called class and non-numerical value called a qualitative frequency distribution by citing an example. (10pts). Categorical or non-overlapping numerical intervals called class is a variable that names categories whether with words or numerals. Example of Categorical 50-learners Question to 50 learners: Choose your favorite color. (red, purple, green, gold) Tally: red purple green gold total 5 5 25 15 50 Option Frequency Relative frequency /percent green 25 50% gold 15 30% red 5 10% purple 5 10% Qualitative frequency is a descriptive data based on observations or describe a certain type of information without using numbers. Example of Qualitative Frequency Sam collects data from each of his classmates about their favorite color. The data is listed below. Red, blue, blue, green, red, yellow, red, blue, blue, purple, yellow, green, green, blue, blue, green, purple, blue, blue, yellow, green, green, yellow, orange, purple Color Frequency red 3 orange 1 yellow 4 green 6 blue 8 purple 3 Total 25 4. Differentiate descriptive statistics from inferential statistics and support your answer by citing an example. (10pts). Descriptive statistics summarized the characteristics of data set while Inferential statistics allow you to test a hypothesis or assess whether your data is generalizable to the broader population. Example: Descriptive statistics; In a recent sample of dental patients, 83% who had a female dentist felt their dentist cared for their emotional well being during their procedure, and 61% of dental patients who had made a male dentist felt their dentist cared for their emotional well being during procedure. Inferential Statistics; A female dentist is more likely to care for your emotional well being during procedure than male dentist.