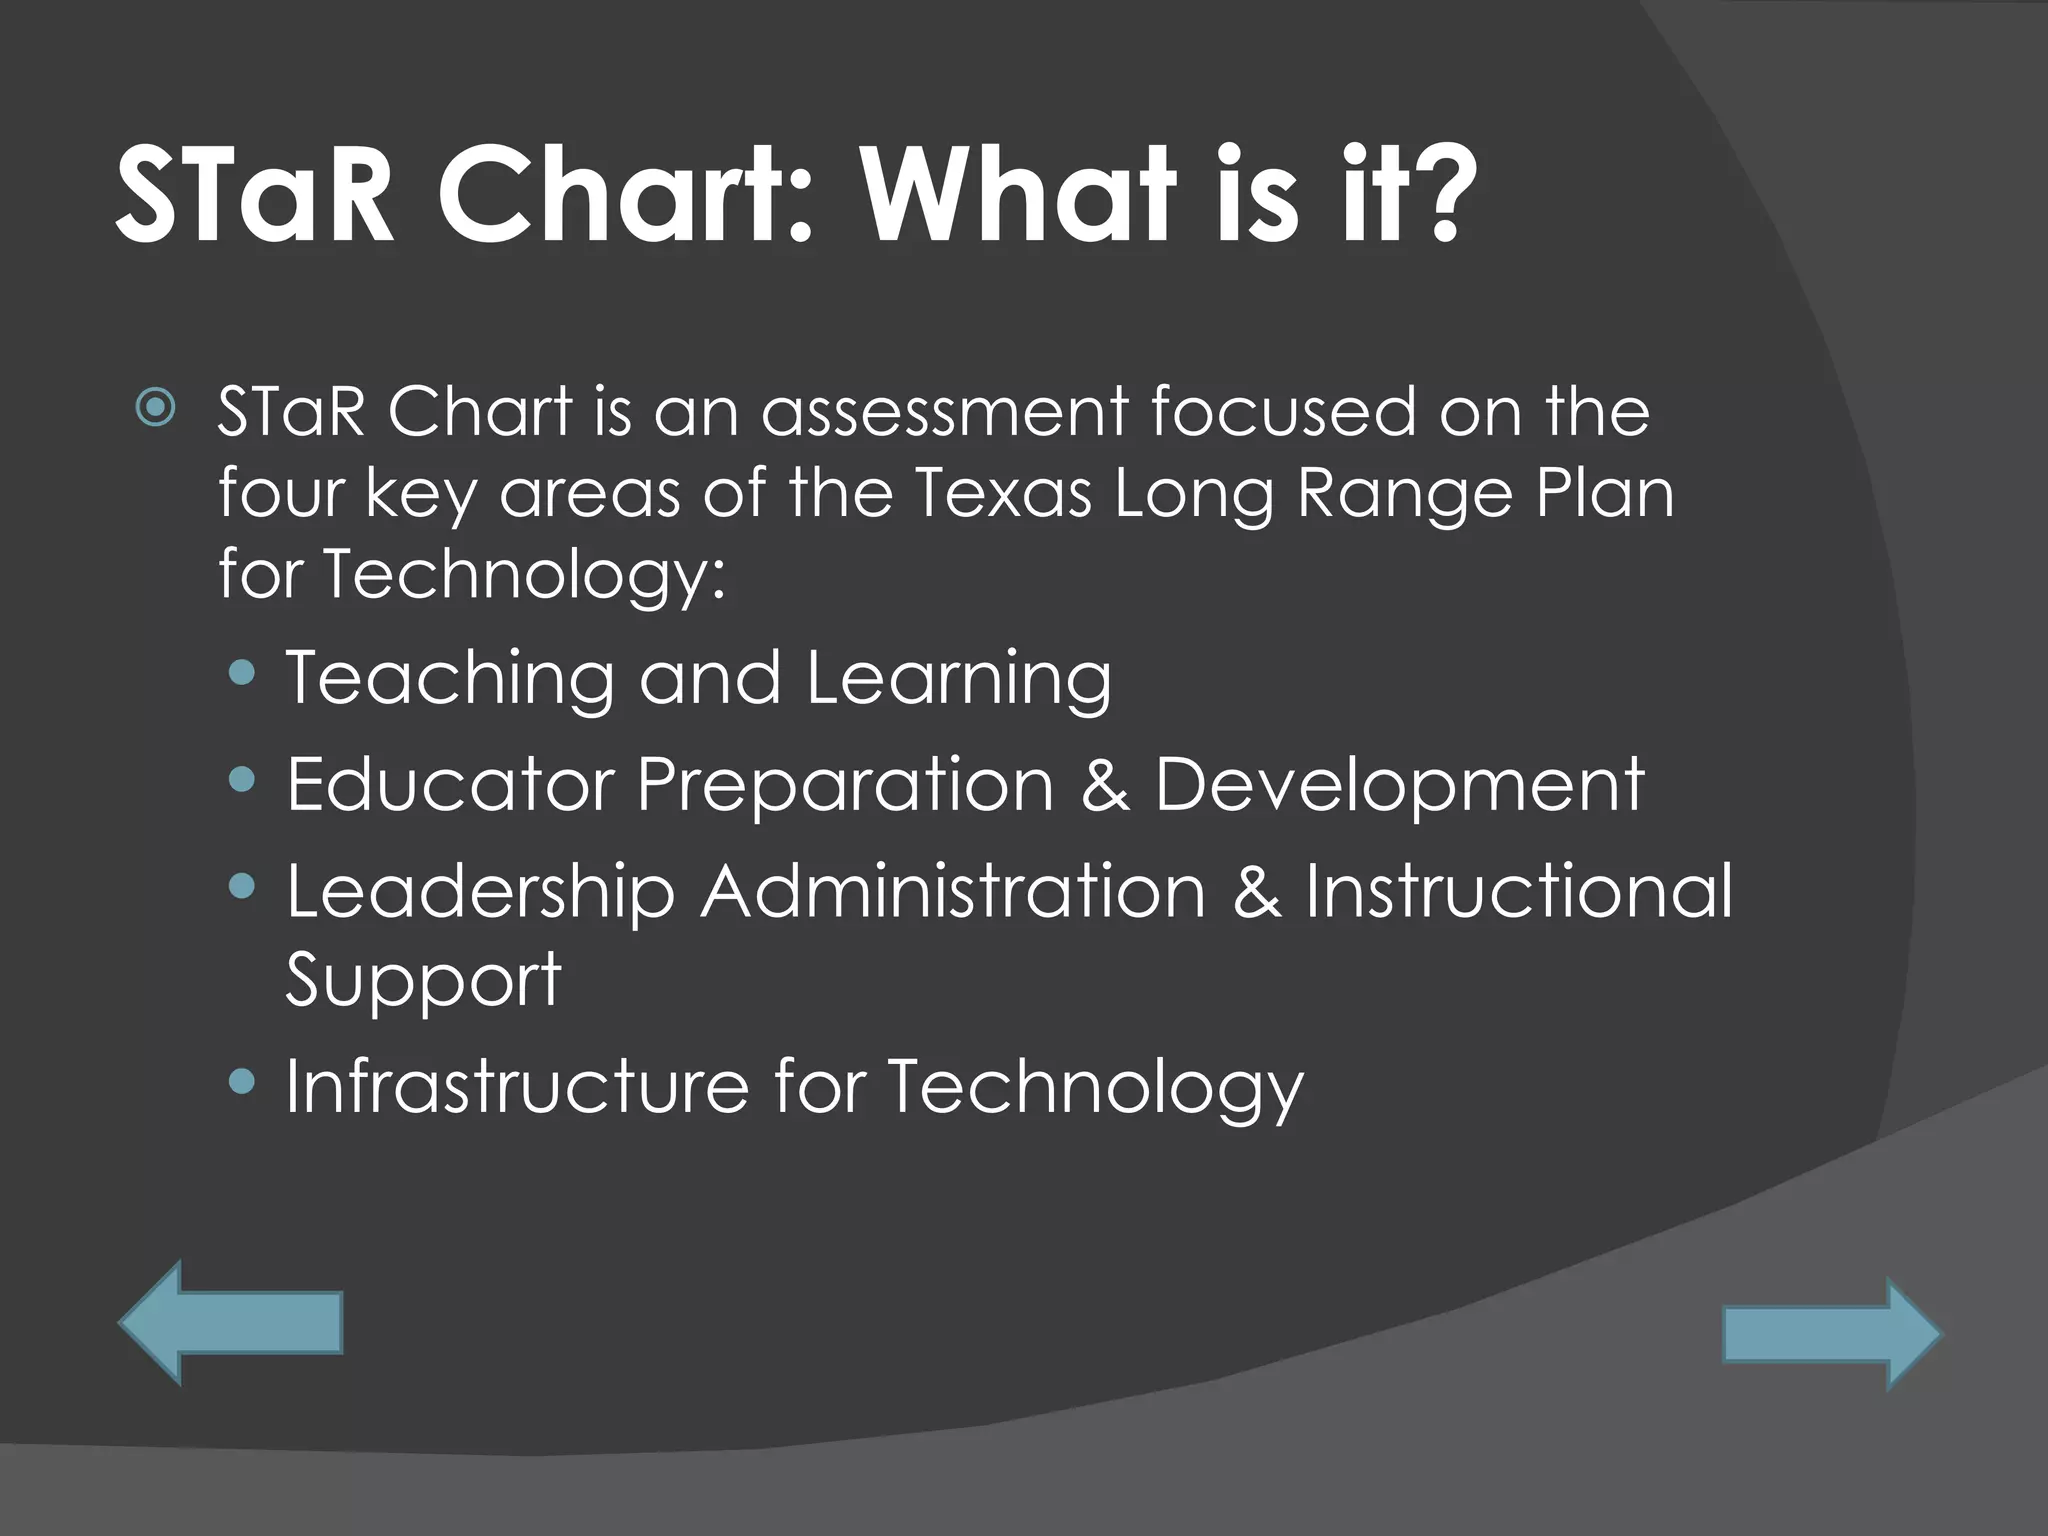
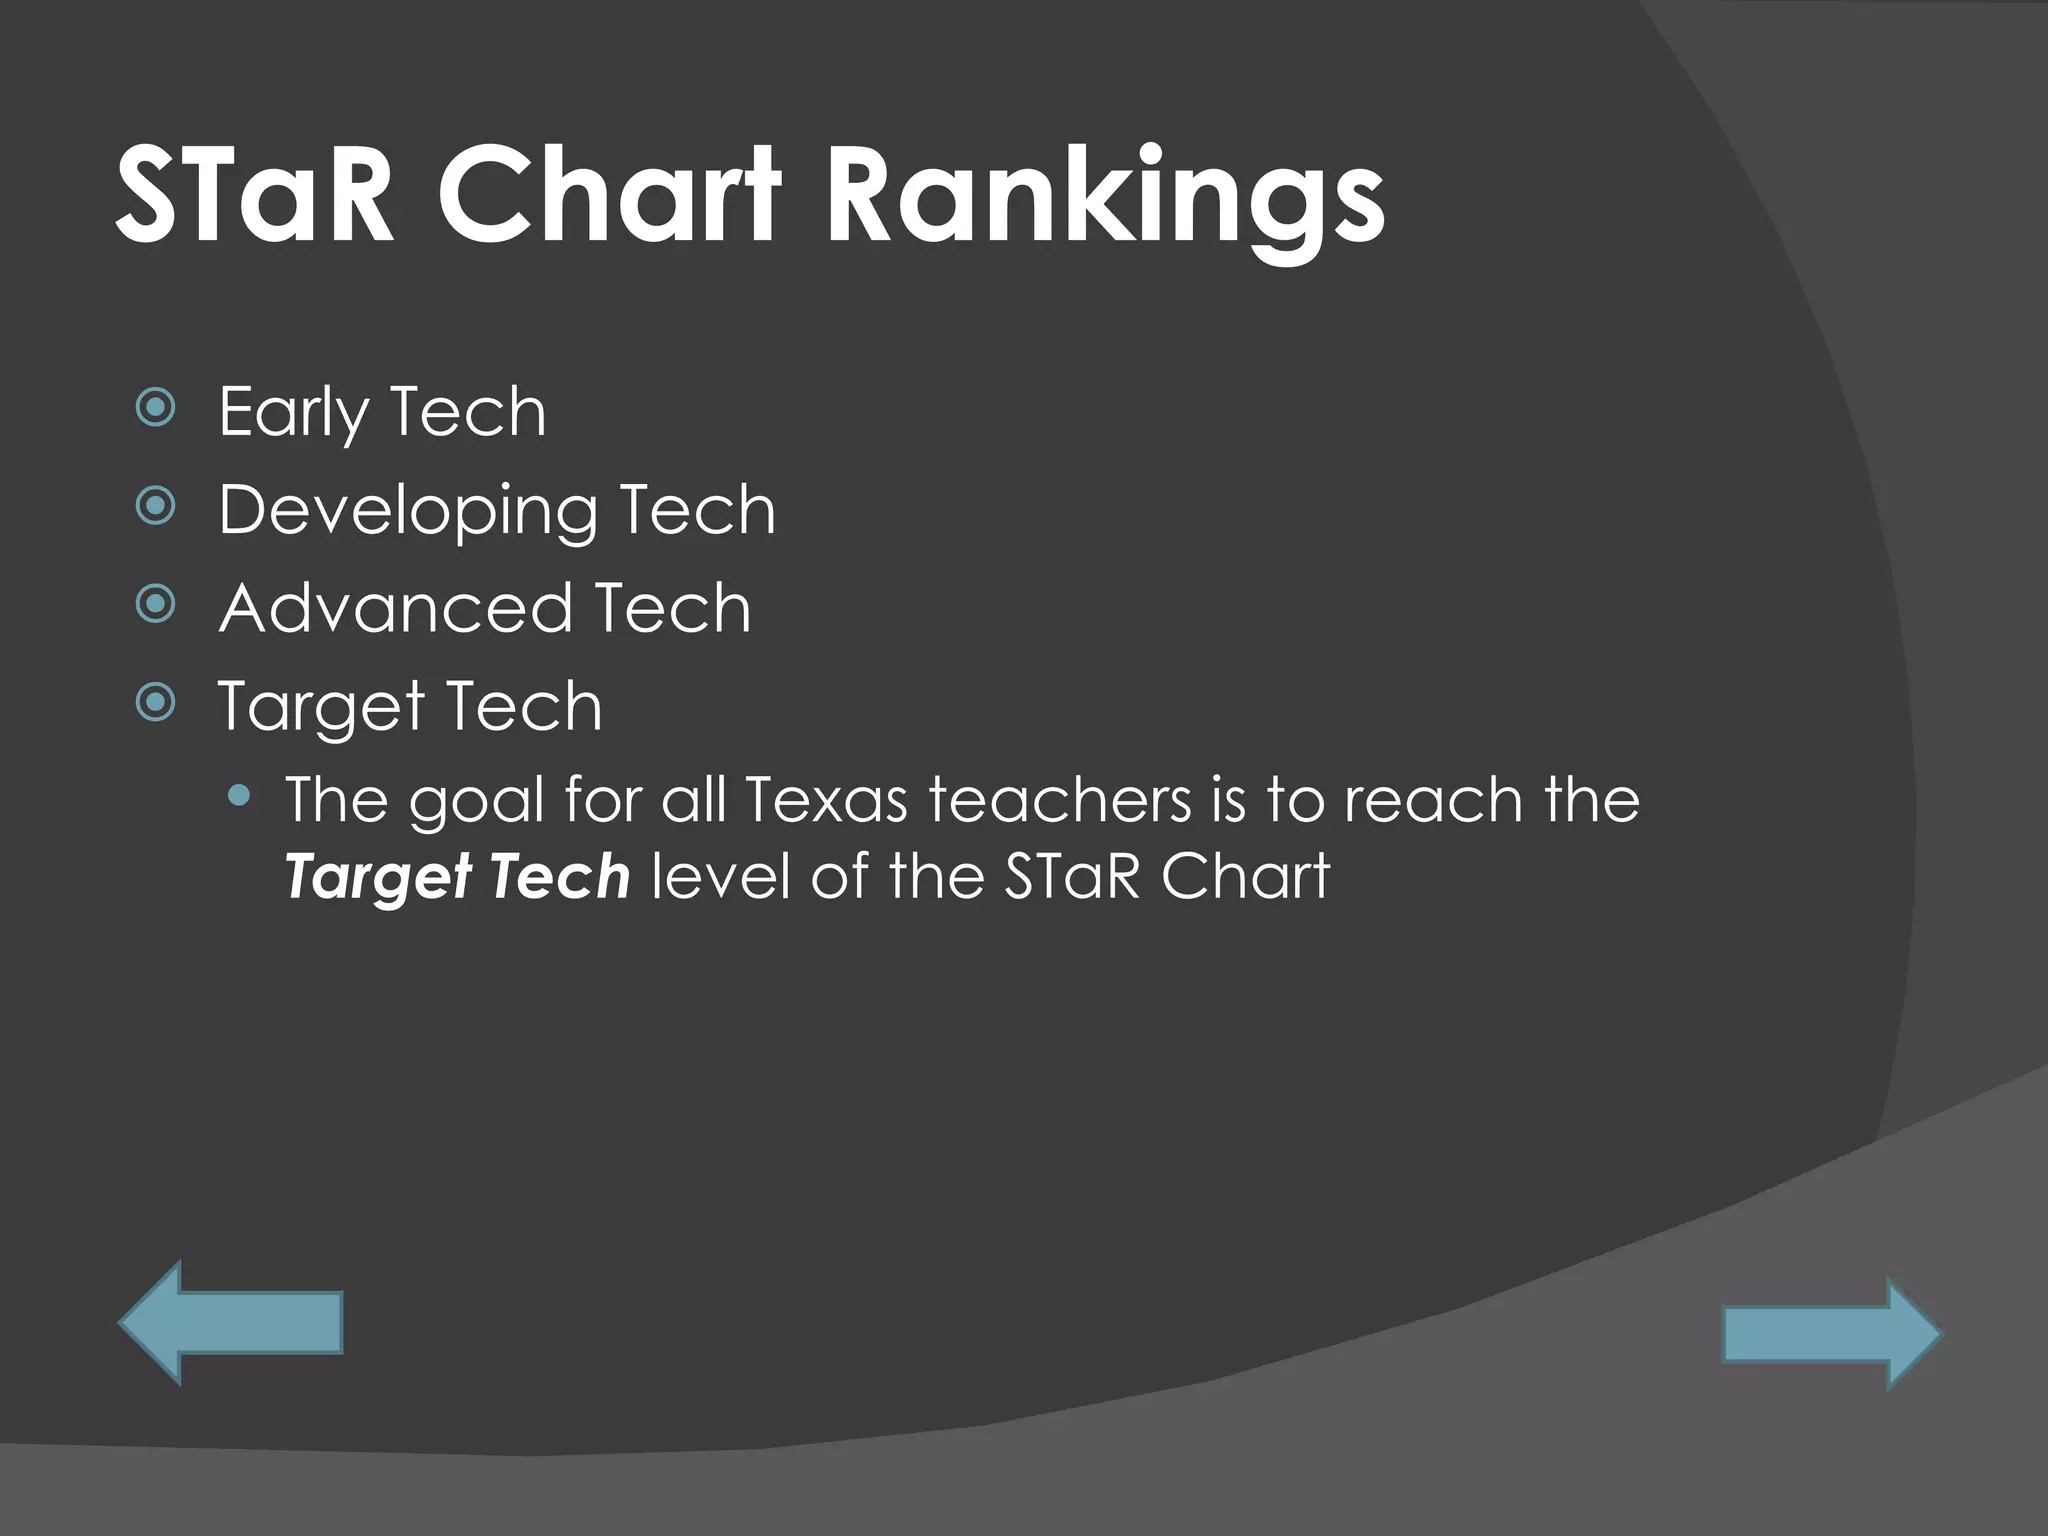
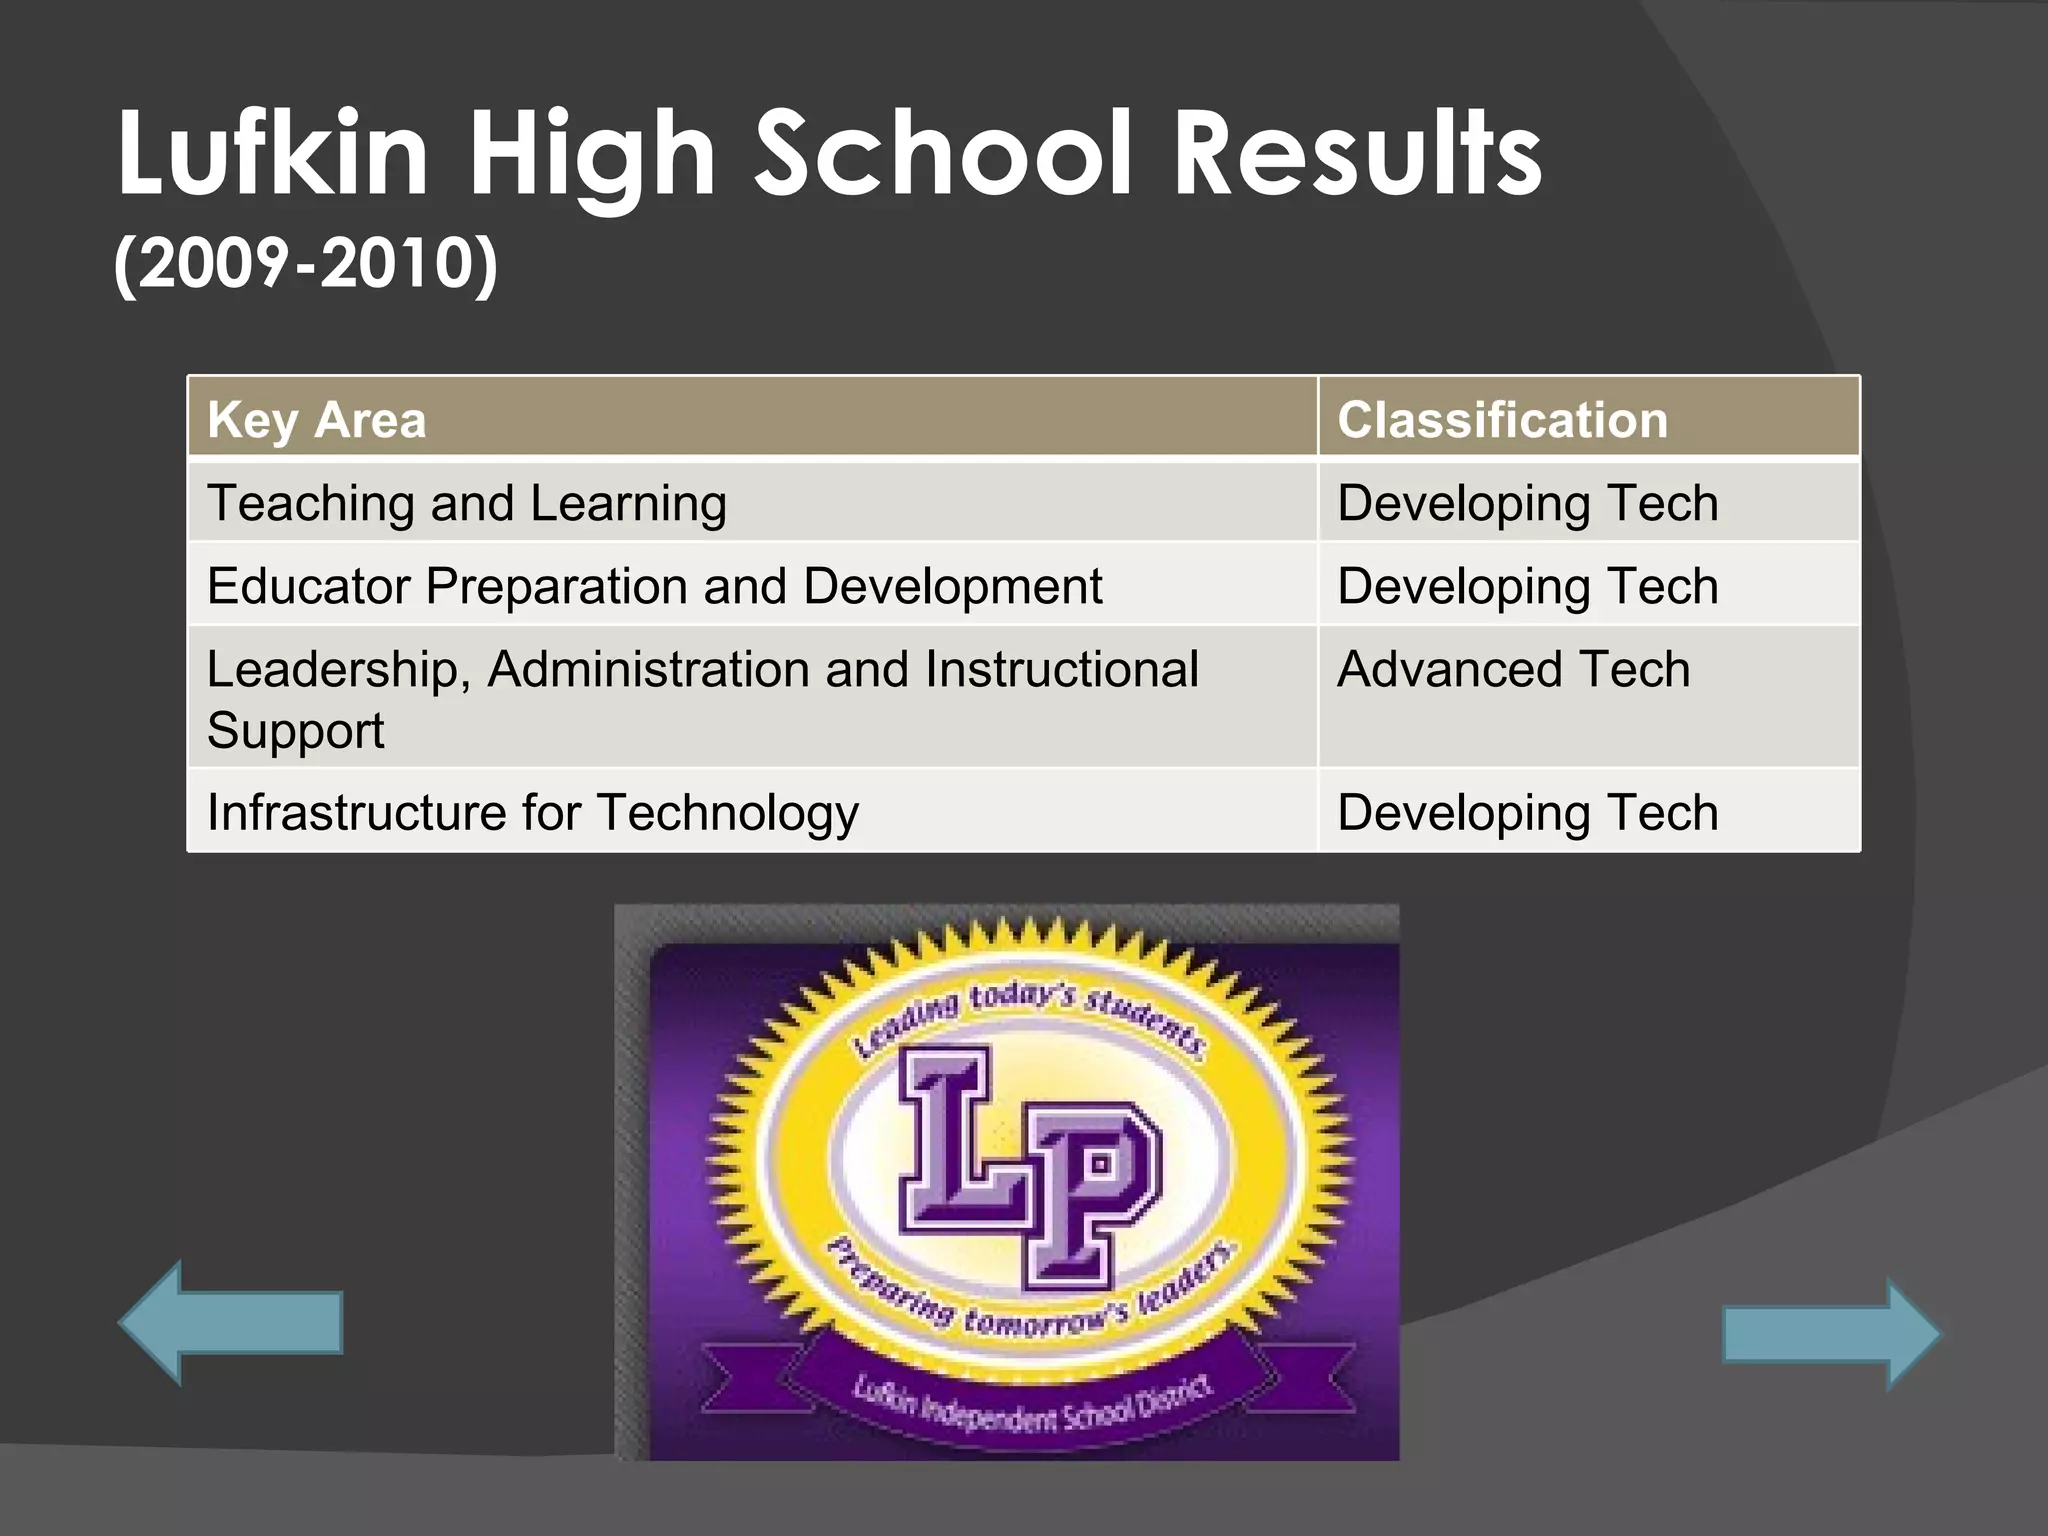
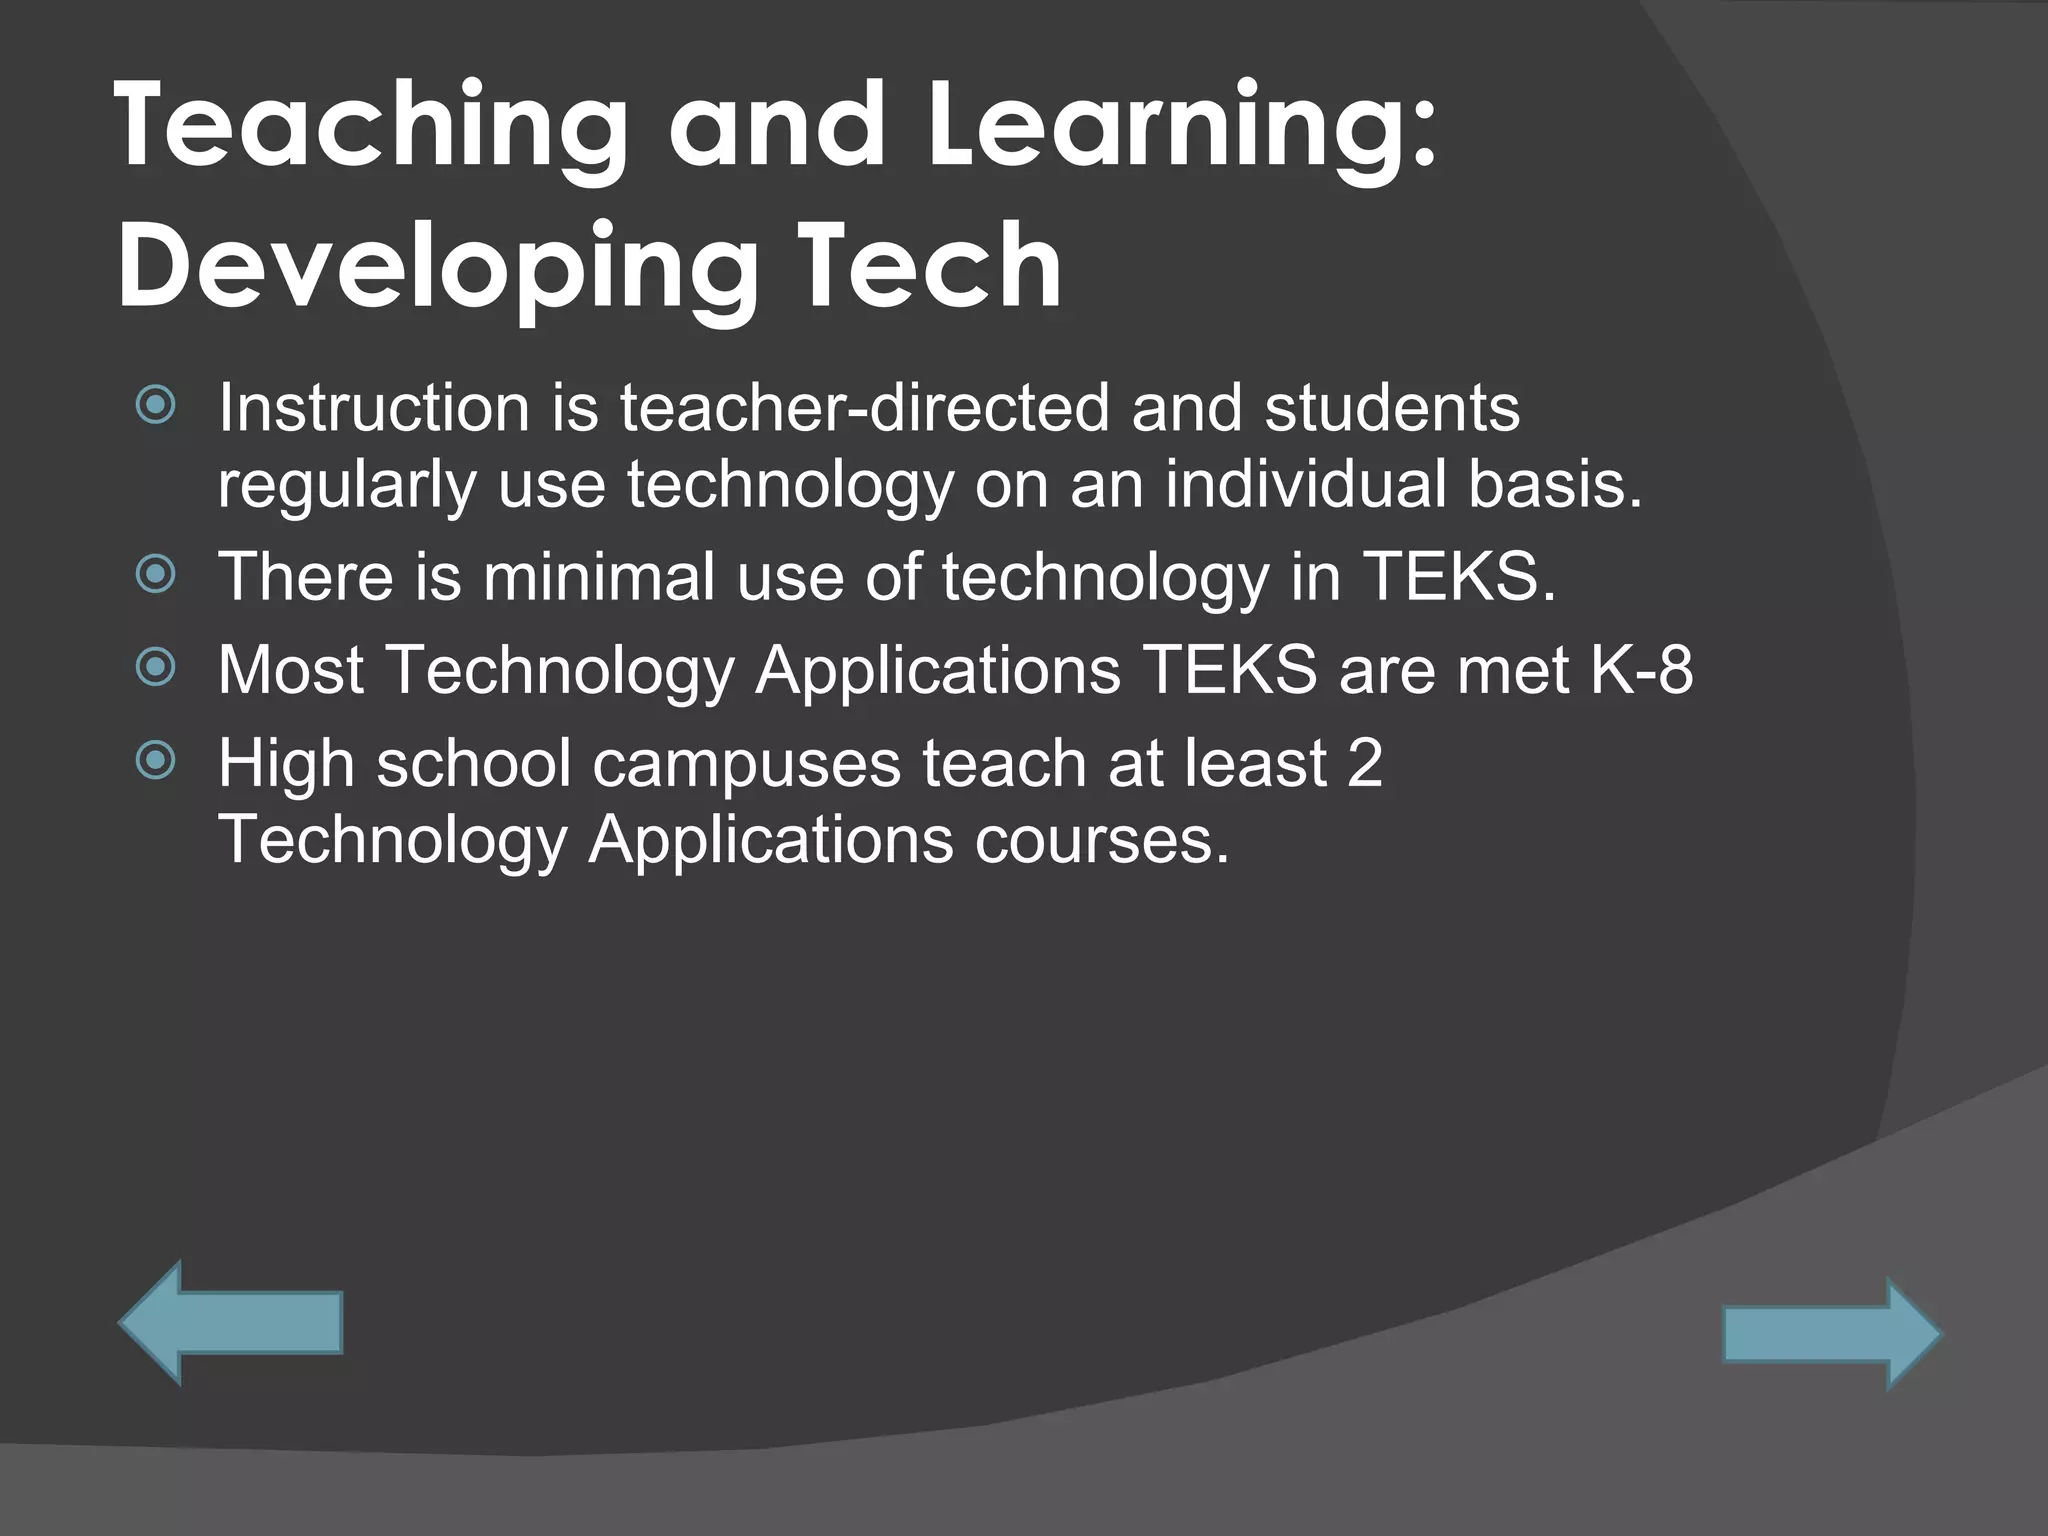
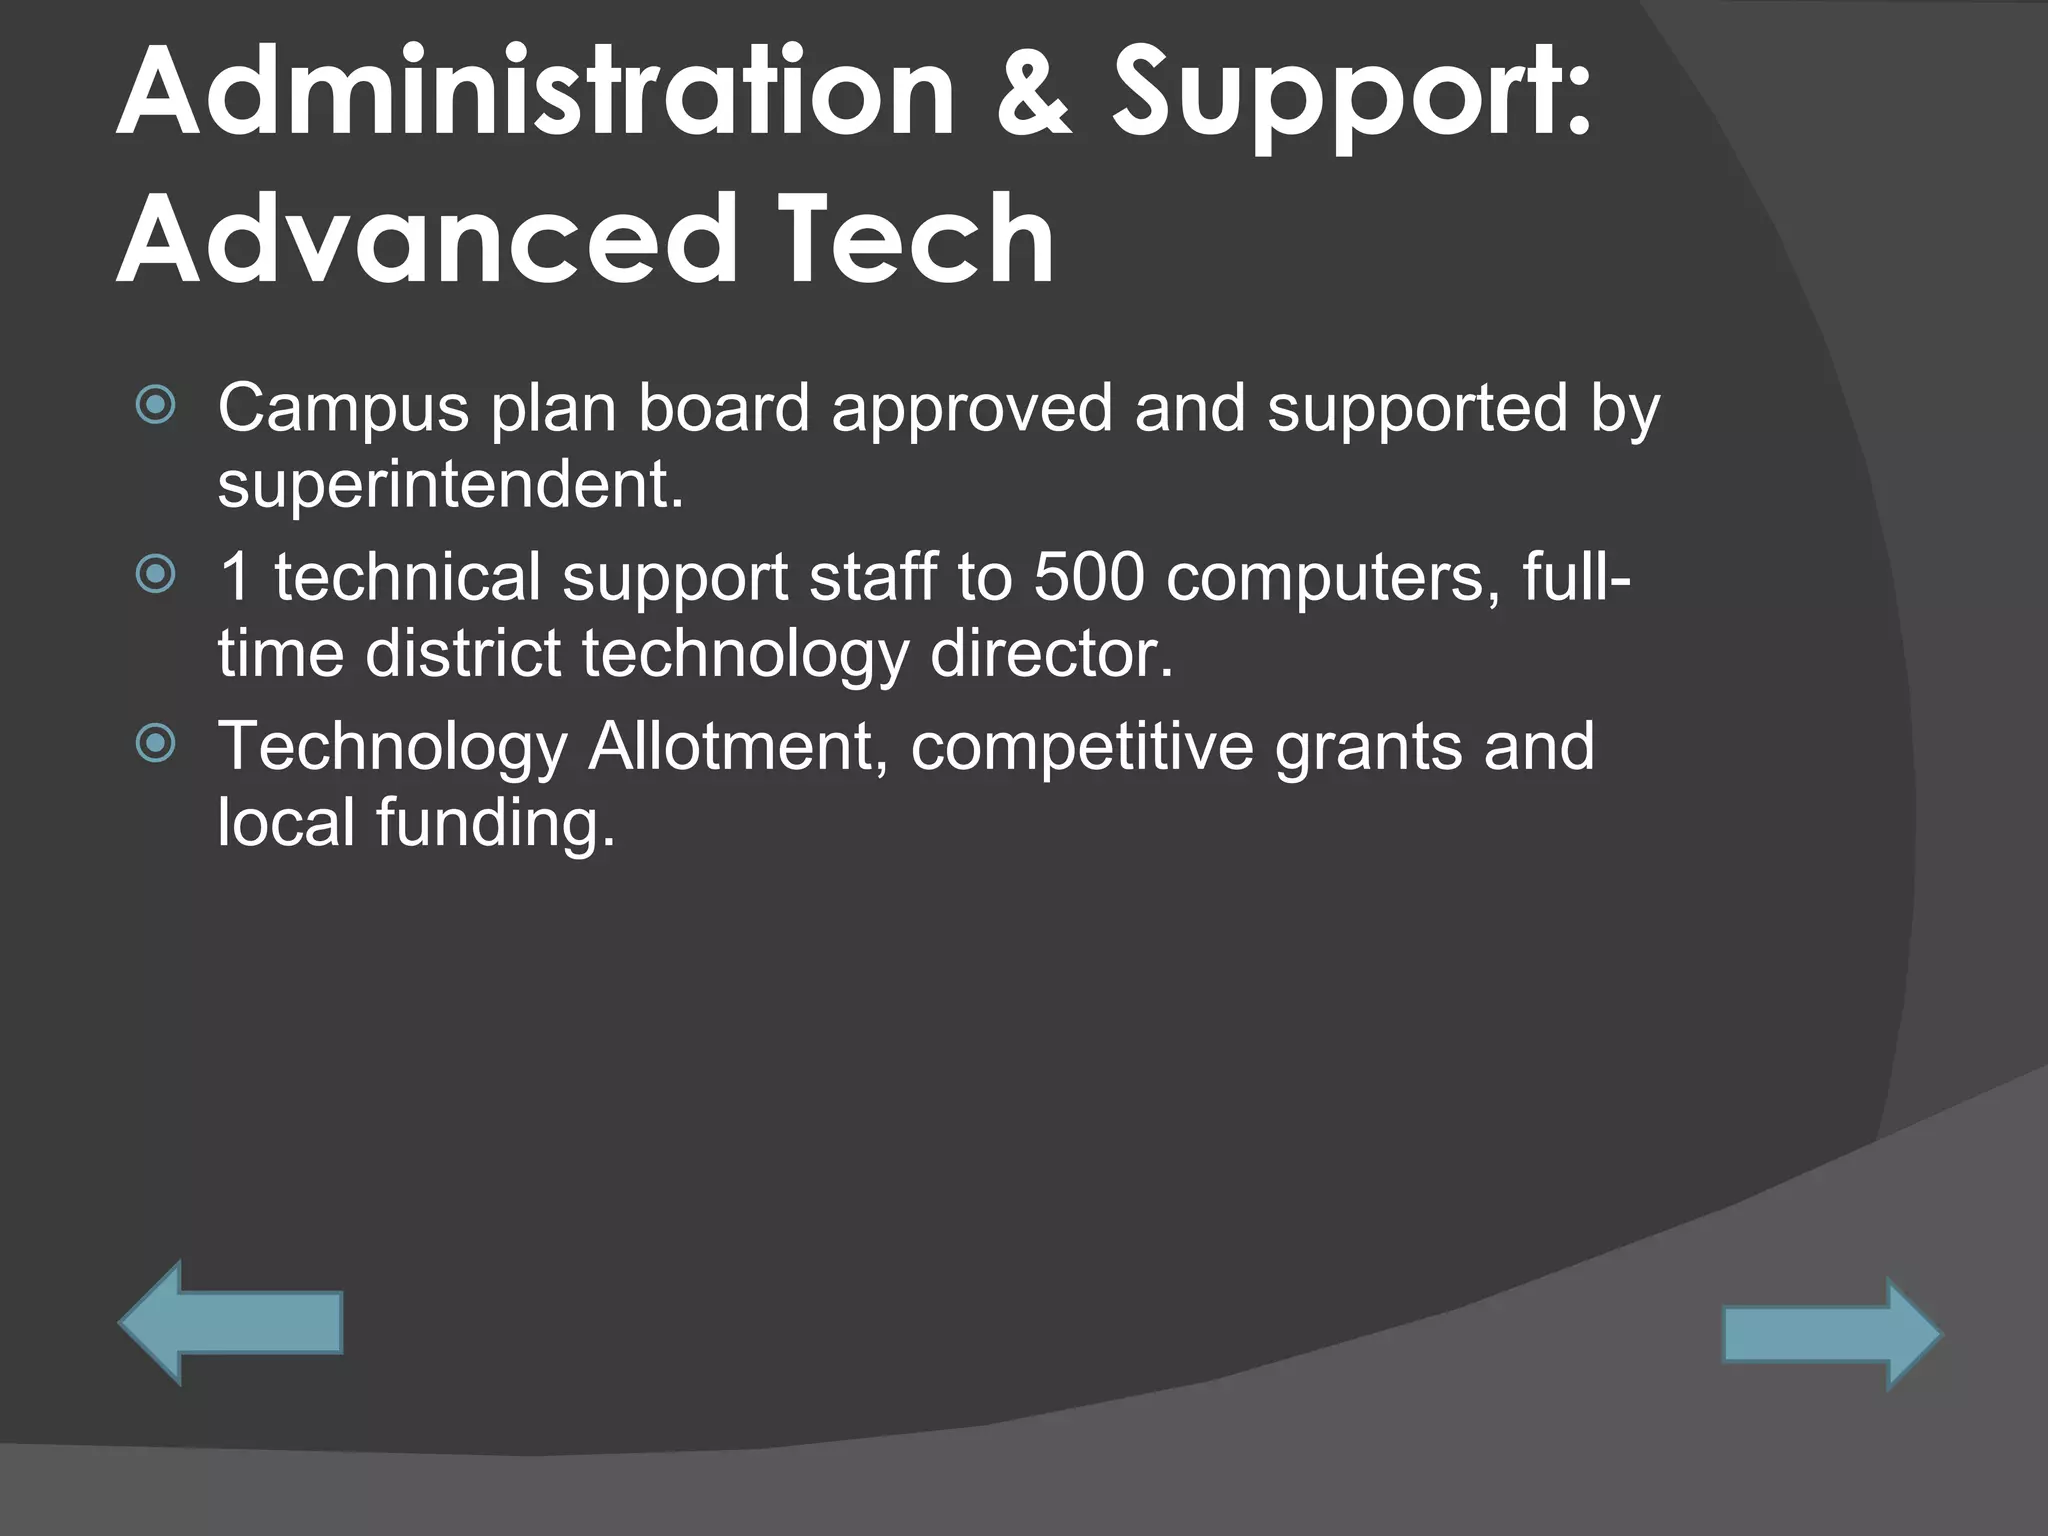
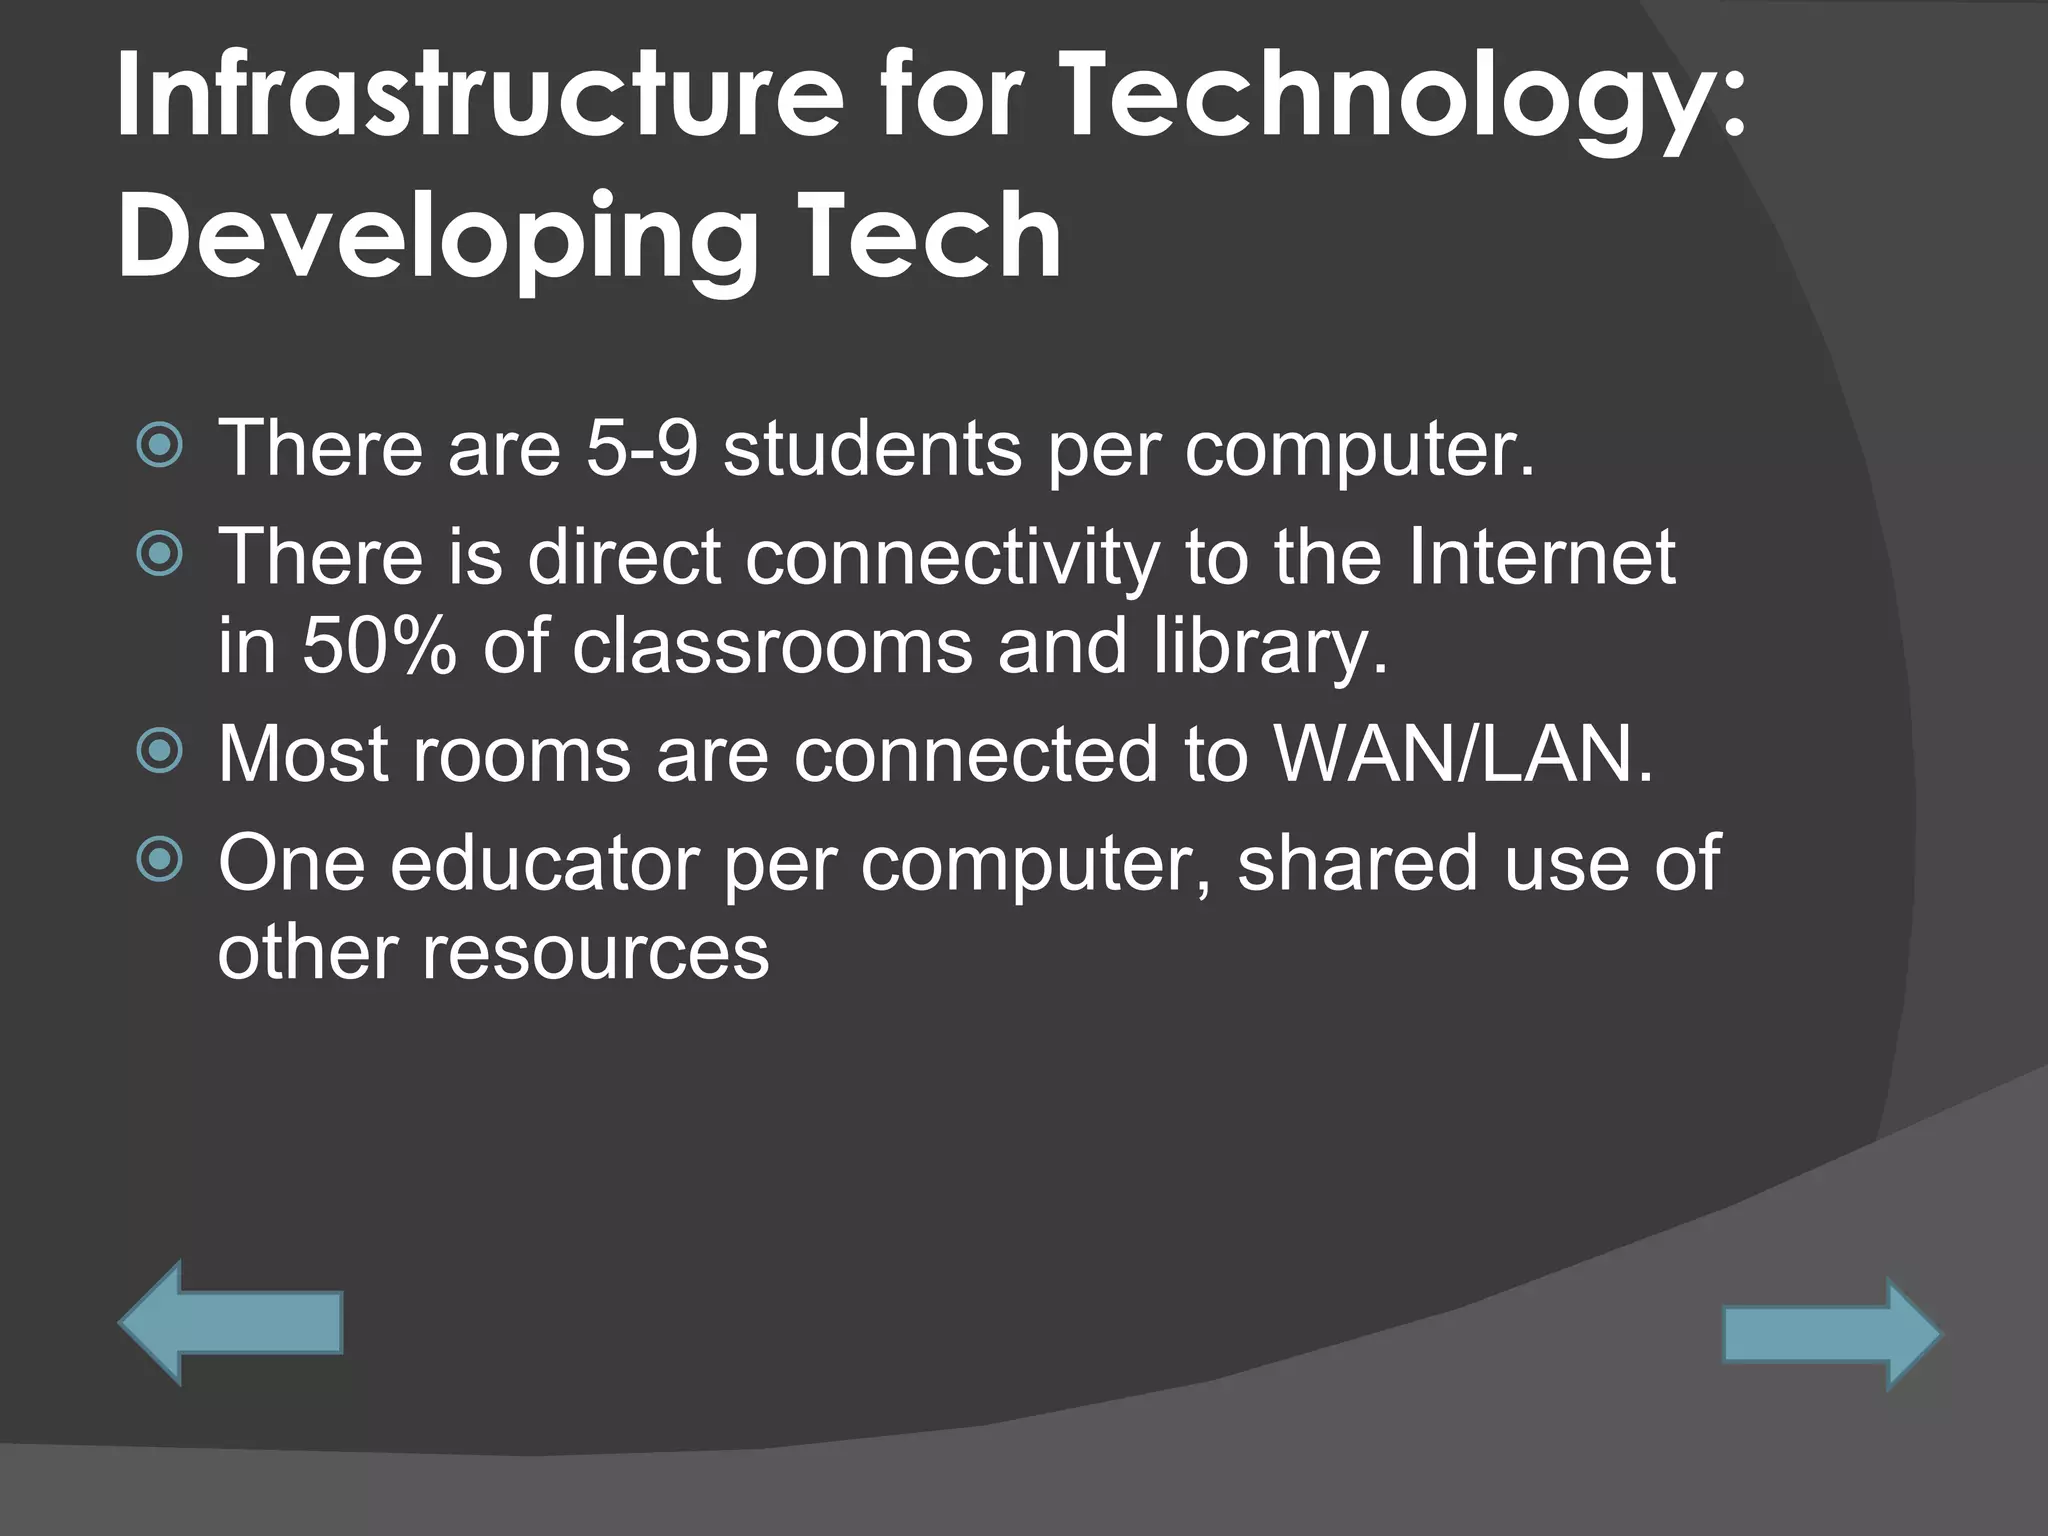
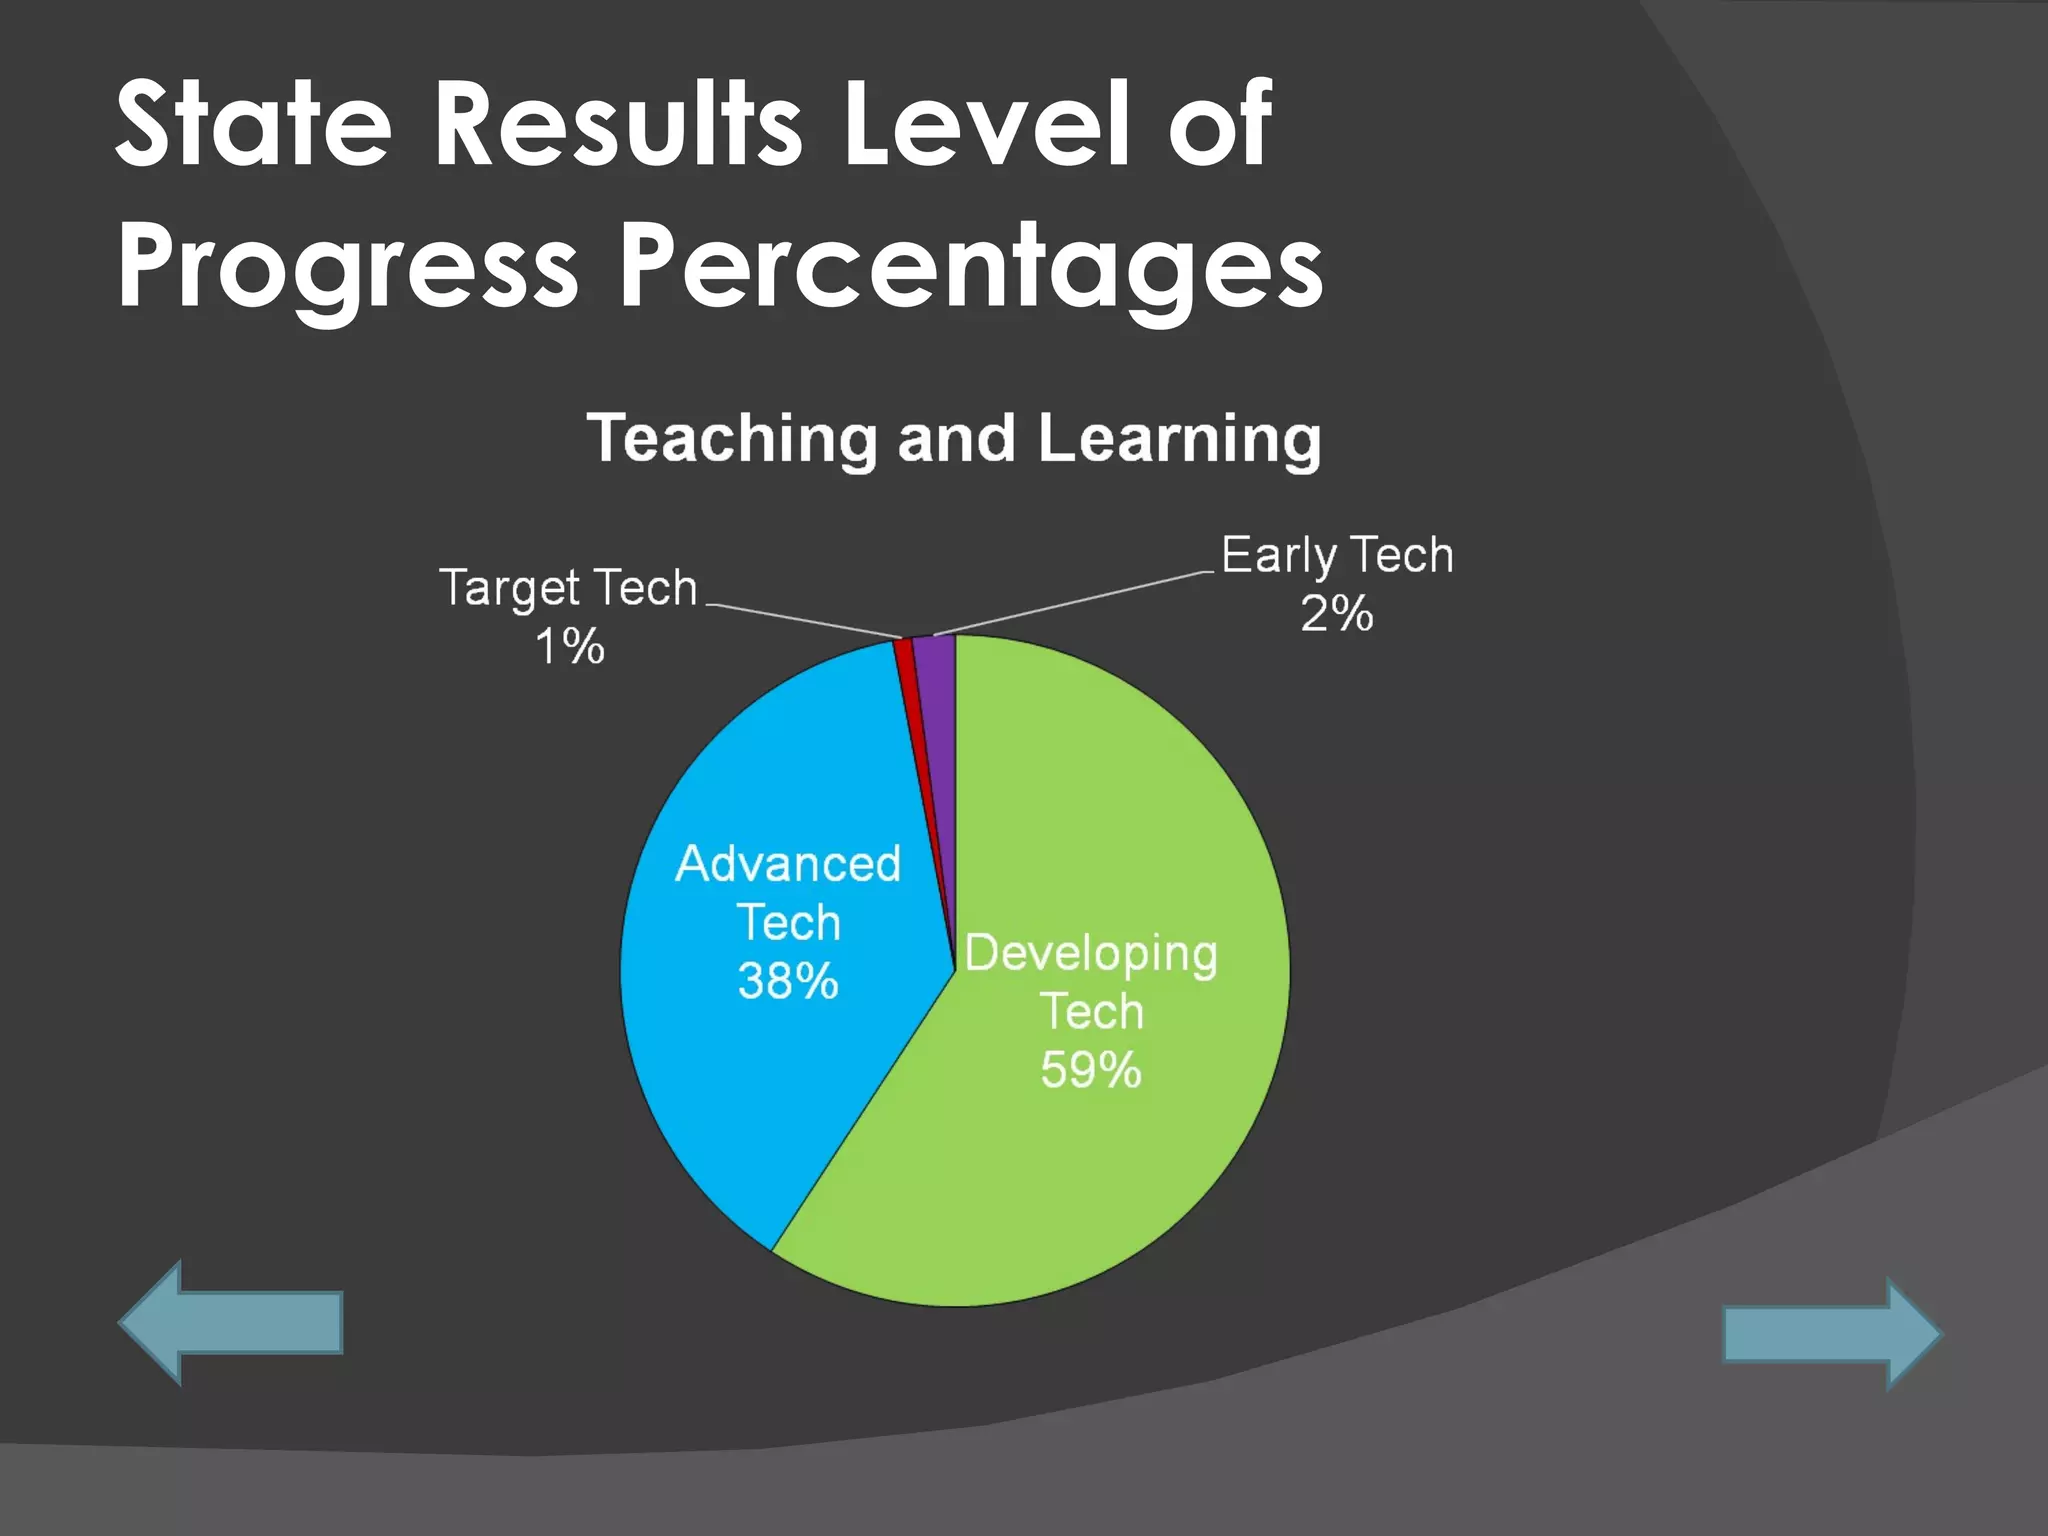
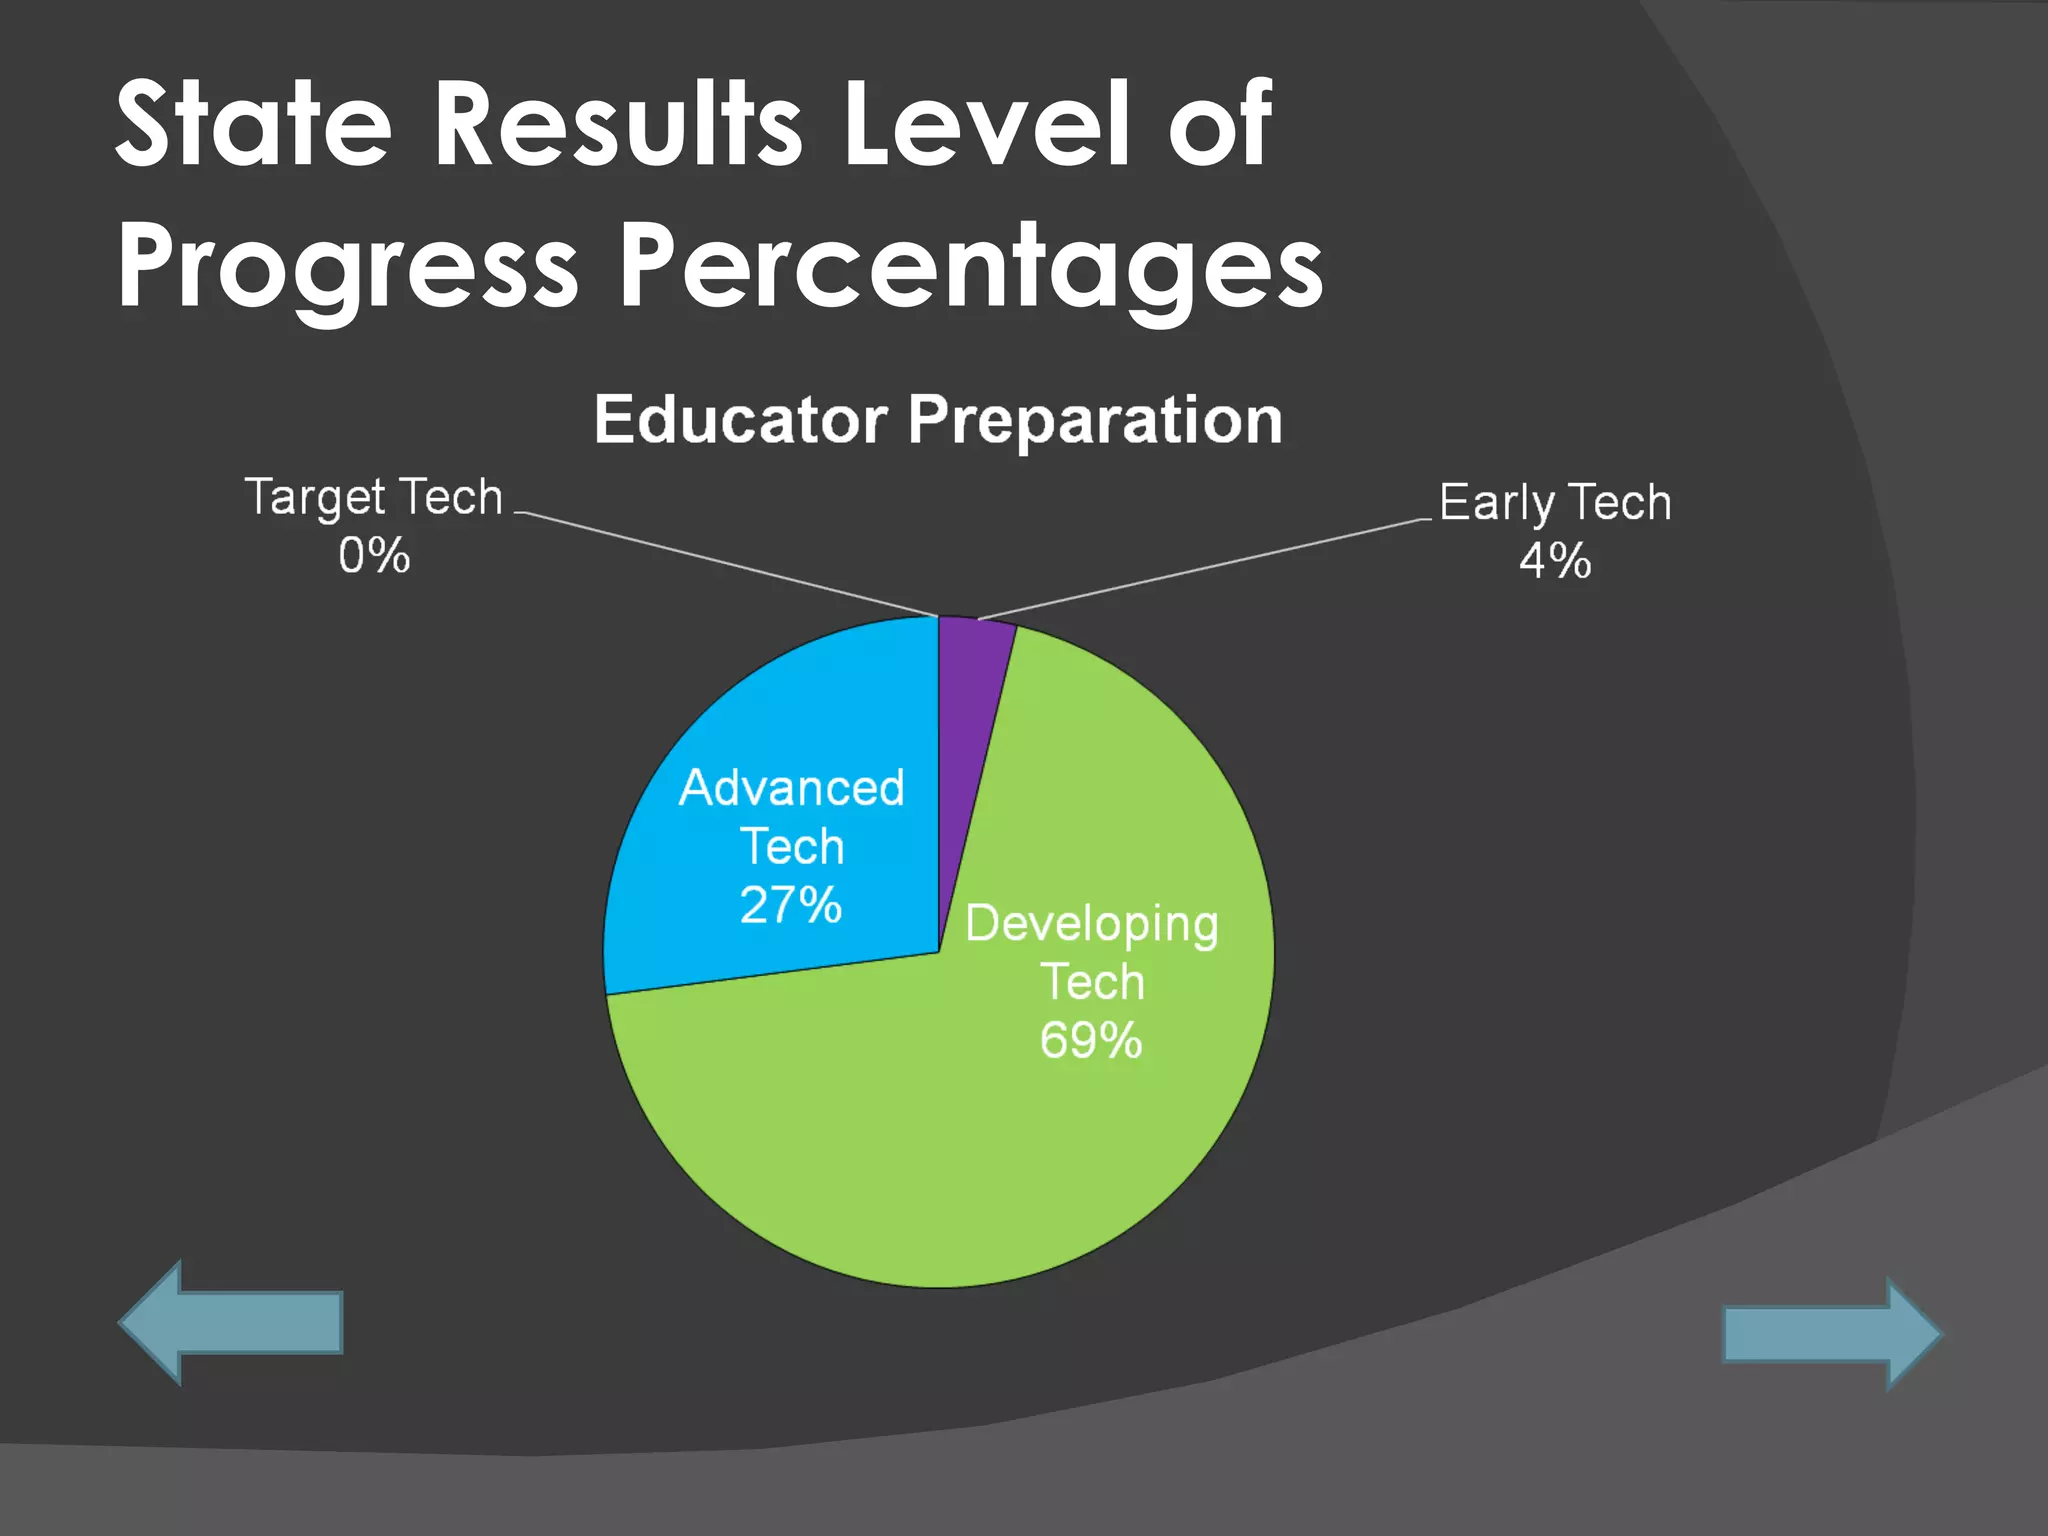
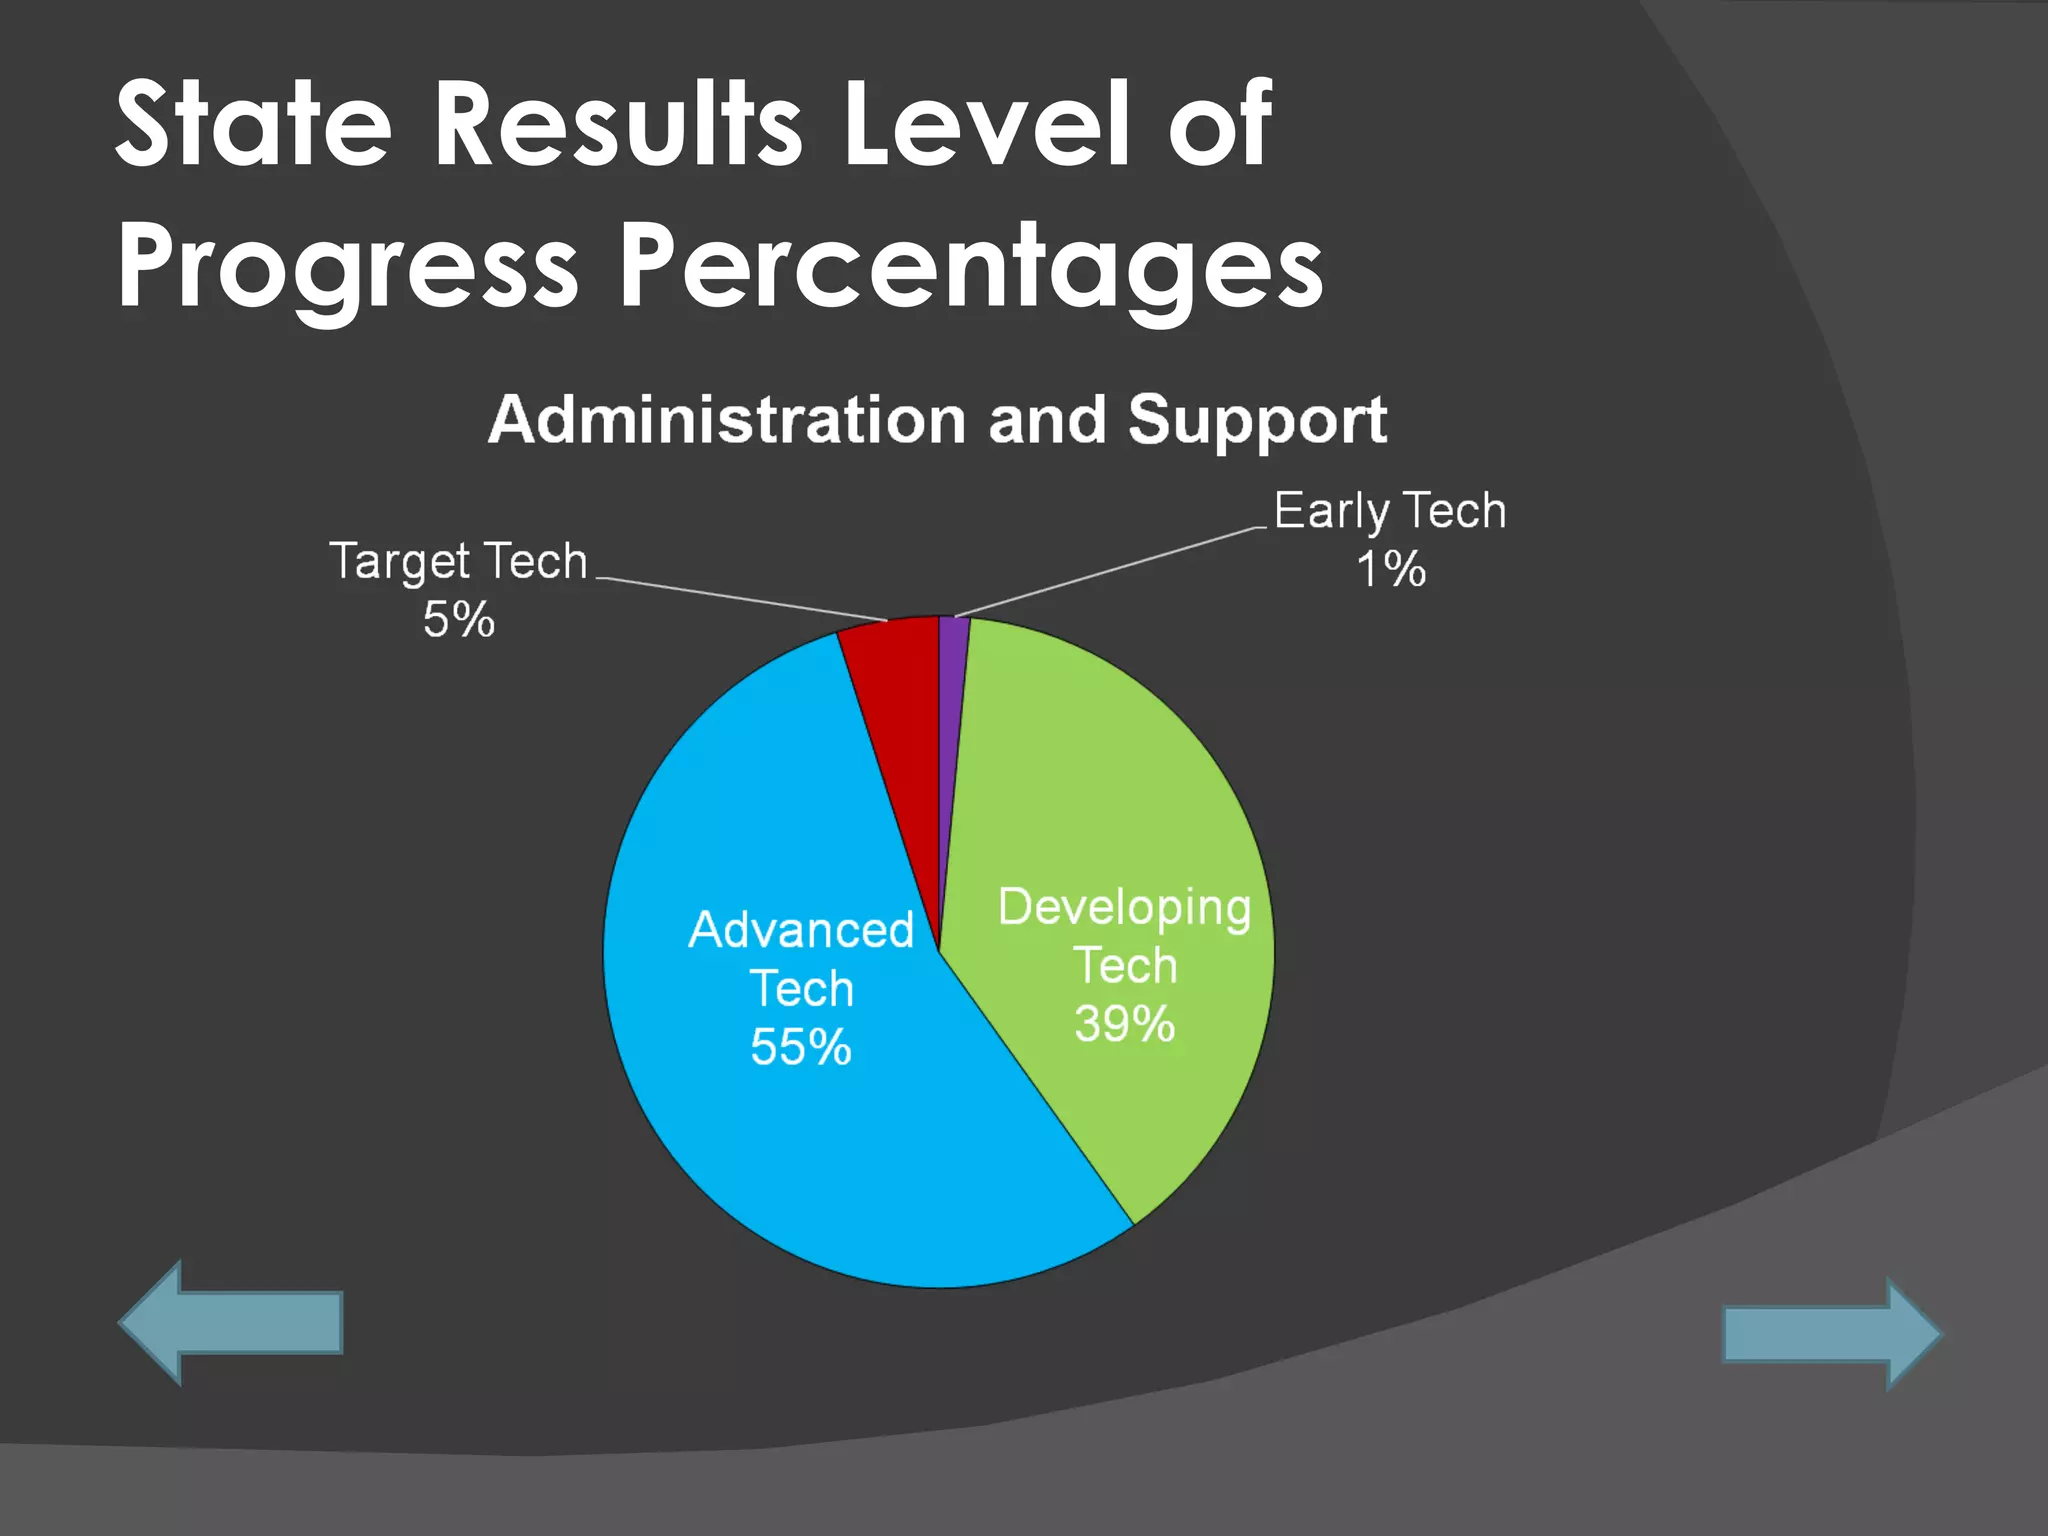
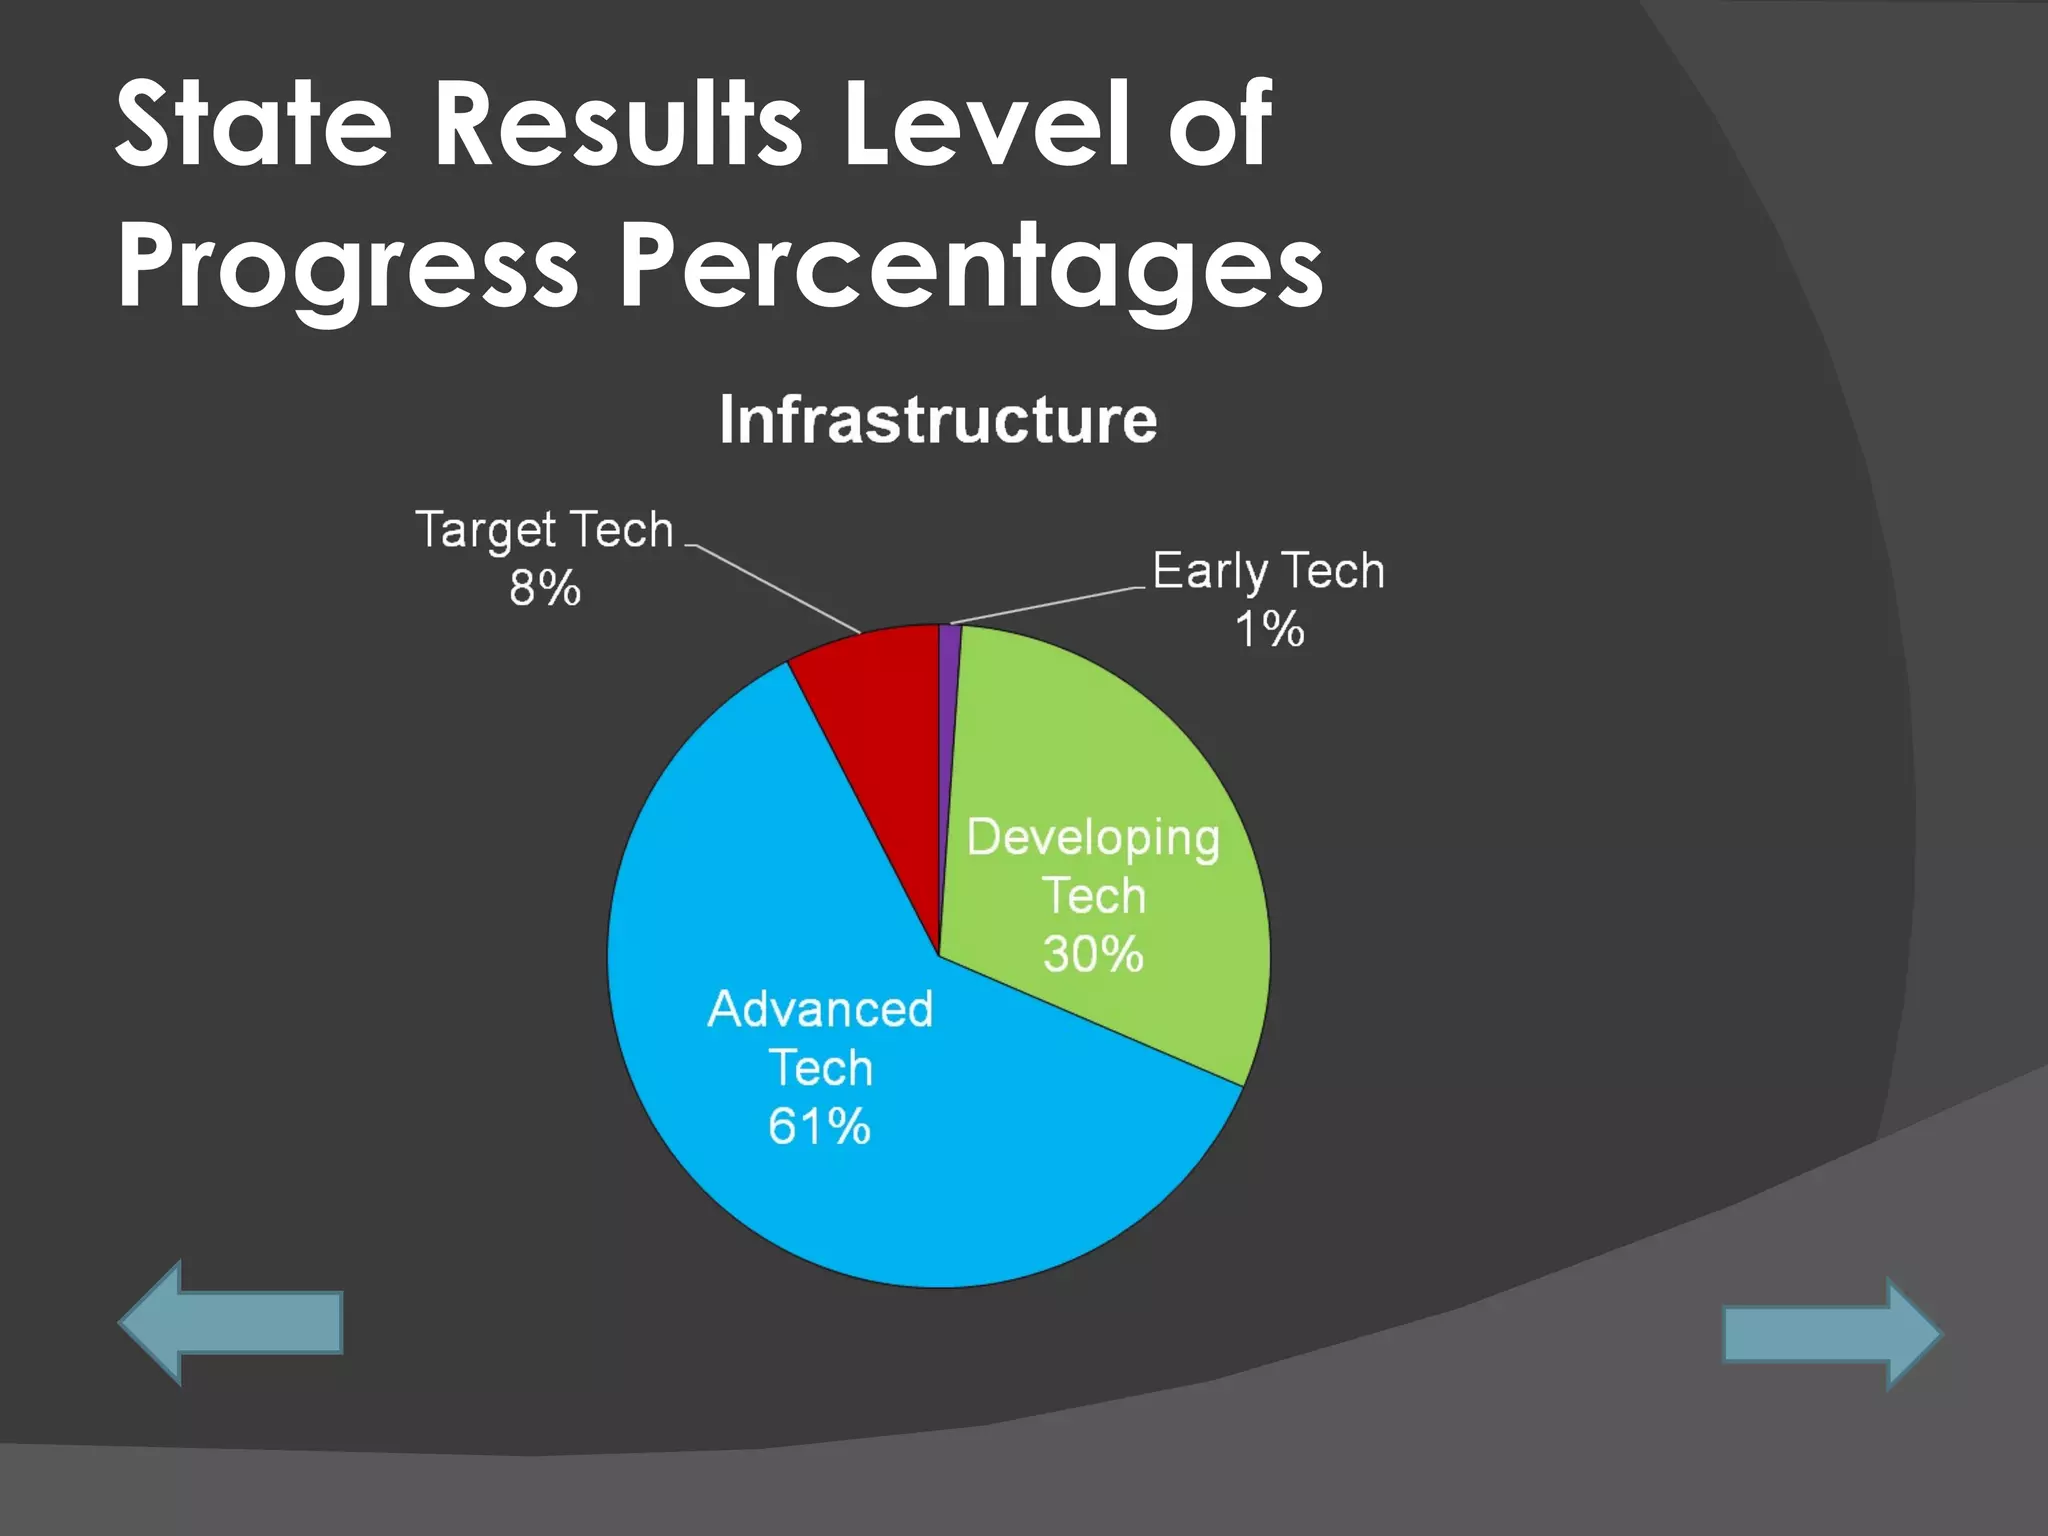
S chool  T echnology   a nd  R eadiness Chart www.tea.state.tx.us/starchart
Agenda What is STaR Chart? What are our campus’ results? How do these results compare to the state’s results?
STaR Chart: What is it? STaR Chart is an assessment focused on the four key areas of the Texas Long Range Plan for Technology: Teaching and Learning Educator Preparation & Development Leadership Administration & Instructional Support Infrastructure for Technology
STaR Chart: Is it required? Yes! All certified teachers and librarians are required to complete the STaR Chart. The deadline is chosen by the district.
STaR Chart Rankings Early Tech  Developing Tech Advanced Tech Target Tech The goal for all Texas teachers is to reach the  Target Tech   level of the STaR Chart
Lufkin High School Results  (2009-2010) Key Area Classification Teaching and Learning Developing Tech Educator Preparation and Development Developing Tech Leadership, Administration and Instructional Support Advanced Tech Infrastructure for Technology Developing Tech
Teaching and Learning: Developing Tech Instruction is teacher-directed and students regularly use technology on an individual basis. There is minimal use of technology in TEKS.  Most Technology Applications TEKS are met K-8 High school campuses teach at least 2 Technology Applications courses.
Educator Preparation : Developing Tech Use of technology is for administrative tasks and classroom management.  There is use of online resources.  40% of educators meet SBEC standards.  6-24% of technology budget allocated for professional development
Administration & Support: Advanced Tech Campus plan board approved and supported by superintendent.  1 technical support staff to 500 computers, full- time district technology director.  Technology Allotment, competitive grants and local funding.
Infrastructure for Technology: Developing Tech There are 5-9 students per computer.  There is direct connectivity to the Internet in 50% of classrooms and library.  Most rooms are connected to WAN/LAN.  One educator per computer, shared use of other resources
State Results Level of Progress Percentages
Summary Although our campus is mostly aligned with the state average, we have a long way to go before we achieve our goal— All teachers reaching target level!

STar chart

  • 1.
    S chool T echnology a nd R eadiness Chart www.tea.state.tx.us/starchart
  • 2.
    Agenda What isSTaR Chart? What are our campus’ results? How do these results compare to the state’s results?
  • 3.
    STaR Chart: Whatis it? STaR Chart is an assessment focused on the four key areas of the Texas Long Range Plan for Technology: Teaching and Learning Educator Preparation & Development Leadership Administration & Instructional Support Infrastructure for Technology
  • 4.
    STaR Chart: Isit required? Yes! All certified teachers and librarians are required to complete the STaR Chart. The deadline is chosen by the district.
  • 5.
    STaR Chart RankingsEarly Tech Developing Tech Advanced Tech Target Tech The goal for all Texas teachers is to reach the Target Tech level of the STaR Chart
  • 6.
    Lufkin High SchoolResults (2009-2010) Key Area Classification Teaching and Learning Developing Tech Educator Preparation and Development Developing Tech Leadership, Administration and Instructional Support Advanced Tech Infrastructure for Technology Developing Tech
  • 7.
    Teaching and Learning:Developing Tech Instruction is teacher-directed and students regularly use technology on an individual basis. There is minimal use of technology in TEKS. Most Technology Applications TEKS are met K-8 High school campuses teach at least 2 Technology Applications courses.
  • 8.
    Educator Preparation :Developing Tech Use of technology is for administrative tasks and classroom management. There is use of online resources. 40% of educators meet SBEC standards. 6-24% of technology budget allocated for professional development
  • 9.
    Administration & Support:Advanced Tech Campus plan board approved and supported by superintendent. 1 technical support staff to 500 computers, full- time district technology director. Technology Allotment, competitive grants and local funding.
  • 10.
    Infrastructure for Technology:Developing Tech There are 5-9 students per computer. There is direct connectivity to the Internet in 50% of classrooms and library. Most rooms are connected to WAN/LAN. One educator per computer, shared use of other resources
  • 11.
    State Results Levelof Progress Percentages
  • 12.
    State Results Levelof Progress Percentages
  • 13.
    State Results Levelof Progress Percentages
  • 14.
    State Results Levelof Progress Percentages
  • 15.
    Summary Although ourcampus is mostly aligned with the state average, we have a long way to go before we achieve our goal— All teachers reaching target level!