Download to read offline

![Lecture 3-NHDS 39
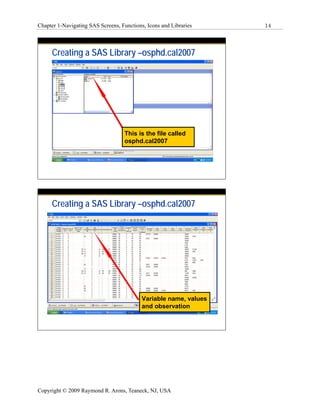
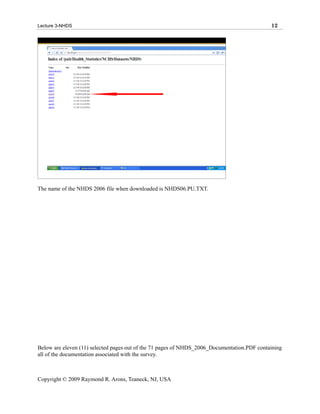
'040'='(040) Other bacterial diseases'
'041'='(041) Bacterial infec in conditns cla...'
'042'='(042) Human immunodeficiency virus in...'
'043'='(043) Human immunodeficiency virus in...'
'044'='(044) Other human immunodeficiency vi...'
'045'='(045) Acute poliomyelitis'
'046'='(046) Slow virus infection of central...'
'047'='(047) Meningitis due to enterovirus'
'048'='(048) Other enterovirus diseases of c...'
'049'='(049) Oth non-arthropod-borne viral d...'
'050'='(050) Smallpox'
'051'='(051) Cowpox and paravaccinia'
'052'='(052) Chickenpox'
'053'='(053) Herpes zoster'
'054'='(054) Herpes simplex'
'055'='(055) Measles'
'056'='(056) Rubella'
'057'='(057) Other viral exanthemata'
'060'='(060) Yellow fever'
'061'='(061) Dengue'
'062'='(062) Mosquito-borne viral encephalitis'
'063'='(063) Tick-borne viral encephalitis'
'064'='(064) Viral encephalitis transmitted ...'
'065'='(065) Arthropod-borne hemorrhagic fever'
'066'='(066) Other arthropod-borne viral dis...'
'070'='(070) Viral hepatitis'
'071'='(071) Rabies'
'072'='(072) Mumps'
'073'='(073) Ornithosis'
'074'='(074) Specific diseases due to Coxsac...'
'075'='(075) Infectious mononucleosis'
'076'='(076) Trachoma'
'077'='(077) Other diseases of conjunctiva d...'
'078'='(078) Other diseases due to viruses a...'
'079'='(079) Viral infection in conditns cla...'
'080'='(080) Louse-borne [epidemic] typhus'
'081'='(081) Other typhus'
'082'='(082) Tick-borne rickettsioses'
'083'='(083) Other rickettsioses'
'084'='(084) Malaria'
'085'='(085) Leishmaniasis'
'086'='(086) Trypanosomiasis'
'087'='(087) Relapsing fever'
'088'='(088) Other arthropod-borne diseases'
'090'='(090) Congenital syphilis'
'091'='(091) Early syphilis, symptomatic'
'092'='(092) Early syphilis, latent'
'093'='(093) Cardiovascular syphilis'
'094'='(094) Neurosyphilis'
'095'='(095) Other forms of late syphilis, w...'
'096'='(096) Late syphilis, latent'
Copyright © 2009 Raymond R. Arons, Teaneck, NJ, USA](https://image.slidesharecdn.com/sta9000-12863759916745-phpapp01/85/Sta9000-76-320.jpg)
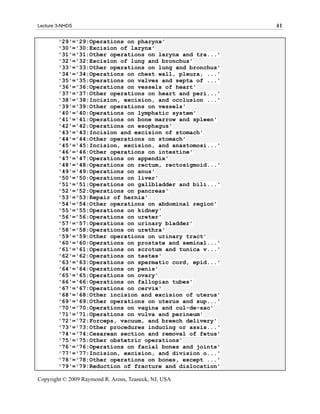
![Lecture 3-NHDS 52
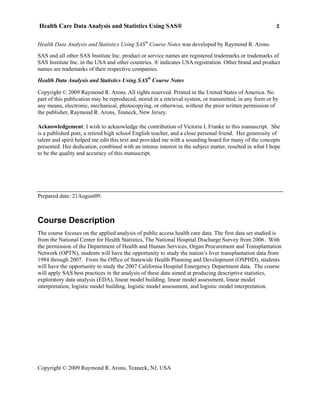
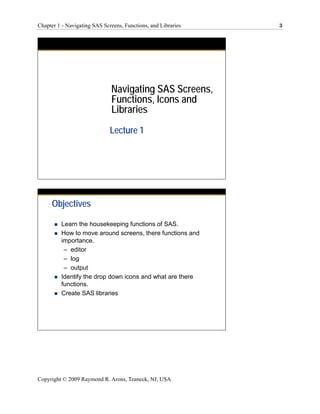
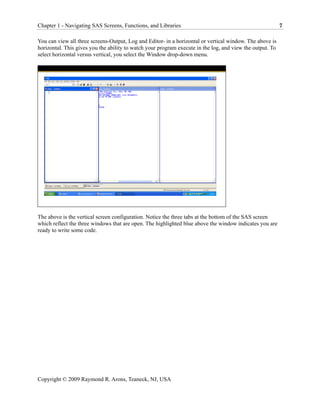
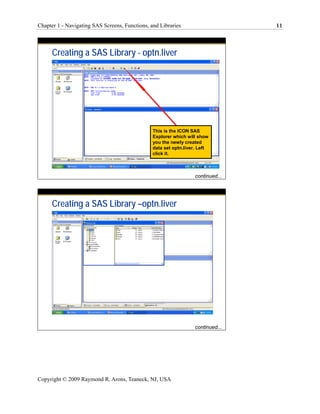
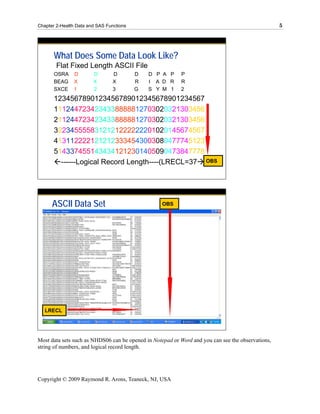
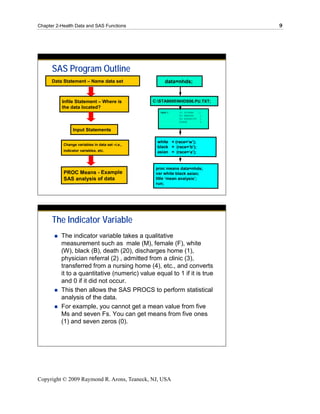
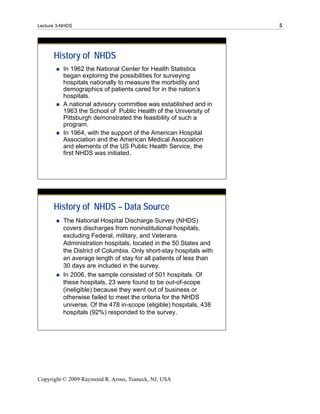
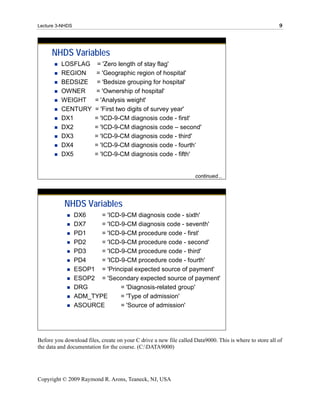
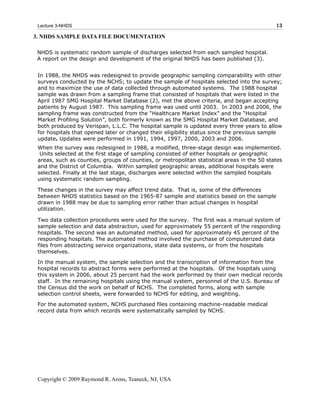
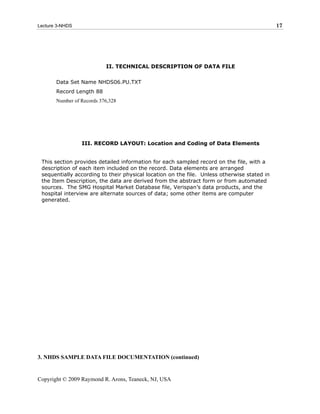
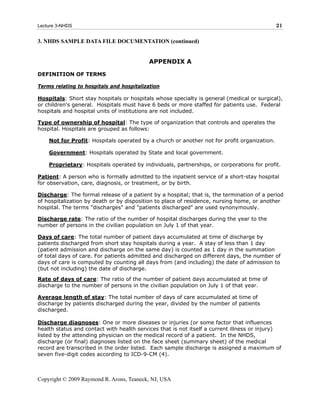
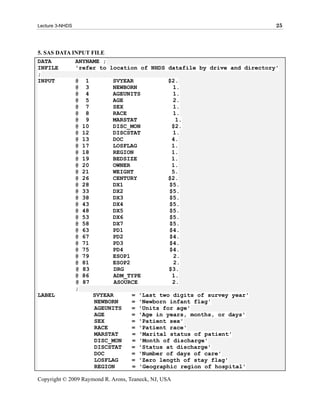
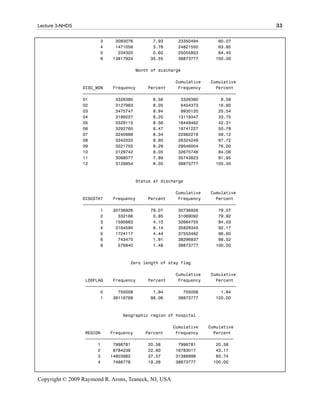
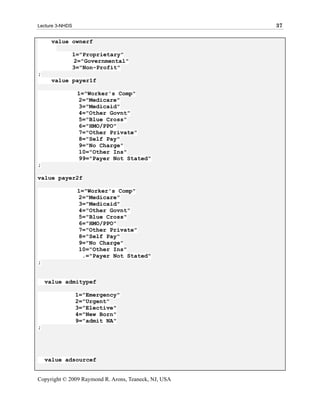
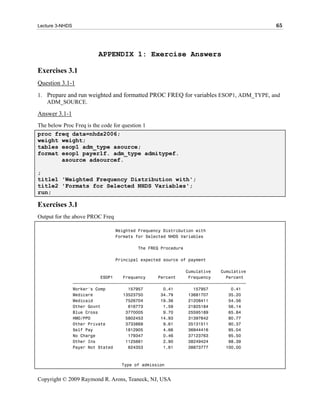
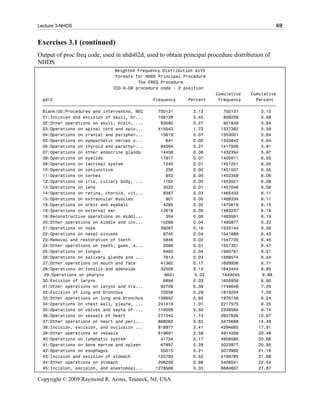
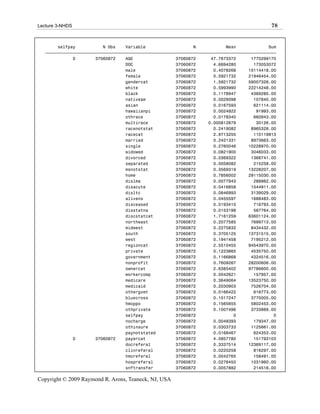
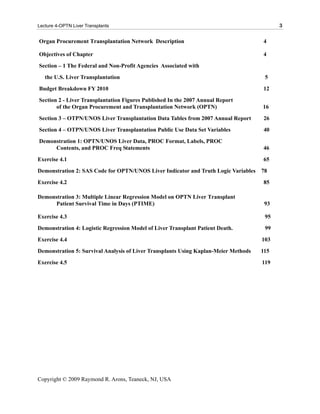
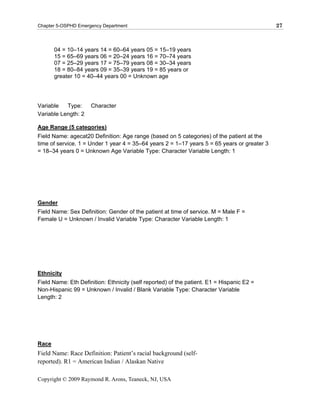
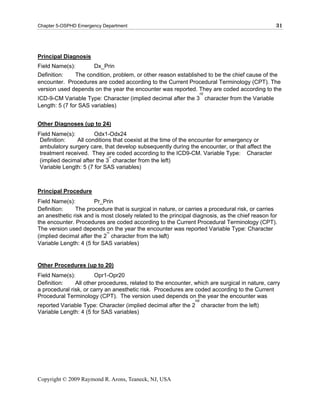
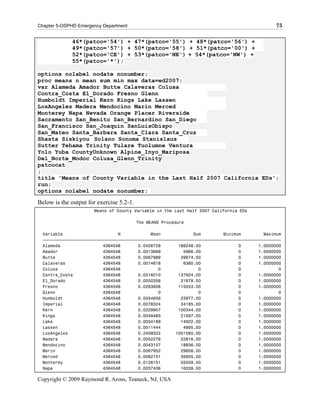
11. Exercises 3.2
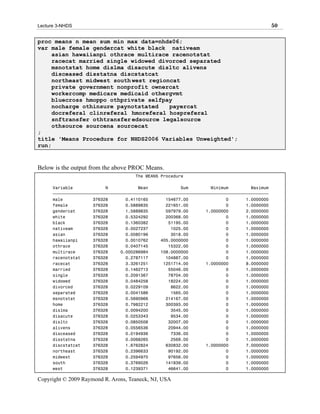
1. Using nhds03d, write the indicator and truth logic code for the variables admitype, bedsize,
dismonth, and los flag.
2. Submit a weighted version of the nhds03d Prod Means with these variables plus days of care
(DOC) and age.
3. Using the above output and weighted means. Present a narrative of the presentage distribution
of admitype, bedsize, dismonth, and losflag.
4. Using nhds03d insert the [class selfpay] into the proc mean. The output will yield the
differences between the selfpay (uninsured) and non-selfpay (insured). Prepare a narrative that
compares the demographic differences between the uninsured and insured populations.
Copyright © 2009 Raymond R. Arons, Teaneck, NJ, USA](https://image.slidesharecdn.com/sta9000-12863759916745-phpapp01/85/Sta9000-89-320.jpg)
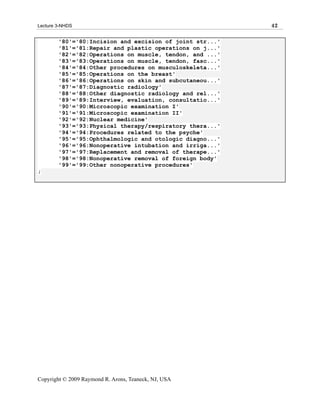
![Lecture 3-NHDS 59
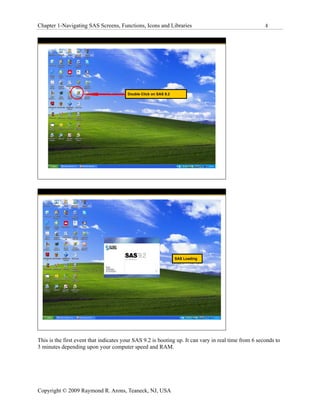
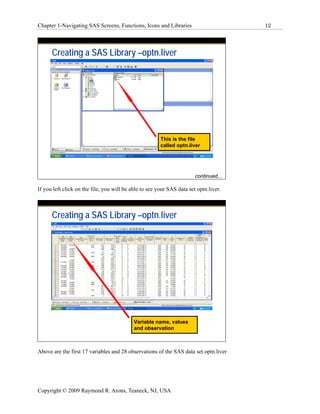
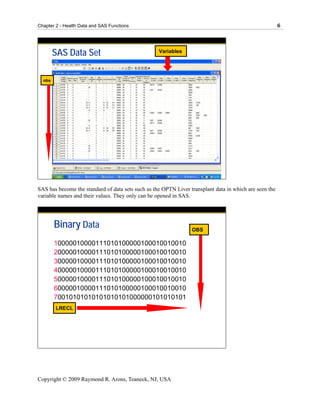
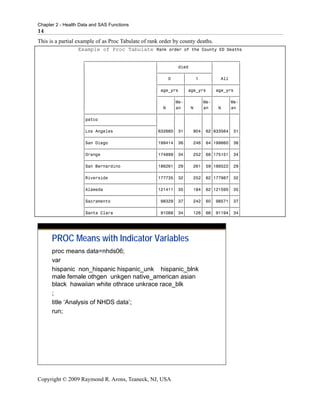
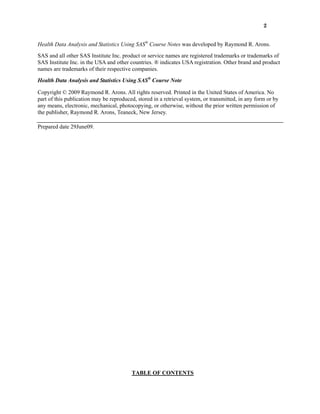
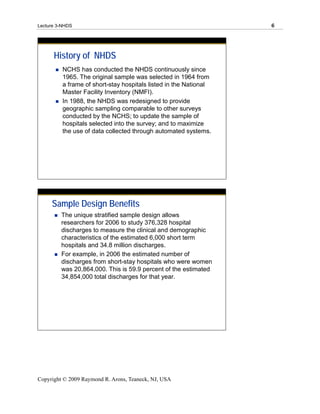
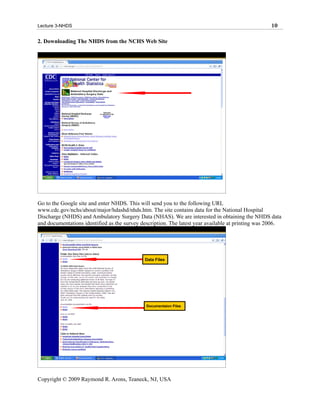
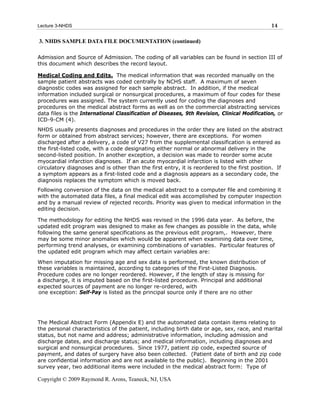
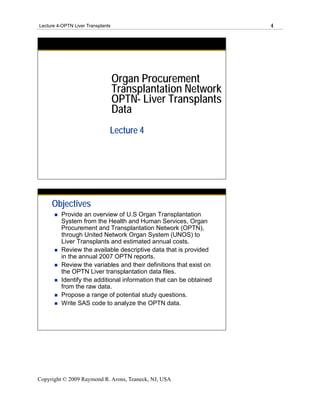
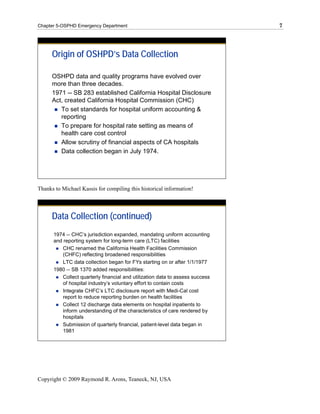
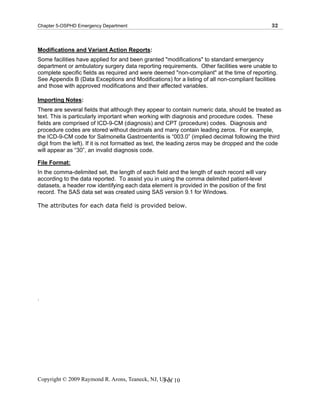
Effect Estimate Confidence Limits
AGE 0.976 0.976 0.977
gendercat 1 vs 2 1.535 1.486 1.586
racecat 2 vs 1 1.227 1.172 1.284
racecat 3 vs 1 2.106 1.685 2.632
racecat 4 vs 1 1.118 0.925 1.352
racecat 5 vs 1 1.079 0.668 1.742
racecat 6 vs 1 1.324 1.231 1.423
racecat 7 vs 1 3.346 1.774 6.308
racecat 8 vs 1 1.441 1.384 1.501
admitcat 1 vs 3 2.449 2.330 2.573
admitcat 2 vs 3 1.209 1.137 1.285
admitcat 4 vs 3 0.494 0.459 0.531
admitcat 5 vs 3 1.638 1.509 1.777
regioncat 1 vs 2 1.016 0.963 1.071
regioncat 3 vs 2 1.473 1.408 1.542
regioncat 4 vs 2 1.139 1.072 1.211
Association of Predicted Probabilities and Observed Responses
Percent Concordant 70.6 Somers' D 0.432
Percent Discordant 27.4 Gamma 0.441
Percent Tied 2.0 Tau-a 0.035
Pairs 5733561360 c 0.716
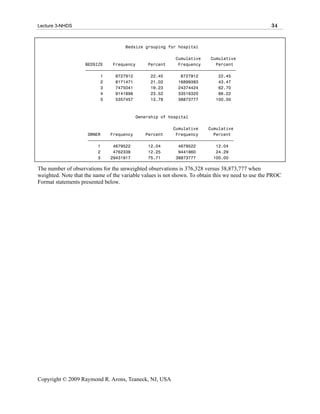
Logistic Regression for NHDS Selfpay (uninsured)
The LOGISTIC Procedure
Odds Ratios
Effect Unit Estimate
AGE 10.0000 0.786
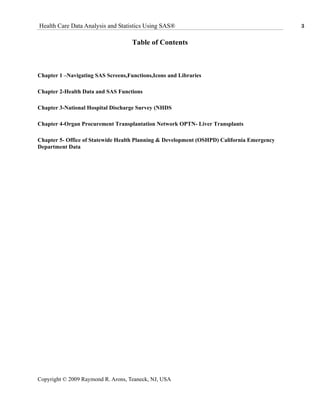
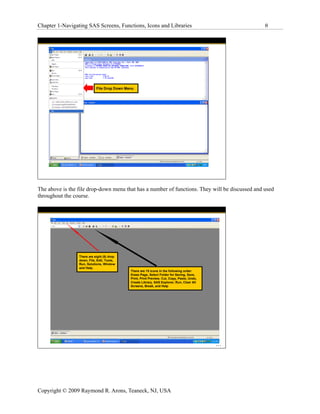
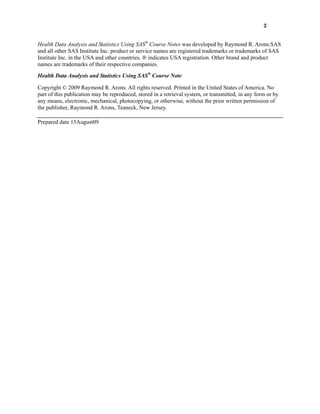
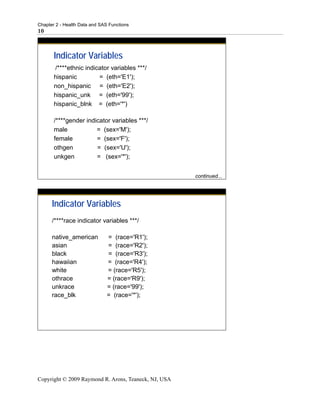
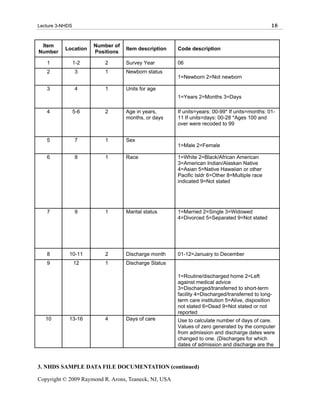
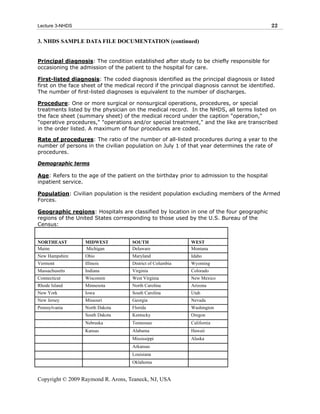
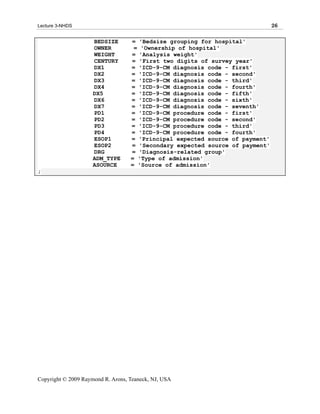
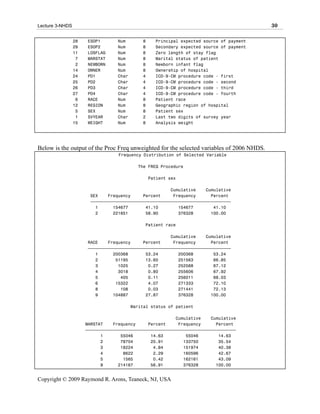
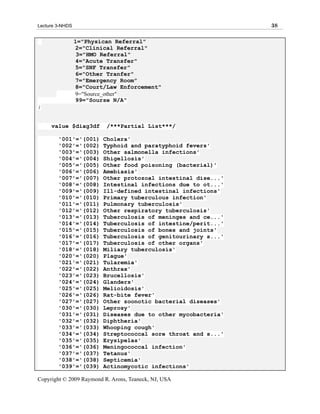
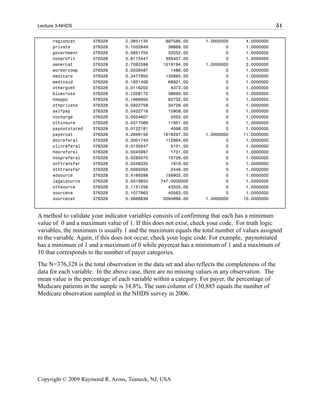
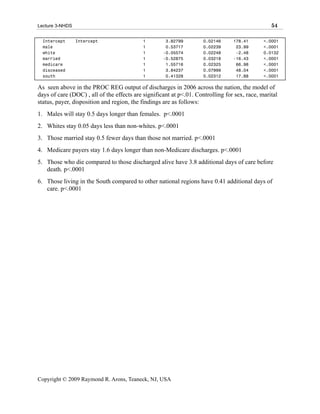
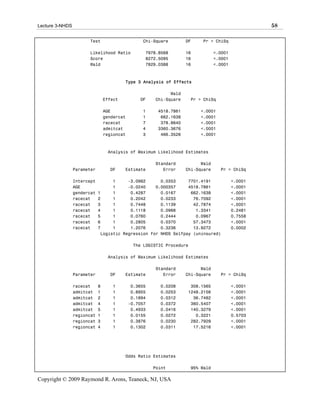
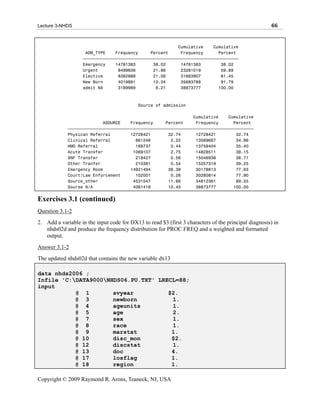
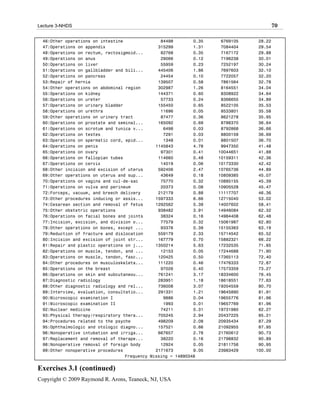
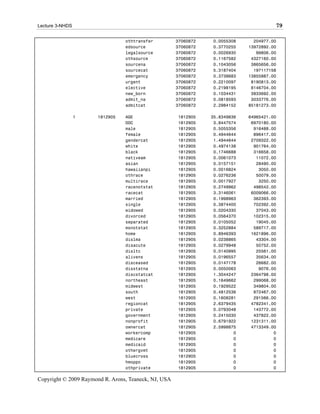
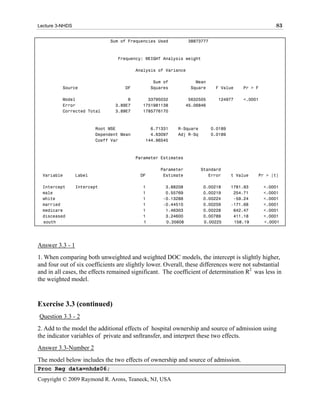
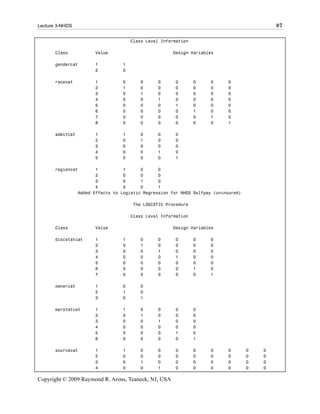
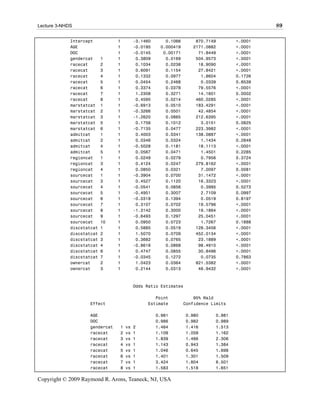
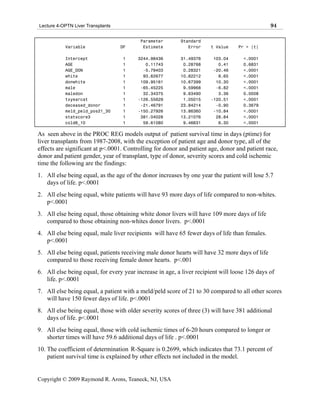
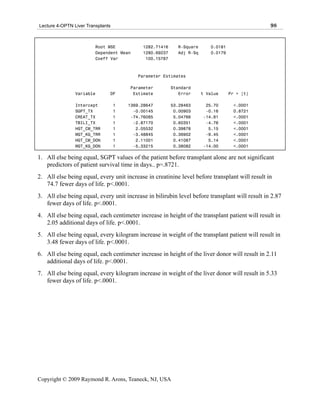
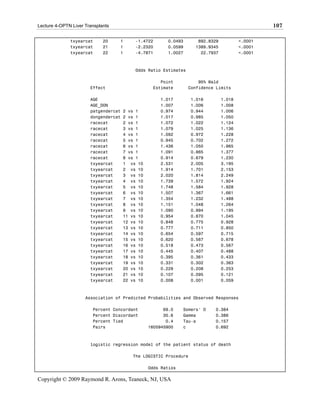
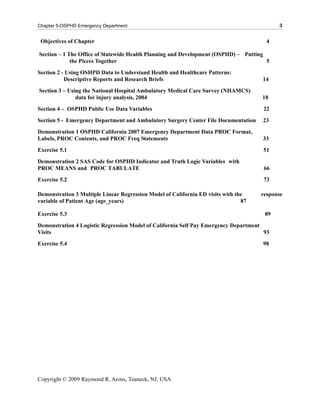
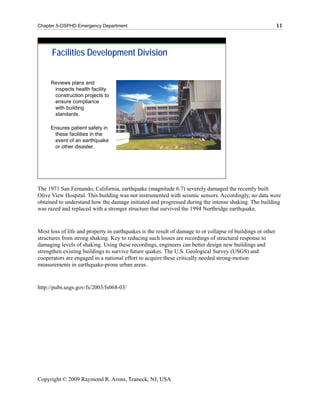
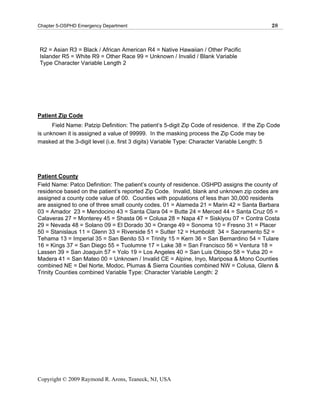
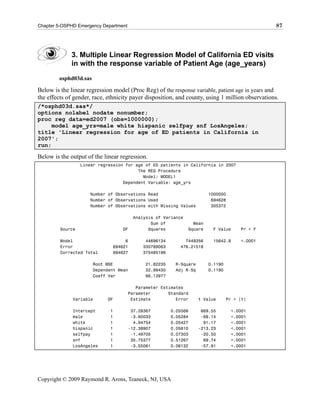
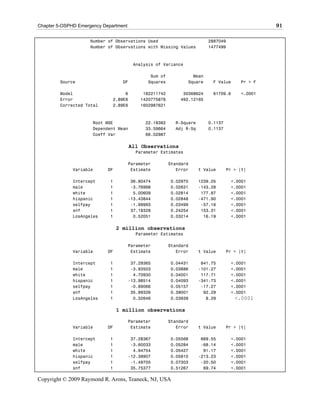
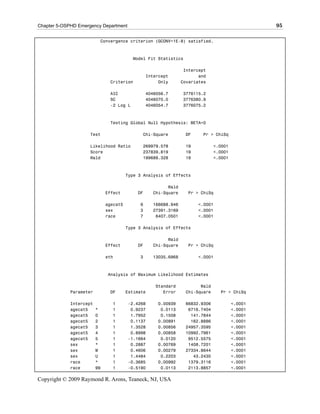
As seen above in the proc logistic output of discharges in 2006 across the nation, the model of
days of care uninsured (selfpay), all of the effects are significant at p<.0001. Controlling for age,
gender, race, admit type, payer, and region, the findings are as follows:
1. All else being equal, males are 1.535 times more likely to be uninsured than females,
p<.0001[CI 1.486, 1.586].
2. All else being equal, blacks compared to whites are 1.227 times more likely to be
uninsured, p<.0001[CI 1.172 , 1.284].
3. All else being equal, multiple races compared to whites are 3.346 times more likely to be
uninsured, p<.0001[CI 1.774, 6.308].
4. All else being equal, Native Americans compared to whites were 2.106 times more likely to
be uninsured, p<.0001[CI 1.685, 2.632].
Copyright © 2009 Raymond R. Arons, Teaneck, NJ, USA](https://image.slidesharecdn.com/sta9000-12863759916745-phpapp01/85/Sta9000-96-320.jpg)
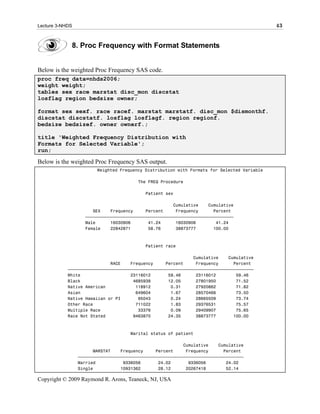
![Lecture 3-NHDS 60
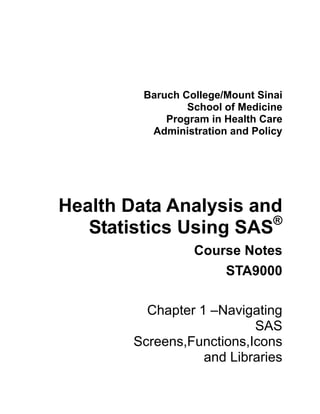
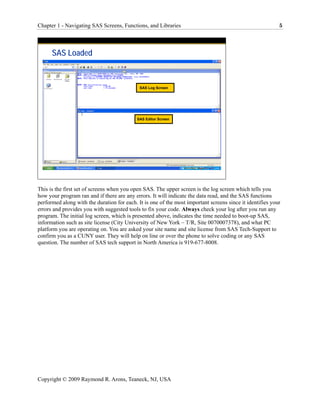
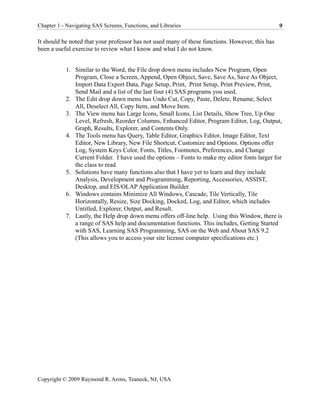
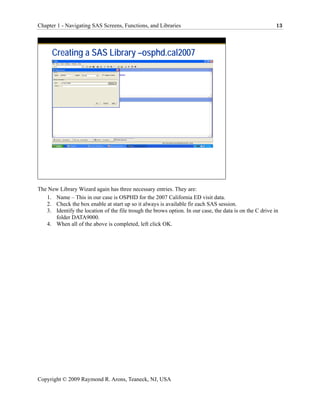
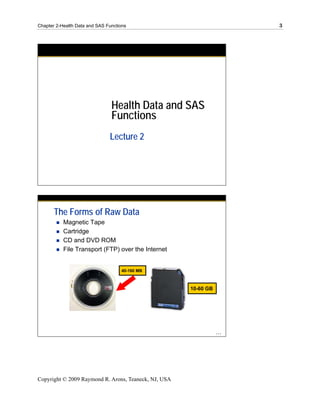
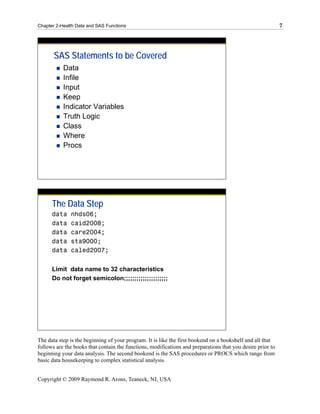
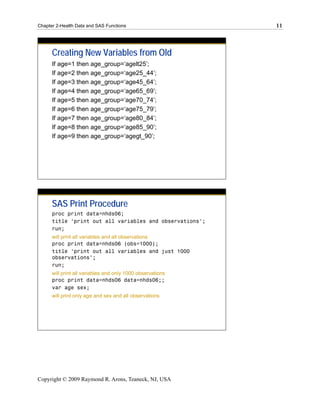
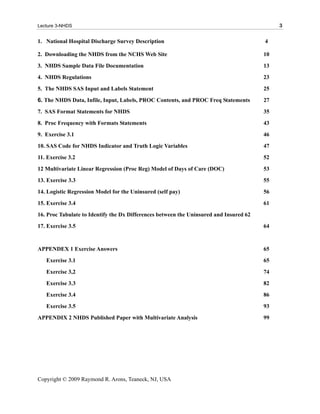
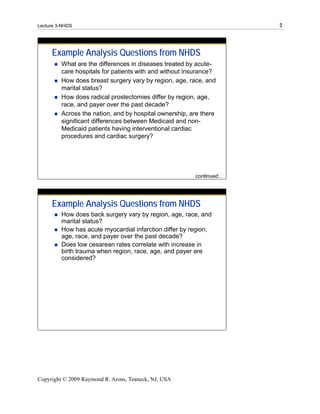
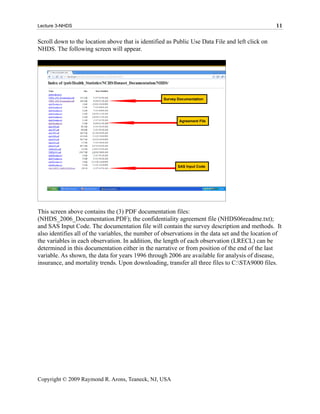
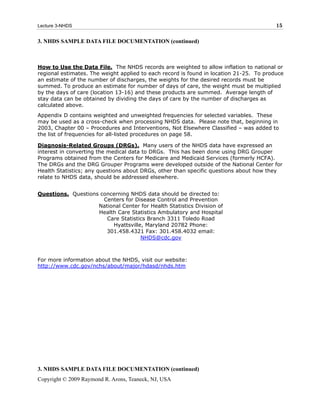
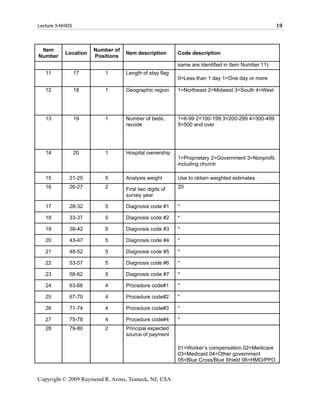
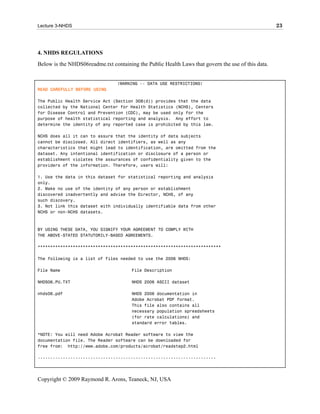
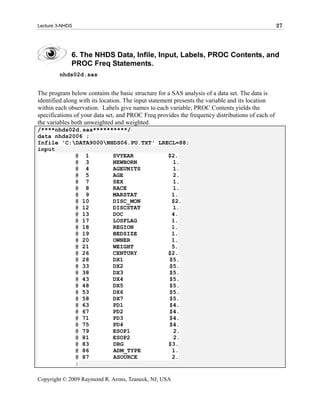
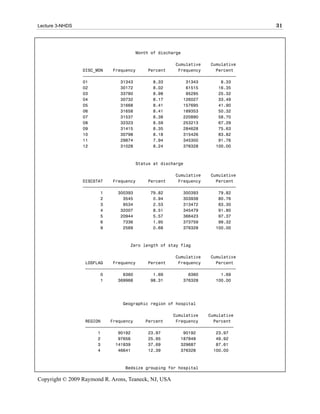
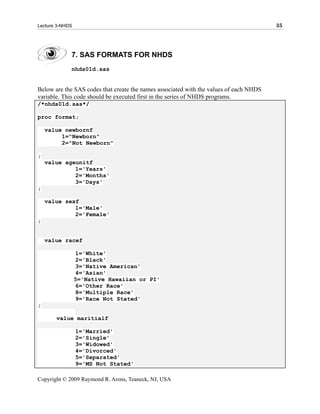
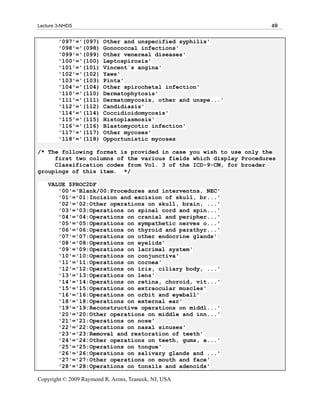
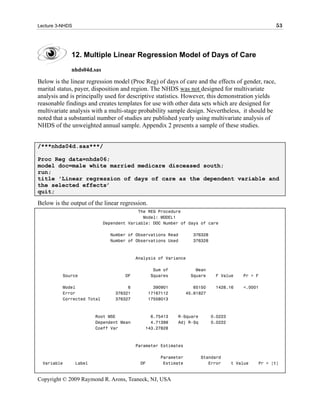
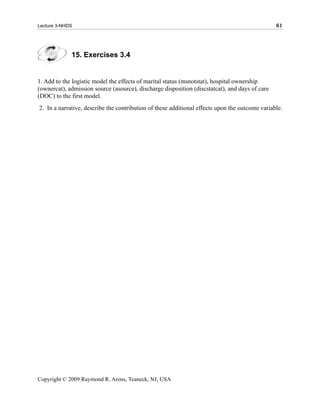
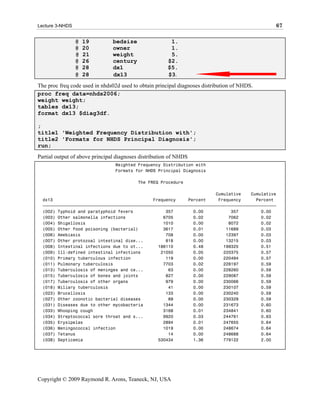
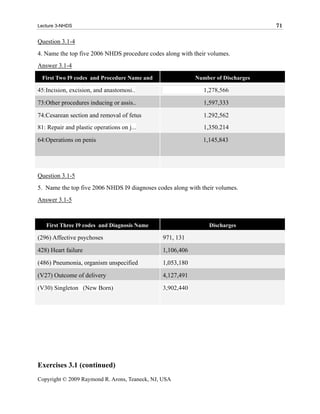
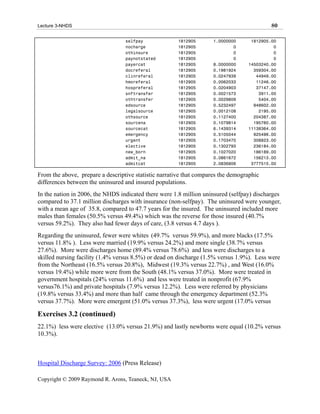
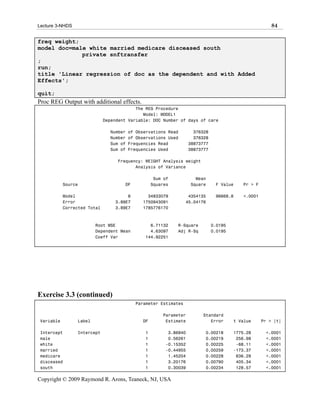
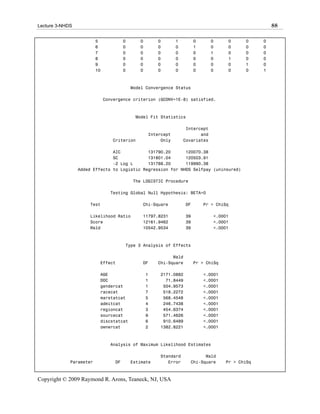
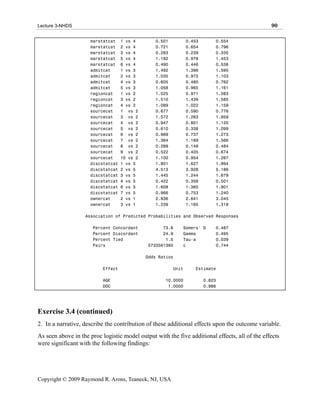
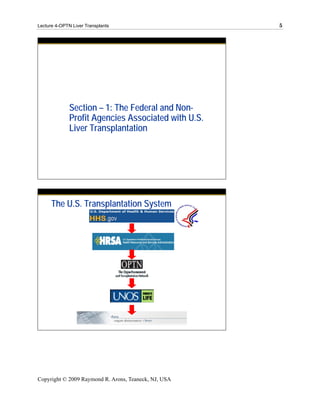
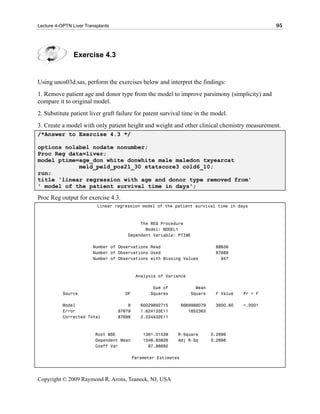
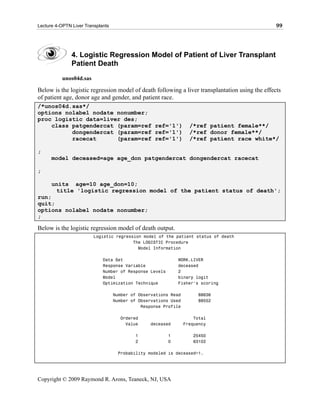
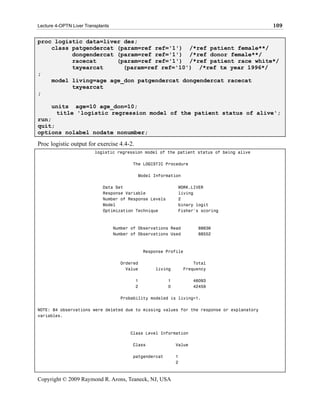
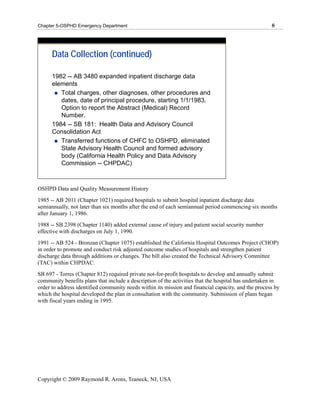
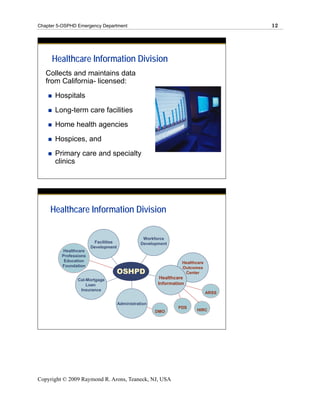
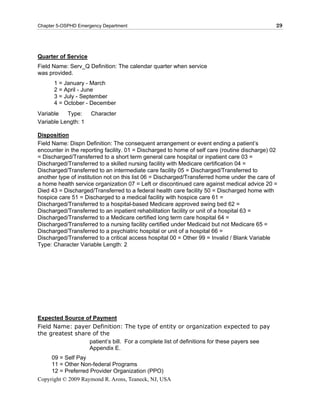
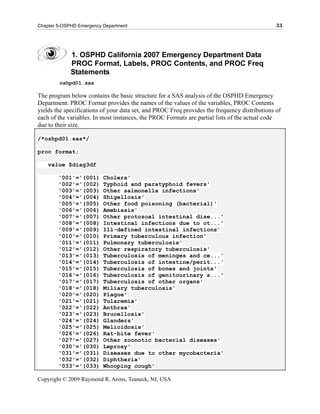
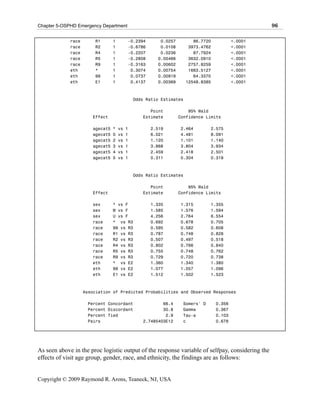
5. All else being equal, emergencies compared to electives were 2.449 times more likely to be
uninsured, p<.0001[CI 2.330, 2.573].
6. All else being equal, newborn compared to electives were 50.6 percent less likely to be
uninsured, p<.0001[CI 0.459 , 0.531].
7. All else being equal, those from the South compared to the Midwest were 1.473 times more
likely to be uninsured, p<.0001[CI 1.408, 1.542].
8. All else being equal, those from the West compared to the Midwest were 1.139 times more
likely to be uninsured, p<.0001[CI 1.072, 1.221].
Copyright © 2009 Raymond R. Arons, Teaneck, NJ, USA](https://image.slidesharecdn.com/sta9000-12863759916745-phpapp01/85/Sta9000-97-320.jpg)
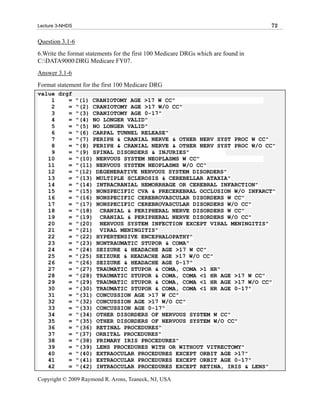
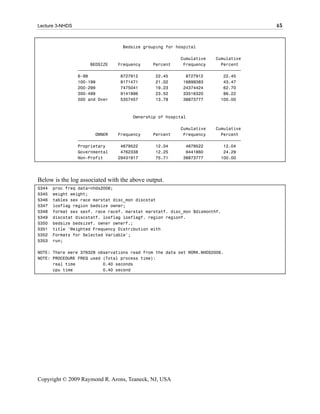
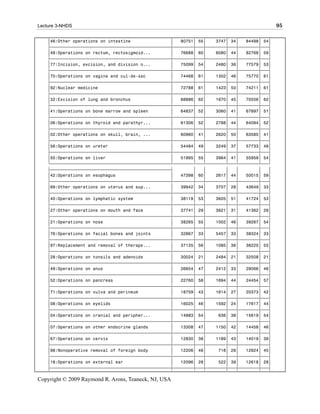
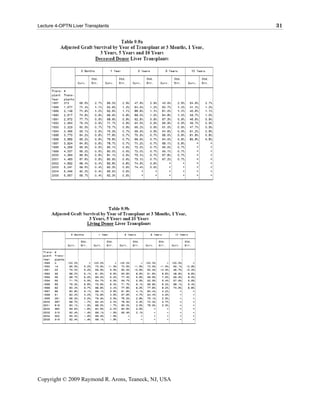
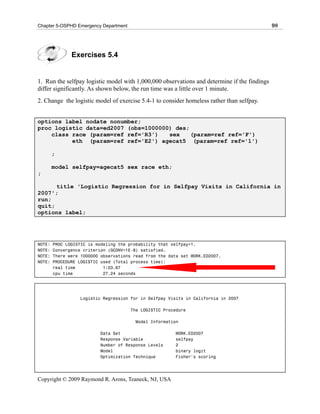
![Lecture 3-NHDS 77
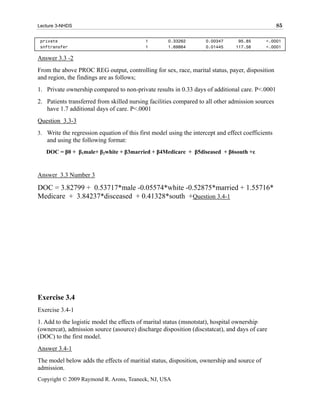
Answer 3.2-3
When weighted, there were 38.9 million discharges in the 2006 NHDS. The mean days of care
were 4.63 days with a range of 1 to 381 days. The mean age was 47.2 with a range of 0 to 99
years. Admitting type indicated 38.0% were from the emergency department, 21.9% were urgent,
21.5% were elective, 10.3% were newborns and 8.2% were not reported.
The distribution of hospital bed size across the nation were: 22.4 percent for 6 to 99 beds, 21.0%
for 100 to 199 beds, 19.2% for 200 to 299 beds, 23.5% for 300 to 499 beds and lastly 13.8
percent for 500 or more beds.
The 2006 monthly discharge distribution from January through October ranged from a low of
8.0% in October to a high of 8.9% in March 2006. The lowest month was November 2006 with
7.8%. The length of stay flag indicated that 1.9% of the 2006 discharges were less than 1 day
and 98.0% were one day or more.
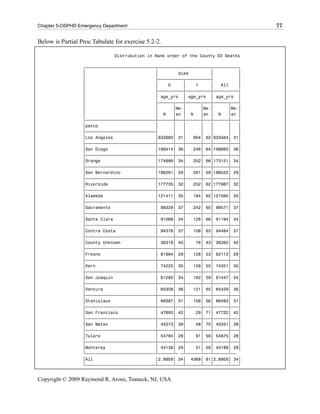
Question 3.2-4
4. Using nhds03d, insert the [class selfpay] into the proc mean. The output will yield the
differences between the selfpay (uninsured) and non-selfpay (insured). Prepare a narrative that
compares the demographic differences between the uninsured and insured populations.
Answer 3.2-4
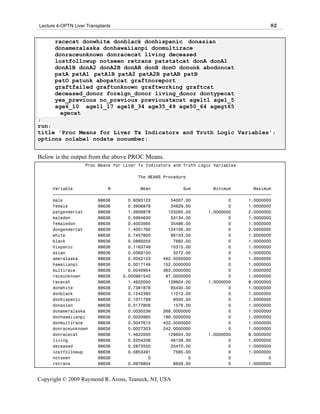
Below is the PROC Means code added to nhds03d that answers question 3.2- 4.
proc means n mean sum min max data=nhds06;
freq weight;
class selfpay;
var doc age male female gendercat white black nativeam
asian hawaiianpi othrace multirace racenotstat
racecat married single widowed divorced separated
msnotstat home dislma disacute disltc alivens
disceased disstatna discstatcat northeast midwest
south west regioncat private government nonprofit
ownercat workercomp medicare medicaid othergvmt
bluecross hmoppo othprivate selfpay
nocharge othinsure paynotstated payercat
docreferal clinreferal hmoreferal hospreferal
snftransfer othtransfer edsource legalsource
othsource sourcena sourcecat emergency urgent
elective new_born admit_na admitcat
;
run;
Exercises 3.2 (continued)
Below is the PROC Means output that assists in completing question 3.2- 4.
Proc Means Comparing Insured to Uninsured Variables
The MEANS Procedure
Copyright © 2009 Raymond R. Arons, Teaneck, NJ, USA](https://image.slidesharecdn.com/sta9000-12863759916745-phpapp01/85/Sta9000-114-320.jpg)
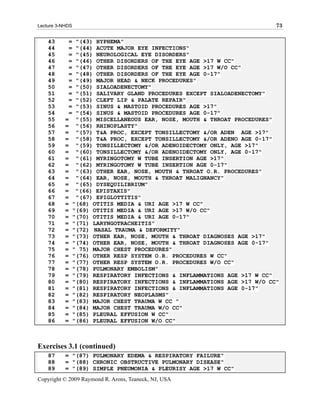
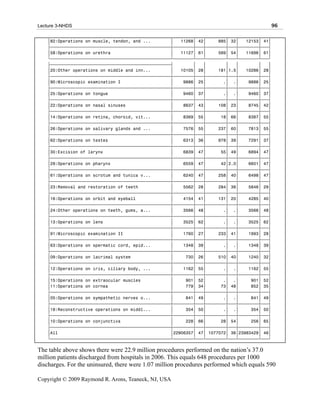
![Lecture 3-NHDS 91
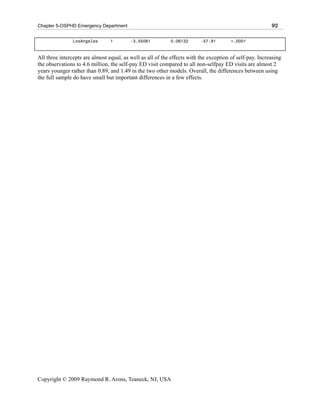
1. All else being equal, males are 1.464 times more likely to be uninsured than females,
p<.0001[CI 1.416, 1.5131]. These odds are slightly lower in the expanded model (1.464
versus 1.535).
2. All else being equal, blacks compared to whites are 1.109 times more likely to be uninsured,
p<.0001[CI 1.058, 1.162]. These odds are slightly lower in the expanded model (1.227
versus 1.109).
3. All else being equal, multiple races compared to whites are 3.424 times more likely to be
uninsured, p<.0001[CI 1.804, 6.501]. These odds are slightly higher in the expanded model
(3.424 versus 3.346).
4. All else being equal, Native Americans compared to whites were 1.839 times more likely to
be uninsured, p<.0001[CI 1.466, 2.306]. These odds are slightly lower in the expanded
model (1.839 versus 2.106).
5. All else being equal, emergencies compared to electives were 1.492 times more likely to be
uninsured, p<.0001[CI 1.396, 1.595]. These odds are significantly lower in the expanded
model (1.492 versus 2.449).
6. All else being equal, newborns compared to electives were 39.5 percent less likely to be
uninsured, p<.0001[CI 0.480 , 0.762]. These odds are slightly lower in the expanded model
(0.605 versus 0.506).
7. All else being equal, those from the South compared to the Midwest were 1.510 times more
likely to be uninsured, p<.0001[CI 1.439, 1.585]. These odds are slightly higher in the
expanded model (1.510 versus 1.473).
8. All else being equal, those from the West compared to the Midwest were 1.089 times more
likely to be uninsured, p<.0001[CI 1.022, 1.159]. These odds are slightly lower in the
expanded model (1.089 versus 1.139).
9. All else being equal, those who are married compared to those divorced were 49.9 percent
less likely to be uninsured, p<.0001[CI 0.501, 0.554].
10. All else being equal, those who are widowed compared to those divorced were 27.9 percent
less likely to be uninsured, p<.0001[CI 0.239, 0.335].
11. All else being equal, those who are single compared to those divorced were 49.9 percent less
likely to be uninsured, p<.0001[CI 0.453, 0.554].
12. All else being equal, those who enter the hospital through the emergency department
compared to a clinic referral are 1.36 times more likely to be uninsured, p<.0001[CI 1.189,
1.566].
13. All else being equal, those who enter the hospital by physician compared to a clinic referral
are 32.3 percent less likely to be uninsured, p<.0001[CI 0.590, 0.776].
14. All else being equal, those who enter the hospital through the legal system compared to a
clinic referral are 73.1 percent less likely to be uninsured, p<.0001[CI 0.590, 0.776].
Copyright © 2009 Raymond R. Arons, Teaneck, NJ, USA](https://image.slidesharecdn.com/sta9000-12863759916745-phpapp01/85/Sta9000-128-320.jpg)
![Lecture 3-NHDS 92
15. All else being equal, those who left the hospital against medical advice compared to those
alive without discharge status were 4.5 times more likely to be uninsured, p<.0001[CI 3.982,
5.186].
16. All else being equal, those who are discharged dead compared to those alive without
discharge status were 1.6 times more likely to be uninsured, p<.0001[CI 1.360, 1.901].
17. All else being equal, those who are discharged to a long term care facility compared to those
alive without discharge status were 67.8 percent less likely to be uninsured, p<.0001[CI
0.356, 0.501].
18. All else being equal, those who are discharged home compared to those alive without
discharge status were 1.8 times more likely to be uninsured, p<.0001[CI 1.627, 1.994].
19. All else being equal, those who are discharged from a governmental hospital compared to
for- profit hospital were 2.8 times more likely to be uninsured, p<.0001[CI 2.641, 3.045].
20. All else being equal, those who are discharged from a not-for-profit hospital compared to a
for-profit hospital were 1.24 times more likely to be uninsured, p<.0001[CI 1.165, 1.318].
21. For every decade of age, a patient is 17.7 percent less likely to be uninsured, p<.0001.
22. For ever additional day of care, a patient is 1.4 percent less likely to be uninsured, p<.0001.
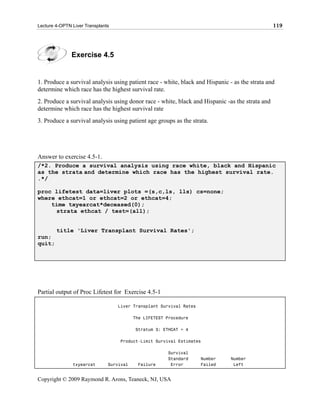
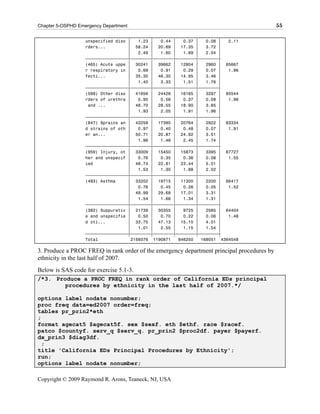
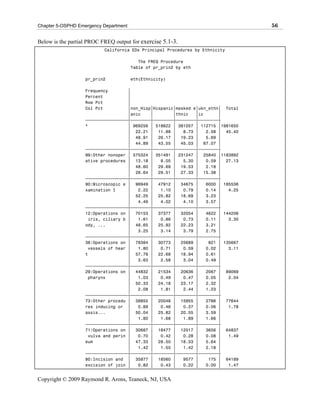
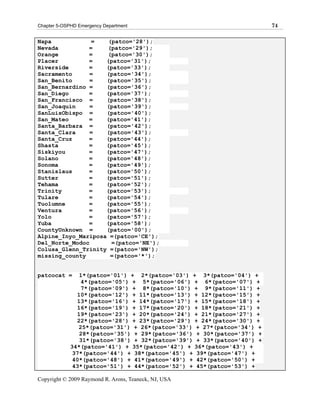
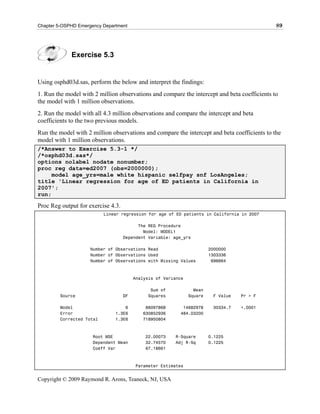
Exercise 3.5
Using the Proc Tabulate above substitute the principal procedure (pr21) and var age to produce a table
comparing the uninsured (self pay) and insured, the principal procedure, and corresponding mean age.
The code below will produce the rank order distribution of procedures associated with the selfpay (1) and
non-selfpay (0) population.
options nolabel nodate nonumber;
proc tabulate data=nhds06 order=freq; /* formchar=' '; */
freq weight;
class selfpay pd12;
var age;
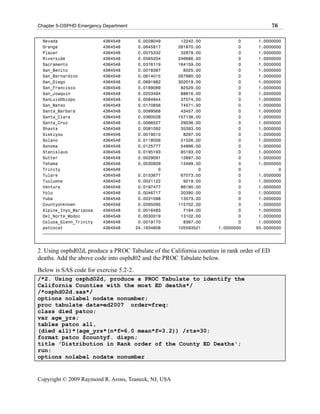
tables pd12 all,
(selfpay all)*(age*(n*f=8.0 mean*f=3.2)) /rts=50;
format pd12 $proc2df.;
run;
Copyright © 2009 Raymond R. Arons, Teaneck, NJ, USA](https://image.slidesharecdn.com/sta9000-12863759916745-phpapp01/85/Sta9000-129-320.jpg)


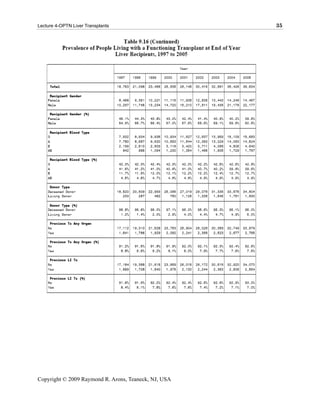
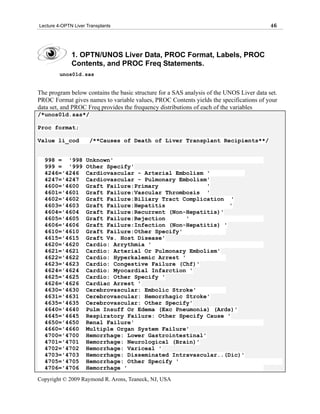
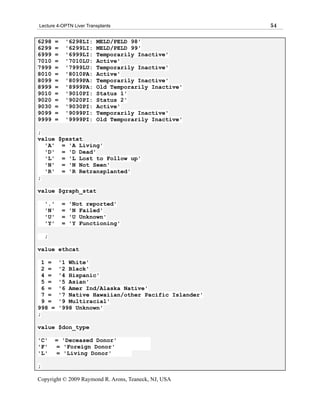
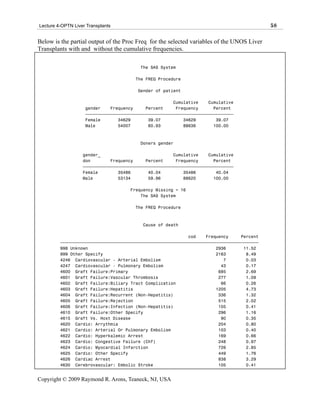
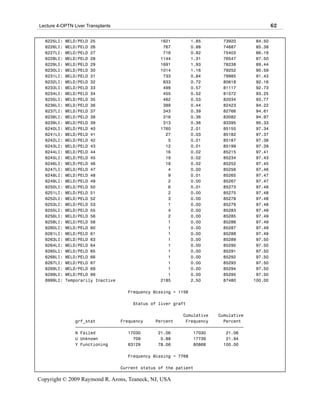
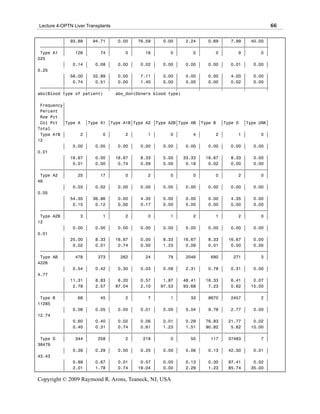
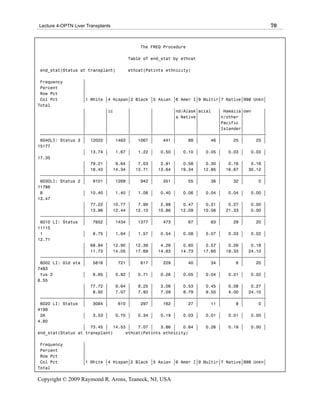
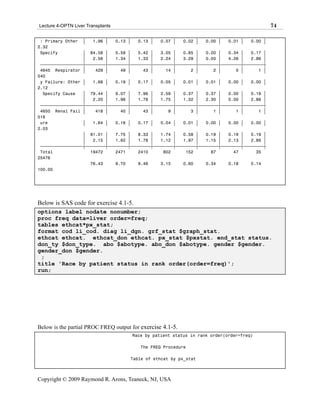
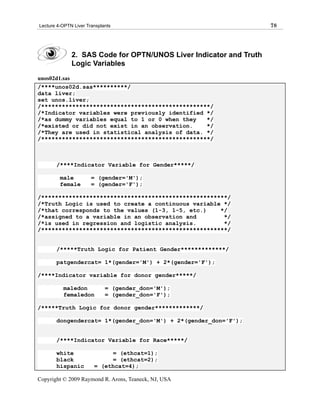
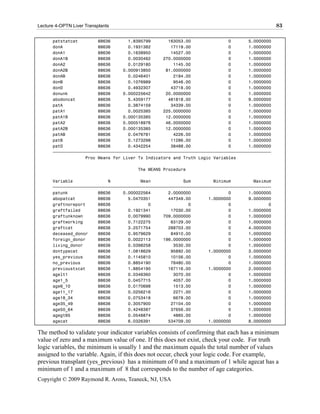
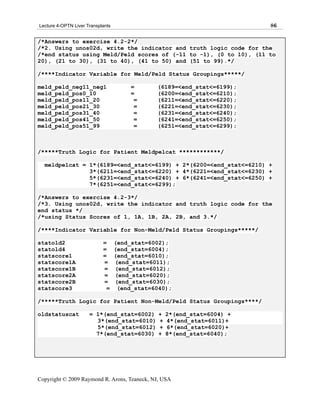
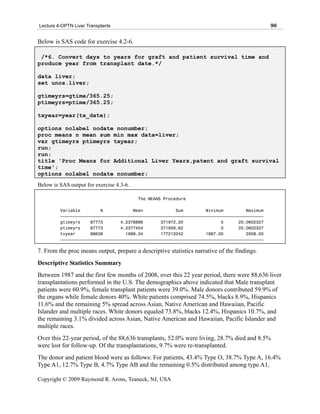
![Lecture 4-OPTN Liver Transplants 43
OPTN/UNOS Public Use Data Variables
age_don = 'Donor age'
ethcat_don = 'Donor ethnicity'
don_ty = 'Donor source'
gender_don = 'Donor gender'
abo_don = 'Doner blood type'
creat_tx = 'Patient creatinine at transplant‘
tbili_tx = 'Patient billirubin at transplant'
ethcat = 'Patient ethnicity'
N
u
m
b
er
continued...
of
MELD and PELD Equations for Disease Severity
MELDa = (0.957 x log[creatinine mg/dl]) + (0.378 x log[bilirubin mg/dl]) + (1.12 x log[INR]) + 0.643 x
10
PELD = (0.436 x ageb) - (0.687 x log[albumin g/dl]) + (0.480 x log[bilirubin mg/dl]) + (1.857 x
log[INR]) + (0.0667 x growth failurec) x 10
aCapped at 40 points.bAge <1 year = 1 MELD point; age >1 year = 0 MELD points.cGrowth failure = 1
MELD point; no growth failure = 0 MELD points. INR, international normalized ratio of prothrombin
time.
Russell H Wiesner, Mayo Clinic Transplant Center, Rochester, MN ,Patient Selection in an Era of Donor
Liver Shortage: US Policy: Sidebar: MELD and PELD Equations for Disease Severity
http://www.medscape.com/viewarticle/497528_3
Pre-MELD/PELD Liver Allocation Policy Criteria
Sickest First and Waiting Time
Liver allocation was initially based on a patient's level of care. Patients requiring continuous care in the
intensive care unit (ICU) -- including patients with acute esophageal variceal bleeding not responding to
endoscopic therapy, patients who developed hepatorenal syndrome, and patients with intractable ascites or
portosystemic encephalopathy -- received first priority. Patients requiring continuous hospitalization were
the next priority for allocation, followed by patients cared for at home. As the waiting list grew, however,
waiting time became the major factor in determining who received a donor liver. This allocation system
led to the establishment of many makeshift ICUs specifically for patients waiting for liver transplantation,
and many patients were added to the waiting list years before they actually needed a liver transplant, so
Copyright © 2009 Raymond R. Arons, Teaneck, NJ, USA](https://image.slidesharecdn.com/sta9000-12863759916745-phpapp01/85/Sta9000-178-320.jpg)
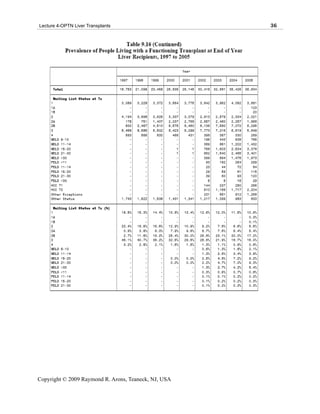
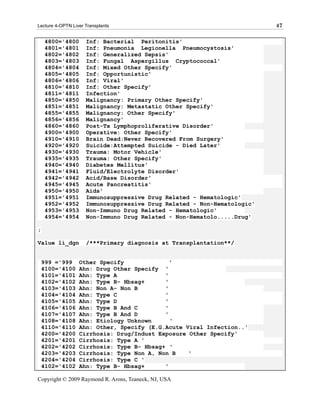
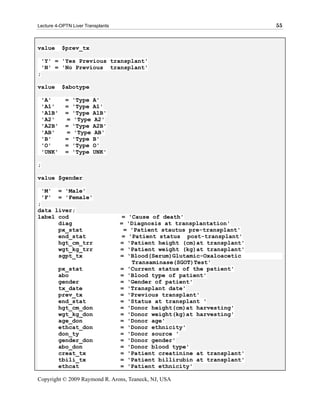
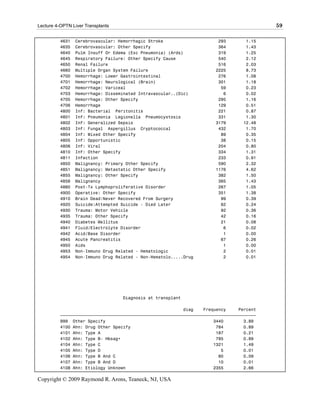
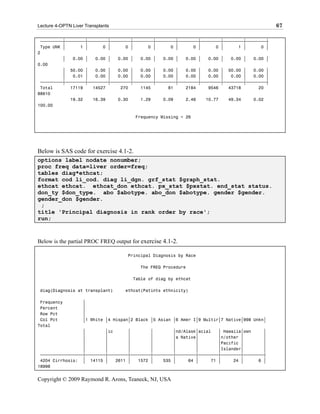
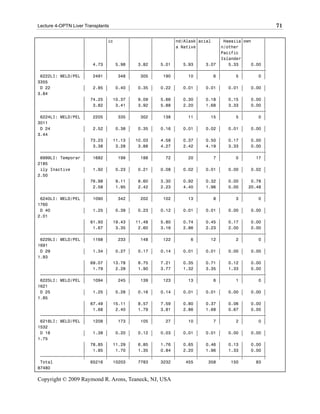
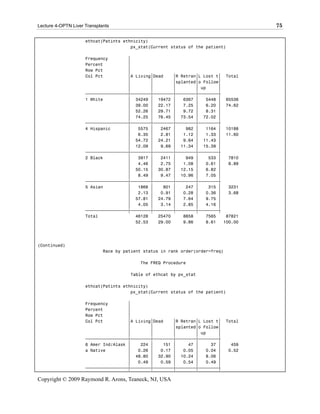
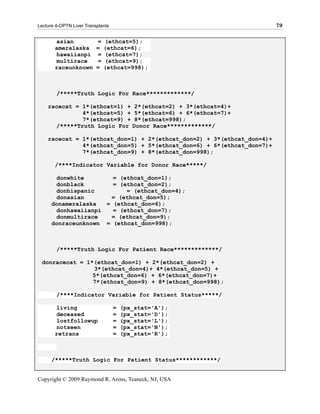
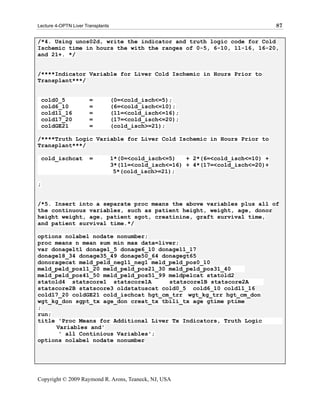
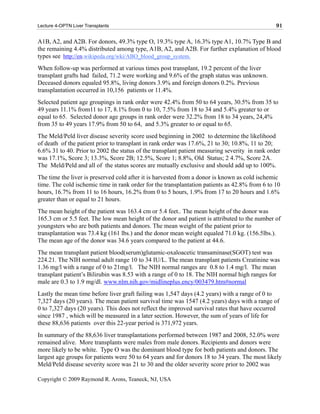
![Lecture 4-OPTN Liver Transplants 44
they would be at the top of the list by the time they required a transplant. This led to numerous turned
down offers for deceased donor livers
OPTN/UNOS Public Use Data Variables
px_stat_date = 'Date patient graft status was
identified'
grf_stat = 'Status of liver graft'
age = ‘Patient age at transplant'
diag = 'Diagnosis at transplant'
cold_isch = 'Duration of cold ischemia-
preserved donor liver’
gtime = 'Graph survival time in days'
ptime = 'Patient survival time in days'
continued...
The Child-Turcotte-Pugh Scoring System
In 1996, the Child-Turcotte-Pugh (CTP) scoring system was adopted as the measure of liver disease
severity to prioritize liver allocation, and a separate 'Status 1' category was created for patients with
fulminant hepatic failure, primary nonfunction of the liver, hepatic artery thrombosis diagnosed within 7
days of transplantion, or decompensated Wilson's Disease. These candidates were given the highest
priority and this remains unchanged. Patients with chronic liver disease were grouped into three
categories: status 2a (CTP ≥ 10, admission to the ICU, and estimated <7 days to survive); status 2b (CTP
≥ 10 or a CTP ≥ 7 in patients with one or more major complications of portal hypertension, and patients
with stage 1 and 2 hepatocellular carcinoma [HCC]); and status 3 (CTP score of ≥ 7), the minimal listing
criteria. The CTP score was considered a shortcoming of the overall allocation system because it was
never evaluated for the prediction of mortality over time in patients with chronic liver disease.
Furthermore, the CTP score had two variables that were subjective in nature, namely ascites and
encephalopathy, which could easily be overestimated. Ultimately, the CTP score failed to prioritize
numerous patients waiting for deceased donor livers on the basis of disease severity.
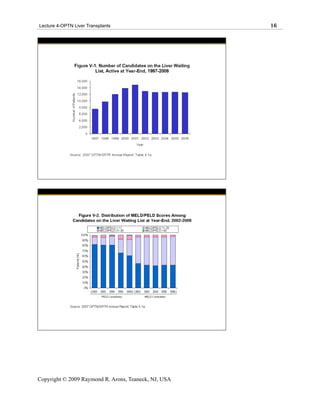
Waiting Time
In 2000, the waiting list for liver transplantation grew to 20,000 patients, leading to longer waiting times
and more patient deaths on the waiting list. Waiting time became the dominant factor for determining
deceased donor liver allocation. This became less acceptable when two studies documented that time
spent on the waiting list was not associated with an increased death rate. Waiting time was also perceived
Copyright © 2009 Raymond R. Arons, Teaneck, NJ, USA](https://image.slidesharecdn.com/sta9000-12863759916745-phpapp01/85/Sta9000-179-320.jpg)
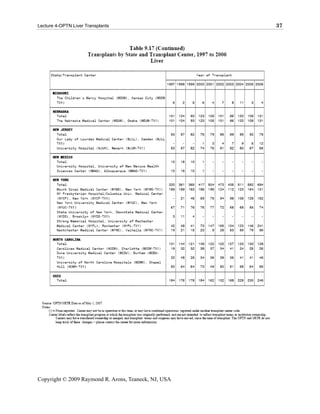
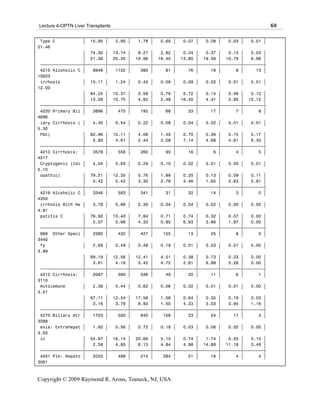
![Lecture 4-OPTN Liver Transplants 45
as a shortcoming of the allocation system,[6] because it did not reflect the medical need for liver
transplantation and was used arbitrarily to determine who received a donor organ. Ultimately waiting time
also contributed to the failure of the allocation system because it did not prioritize patients waiting for
deceased donor livers.
Russell H Wiesner, Mayo Clinic Transplant Center, Rochester, MN Patient Selection in an Era of Donor
Liver Shortage: US Policy: Pre-MELD/PELD Liver Allocation Policy Criteria.
http://www.medscape.com/viewarticle/497528_8
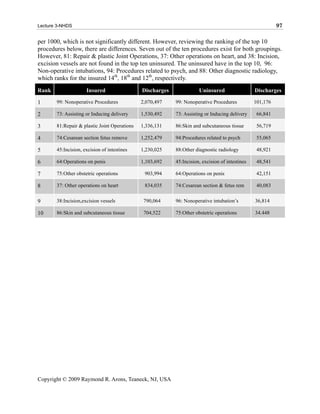
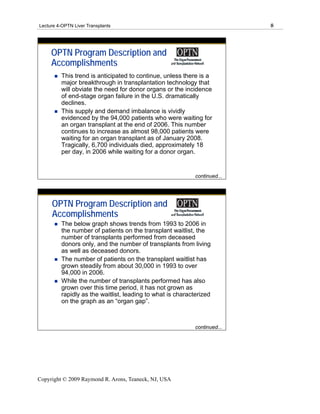
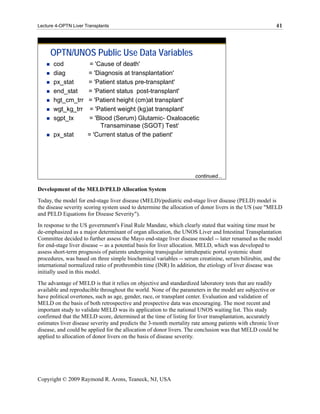
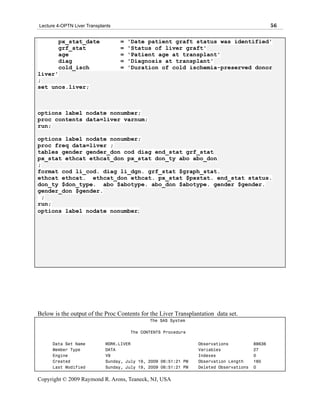
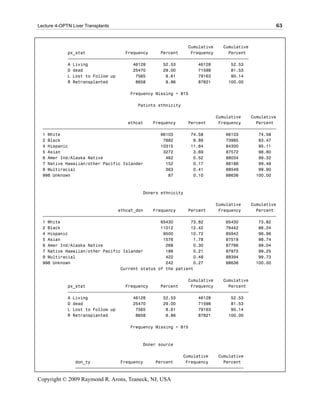
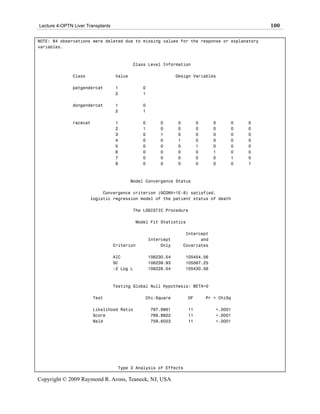
Example Analysis of Liver Transplant Data
What are the predictors of surviving a liver
transplantation considering the effects of gender, race,
age, blood type, status pre-transplant, principal
diagnosis and donor type?
All else being equal, have the odds of receiving a liver
transplant improved between blacks and whites?
How does the MELD/PELD scoring system affect the
likelihood of surviving a liver transplant when principal
diagnosis categories and other clinical and demographic
factors are considered?
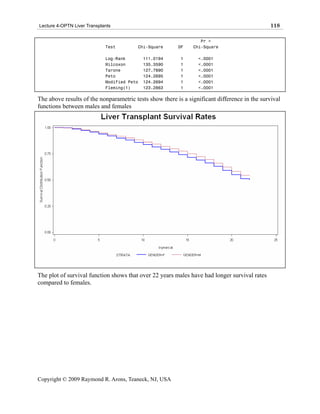
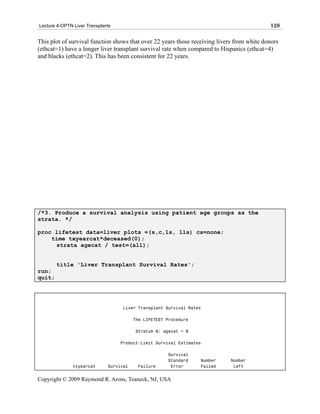
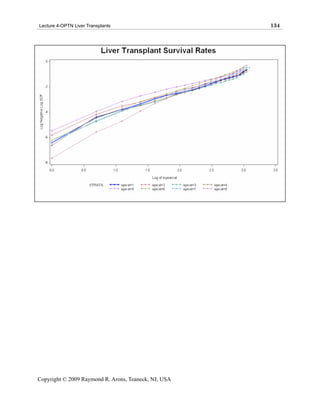
How do liver transplant survival rates vary across
clinical and demographic effects?
Copyright © 2009 Raymond R. Arons, Teaneck, NJ, USA](https://image.slidesharecdn.com/sta9000-12863759916745-phpapp01/85/Sta9000-180-320.jpg)
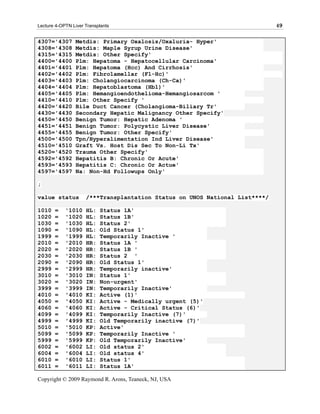
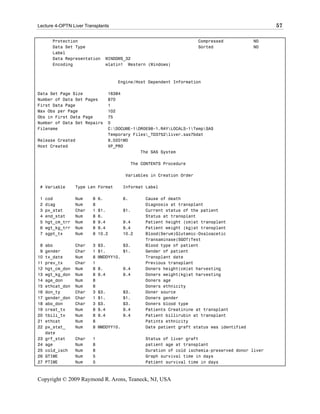
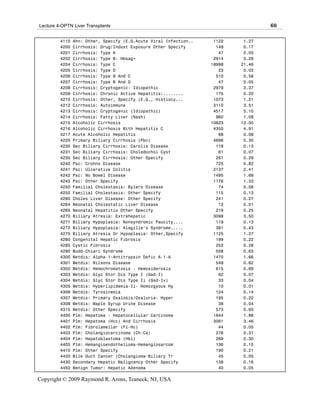
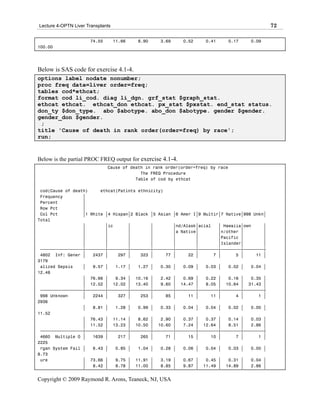
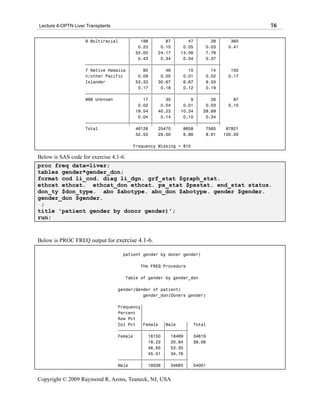
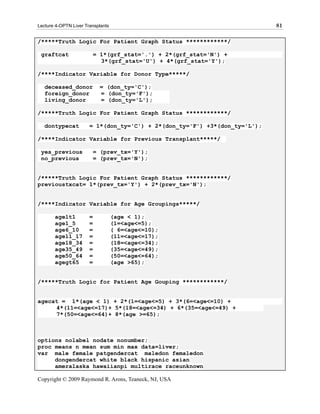
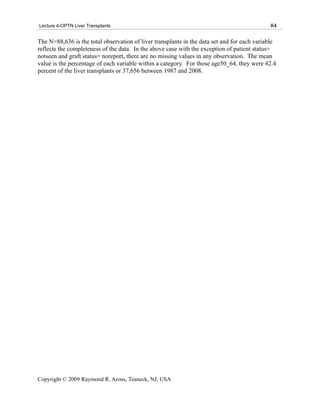
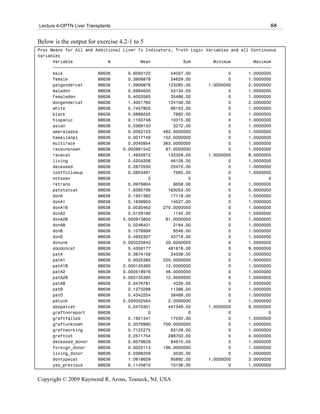
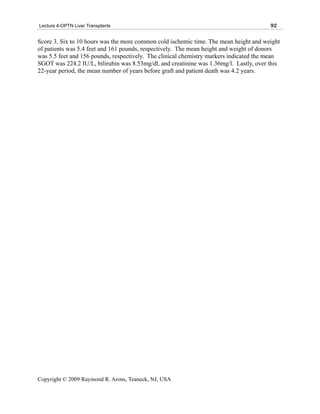
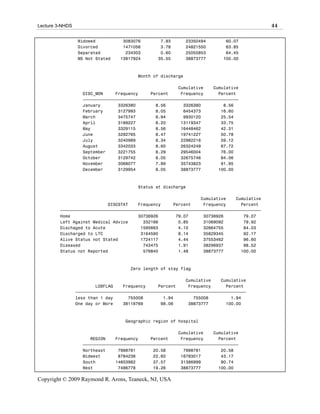
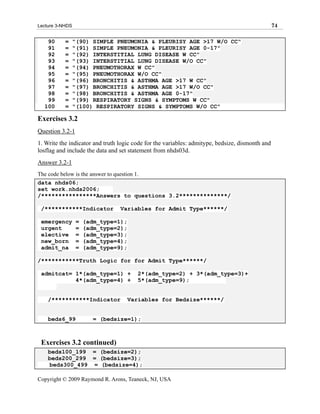
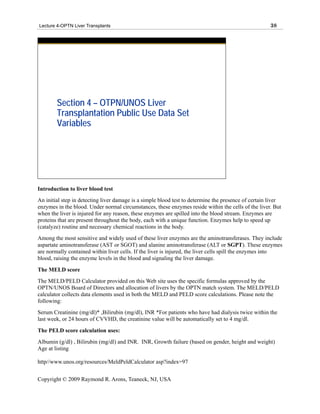
![Lecture 4-OPTN Liver Transplants 102
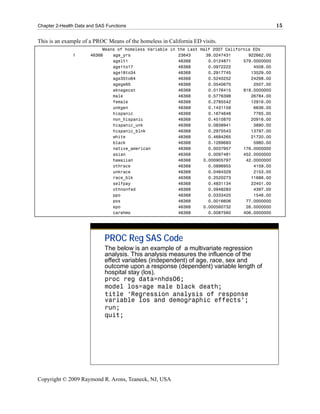
Odds Ratios
Effect Unit Estimate
AGE 10.0000 1.122
AGE_DON 10.0000 0.998
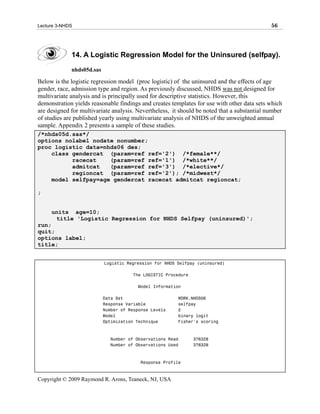
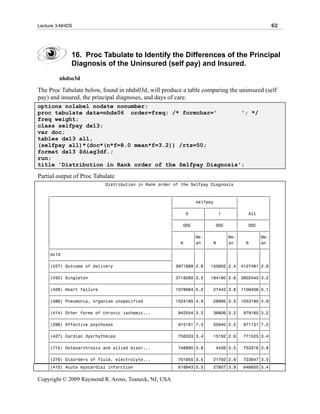
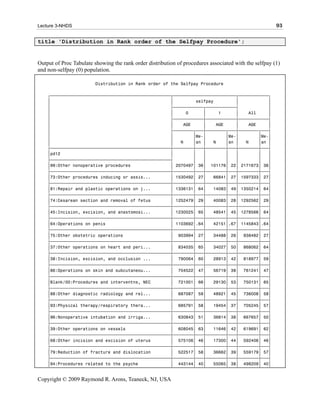
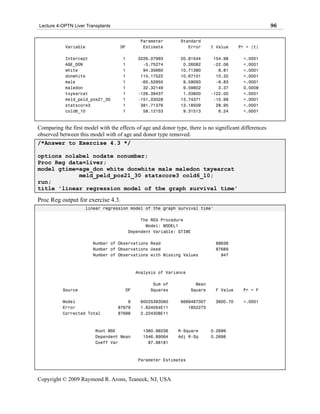
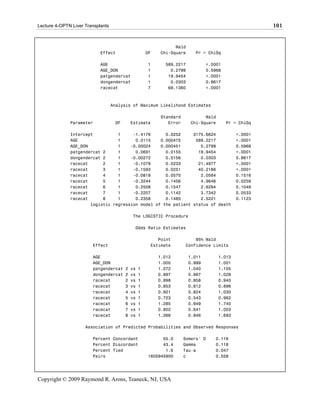
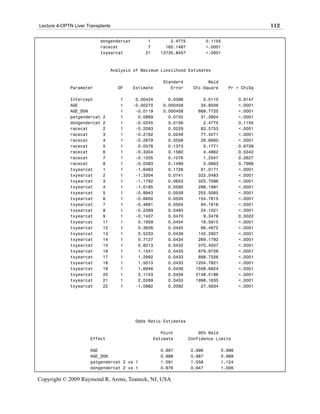
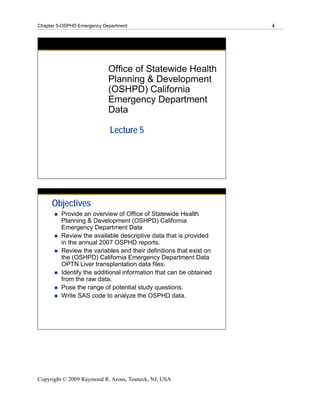
As seen above in the proc logistic output of death after transplant considering the effects of
patient age, donor age and gender, and patient race, the findings are as follows:
1. All else being equal, for every additional year of age at transplant the likelihood of death
increases by 1.2 percent, p<.0001[CI 1.011, 1.0131].
2. All else being equal, donor age does not have a significant effect upon patient death after
transplant., p=.5968[CI 0.999 , 1.0011].
3. All else being equal, females compared to males are 7.2 percent more likely to die after
transplant, p<.0001[CI 1.040, 1.1050].
4. All else being equal, donor gender does not have a significant effect upon patient death after
transplant., p=.8617[CI 0.967, 1.0280].
5. All else being equal, blacks compared to white are 10.2 less likely to die after transplant,
p<.0001[CI 0.858, 0.940].
6. All else being equal, Hispanics compared to whites are 13.7 less likely to die after transplant,
p<.0001[CI 0.812, 0.896].
Copyright © 2009 Raymond R. Arons, Teaneck, NJ, USA](https://image.slidesharecdn.com/sta9000-12863759916745-phpapp01/85/Sta9000-237-320.jpg)
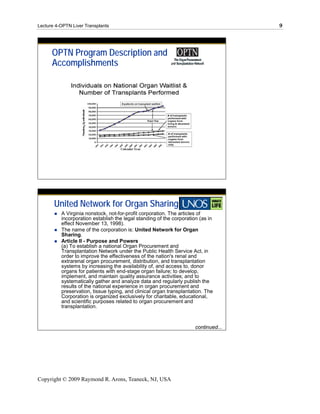
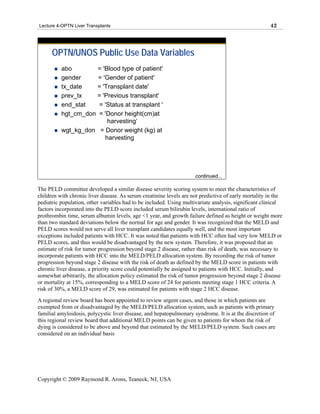
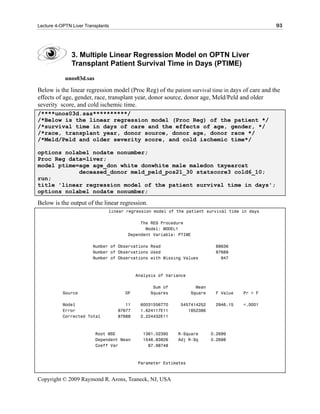
![Lecture 4-OPTN Liver Transplants 108
Effect Unit Estimate
AGE 10.0000 1.187
AGE_DON 10.0000 1.070
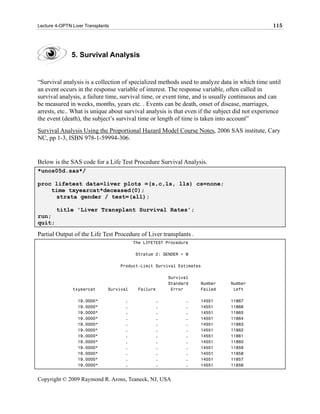
As seen above in the proc logistic output of death after transplant considering the effects of
patient age, donor age and gender, patient race and year of transplant , the findings are as
follows:
1. All else being equal, for every additional year of age at transplant the likelihood of death
increases by 1.7 percent, p<.0001[CI 1.016, 1.0181].
2. All else being equal, for every year of the age of the donor at transplant the likelihood of
death increases by 0.7 percent, p<.0001[CI 1.016, 1.0181].
3. All else being equal, both patient and donor gender are insignificant effects upon those likely
to die after transplant,.
4. All else being equal, blacks compared to whites are 7.2 percent more likely to die after
transplant, p<.0.01[CI 1.022, 1.124].
5. All else being equal, Hispanics compared to whites are 7.9 percent more likely to die after
transplant, p<.0.01[CI 1.025, 1.136].
6. All else being equal, patients transplanted in 1989 compared to 1996 were twice (2.020) as
likely to die after transplant, p<.0.0001[CI 1.814, 2.249].
7. All else being equal, patients transplanted in 2006 compared to 1996 were 87.1 percent less
likely to die after transplant, p<.0.0001[CI 0.208, 0.253].
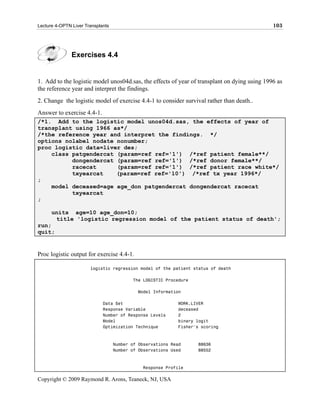
Answer to exercise 4.4-2.
/*2. Change the logistic model of exercise 4.4-1 to consider survival
rather than death*/
/*options nolabel nodate nonumber; */
Copyright © 2009 Raymond R. Arons, Teaneck, NJ, USA](https://image.slidesharecdn.com/sta9000-12863759916745-phpapp01/85/Sta9000-243-320.jpg)
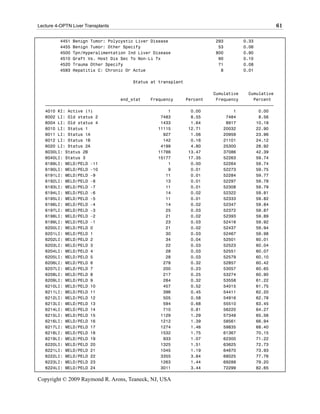
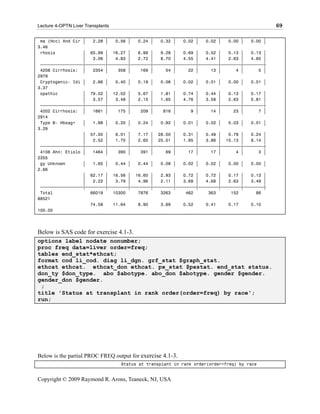
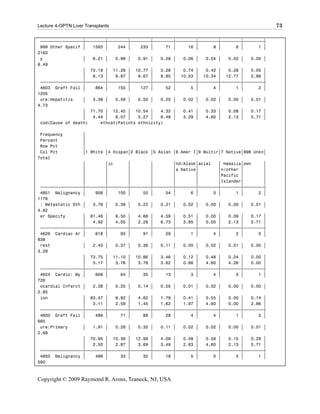
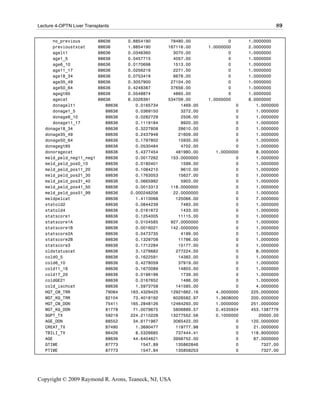
![Lecture 4-OPTN Liver Transplants 113
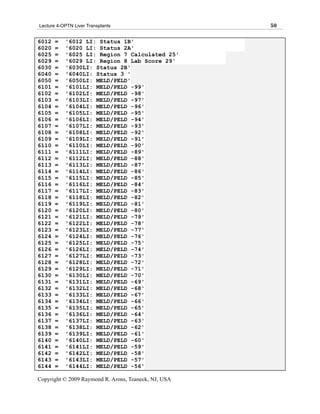
racecat 2 vs 1 0.811 0.776 0.848
racecat 3 vs 1 0.806 0.768 0.845
racecat 4 vs 1 0.750 0.672 0.836
racecat 5 vs 1 1.059 0.810 1.386
racecat 6 vs 1 0.719 0.529 0.976
racecat 7 vs 1 0.886 0.718 1.095
racecat 8 vs 1 0.962 0.719 1.289
txyearcat 1 vs 10 0.193 0.137 0.270
txyearcat 2 vs 10 0.264 0.229 0.306
txyearcat 3 vs 10 0.308 0.271 0.350
txyearcat 4 vs 10 0.361 0.322 0.405
txyearcat 5 vs 10 0.409 0.366 0.456
txyearcat 6 vs 10 0.514 0.463 0.571
txyearcat 7 vs 10 0.613 0.556 0.677
txyearcat 8 vs 10 0.789 0.718 0.867
txyearcat 9 vs 10 0.866 0.790 0.950
txyearcat 11 vs 10 1.216 1.113 1.330
txyearcat 12 vs 10 1.437 1.317 1.568
txyearcat 13 vs 10 1.688 1.549 1.839
txyearcat 14 vs 10 2.040 1.873 2.221
txyearcat 15 vs 10 2.296 2.110 2.499
txyearcat 16 vs 10 3.108 2.854 3.385
txyearcat 17 vs 10 3.666 3.368 3.991
txyearcat 18 vs 10 4.488 4.123 4.885
txyearcat 19 vs 10 5.445 4.998 5.931
txyearcat 20 vs 10 8.292 7.583 9.068
txyearcat 21 vs 10 7.590 6.945 8.296
txyearcat 22 vs 10 0.333 0.221 0.502
Association of Predicted Probabilities and Observed Responses
Percent Concordant 74.4 Somers' D 0.490
Percent Discordant 25.4 Gamma 0.492
Percent Tied 0.2 Tau-a 0.245
Pairs 1957062687 c 0.745
Odds Ratios
Effect Unit Estimate
AGE 10.0000 0.973
AGE_DON 10.0000 0.888
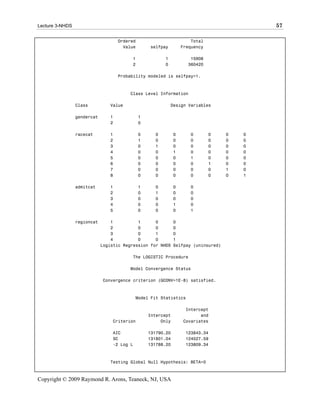
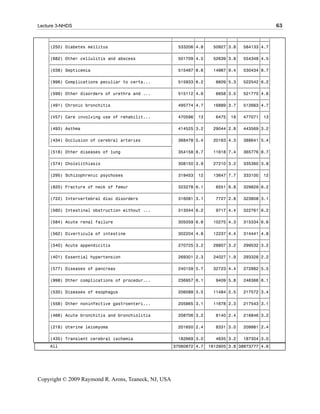
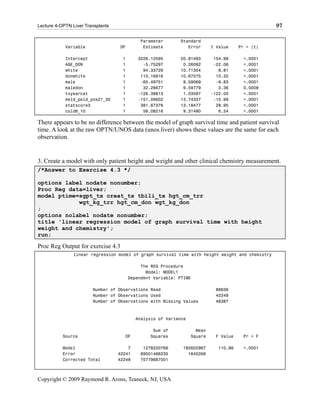
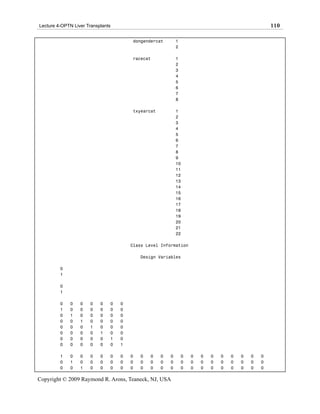
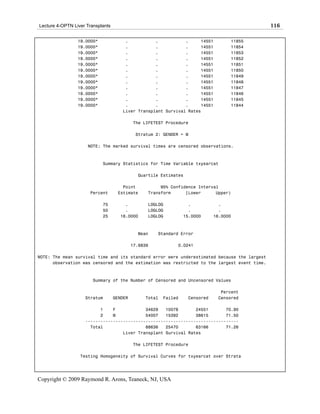
As seen above in the proc logistic output of living after transplant considering the effects of
patient age, donor age and gender, patient race and year of transplant , the findings are as
follows:
1. All else being equal, each additional year in patient age at transplantation, the likelihood of
surviving decreases by 0.3 percent. p<.0001[CI 0.996, 0.998]
2. All else being equal, for each year increase in donor age at transplantation, the patient’s
likelihood of being alive decreases by 0.2 percent. p<.0001[CI 0.987, 0.989]
Copyright © 2009 Raymond R. Arons, Teaneck, NJ, USA](https://image.slidesharecdn.com/sta9000-12863759916745-phpapp01/85/Sta9000-248-320.jpg)
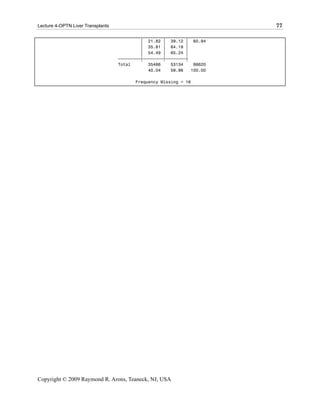
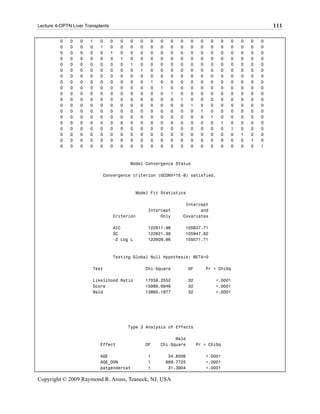
![Lecture 4-OPTN Liver Transplants 114
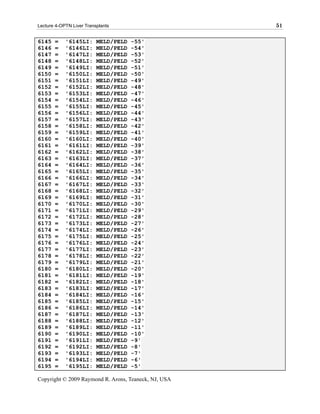
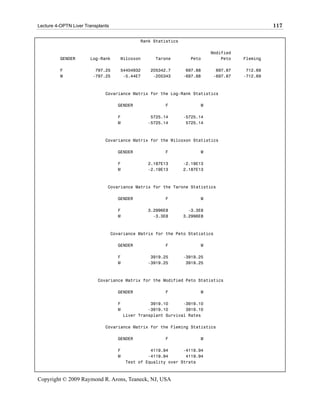
3. All else being equal, female patients compared to males are 9.1 percent more likely of
surviving after transplant. p<.0.001[CI 1.058, 1.1240]
4. All else being equal, patients having female donor compared to male donor has no significant
effect upon survival after transplant.
5. All else being equal, blacks compared to whites are 18.9 percent less likely to survive after
transplant p<.0.001[CI 0.776, 0.848]
6. All else being equal, Hispanics compared to whites are 19.1 percent less likely to survive
after transplant. p<.0.001[CI0.768, 0.845]
7. All else being equal, patients transplanted in the year 1989 compared to 1996 were 69.2
percent less likely to survive. p<.0.0001[CI 0.271, 0.350
8. All else being equal, patients transplanted in 2000 compared to 1996 were twice as likely to
survive. p<.0.0001[CI 1.873, 2.221]
Copyright © 2009 Raymond R. Arons, Teaneck, NJ, USA](https://image.slidesharecdn.com/sta9000-12863759916745-phpapp01/85/Sta9000-249-320.jpg)


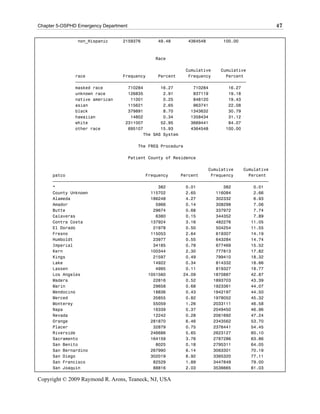
![Chapter 5-OSPHD Emergency Department 34
'034'='(034) Streptococcal sore throat and s...'
'035'='(035) Erysipelas'
'036'='(036) Meningococcal infection'
'037'='(037) Tetanus'
'038'='(038) Septicemia'
'039'='(039) Actinomycotic infections'
'040'='(040) Other bacterial diseases'
'041'='(041) Bacterial infec in conditns cla...'
'042'='(042) Human immunodeficiency virus in...'
'043'='(043) Human immunodeficiency virus in...'
'044'='(044) Other human immunodeficiency vi...'
'045'='(045) Acute poliomyelitis'
'046'='(046) Slow virus infection of central...'
'047'='(047) Meningitis due to enterovirus'
'048'='(048) Other enterovirus diseases of c...'
'049'='(049) Oth non-arthropod-borne viral d...'
'050'='(050) Smallpox'
'051'='(051) Cowpox and paravaccinia'
'052'='(052) Chickenpox'
'053'='(053) Herpes zoster'
'054'='(054) Herpes simplex'
'055'='(055) Measles'
'056'='(056) Rubella'
'057'='(057) Other viral exanthemata'
'060'='(060) Yellow fever'
'061'='(061) Dengue'
'062'='(062) Mosquito-borne viral encephalitis'
'063'='(063) Tick-borne viral encephalitis'
'064'='(064) Viral encephalitis transmitted ...'
'065'='(065) Arthropod-borne hemorrhagic fever'
'066'='(066) Other arthropod-borne viral dis...'
'070'='(070) Viral hepatitis'
'071'='(071) Rabies'
'072'='(072) Mumps'
'073'='(073) Ornithosis'
'074'='(074) Specific diseases due to Coxsac...'
'075'='(075) Infectious mononucleosis'
'076'='(076) Trachoma'
'077'='(077) Other diseases of conjunctiva d...'
'078'='(078) Other diseases due to viruses a...'
'079'='(079) Viral infection in conditns cla...'
'080'='(080) Louse-borne [epidemic] typhus'
'081'='(081) Other typhus'
'082'='(082) Tick-borne rickettsioses'
'083'='(083) Other rickettsioses'
'084'='(084) Malaria'
'085'='(085) Leishmaniasis'
'086'='(086) Trypanosomiasis'
'087'='(087) Relapsing fever'
'088'='(088) Other arthropod-borne diseases'
;
Copyright © 2009 Raymond R. Arons, Teaneck, NJ, USA](https://image.slidesharecdn.com/sta9000-12863759916745-phpapp01/85/Sta9000-303-320.jpg)
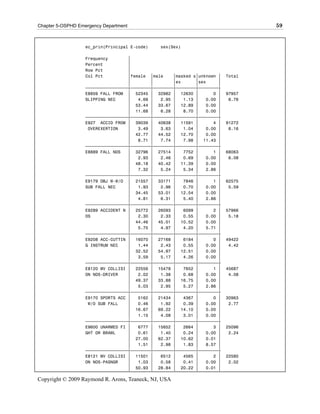
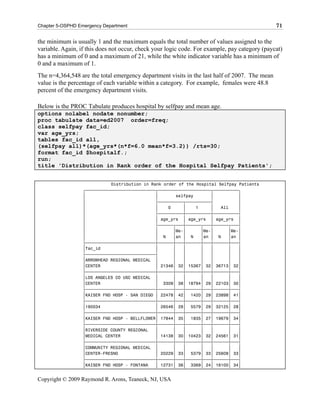
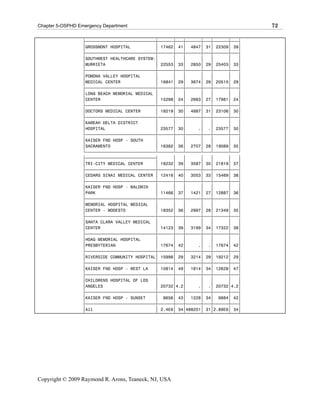
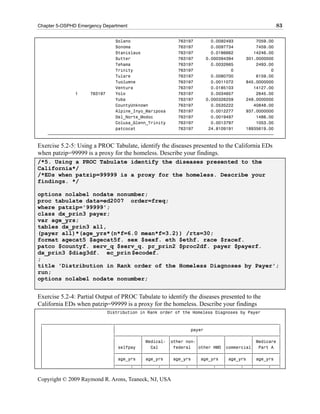
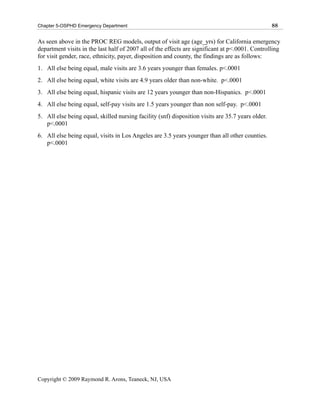
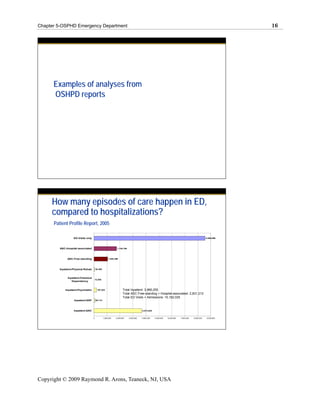
![Chapter 5-OSPHD Emergency Department 97
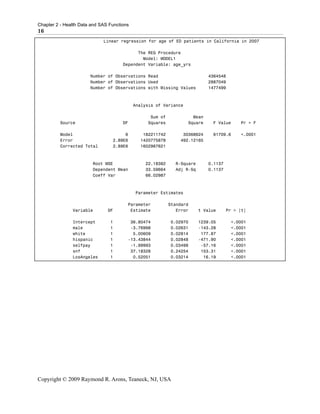
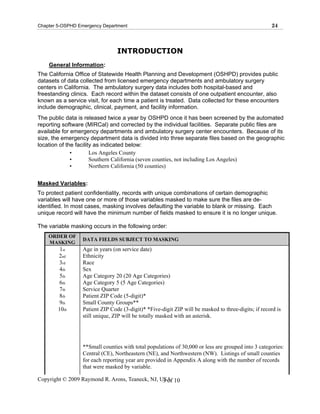
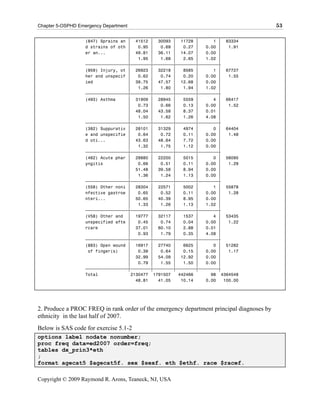
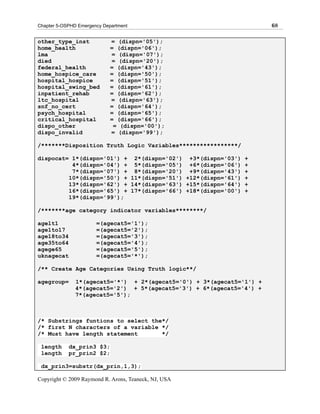
1. All else being equal, those who visit California ED between 18 and 34 years old compared to
those less than 1 year old are 3.9 times more likely to be self pay (uninsured). p<.0001[CI
3.804, 3.934]
2. All else being equal, males compared to females who visit California EDs are1.5 times more
likely to be uninsured. p<.0001[CI 1.576, 1.594]
3. All else being equal, whites compared to blacks who visit California EDs are 21.3 percent
less likely to be uninsured. p<.0001[CI 0.748, 0.828]
4. All else being equal, Hispanics compared to non-Hispanics who visit California EDs are1.5
times more likely to be uninsured. p<.0001[CI 1.502 , 1.523]
The partial SAS code from osphd02d.sas is available to interpret findings.
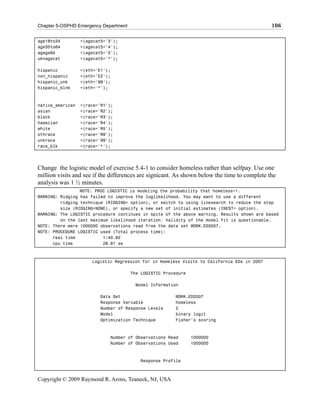
agelt1 =(agecat5='1');
age1to17 =(agecat5='2');
age18to34 =(agecat5='3');
age35to64 =(agecat5='4');
agege65 =(agecat5='5');
uknagecat =(agecat5='*');
native_american =(race='R1');
asian =(race='R2');
black =(race='R3');
hawaiian =(race='R4');
white =(race='R5');
othrace =(race='R9');
unkrace =(race='99');
race_blk =(race='*');
hispanic =(eth='E1');
non_hispanic =(eth='E2');
hispanic_unk =(eth='99');
hispanic_blnk =(eth='*');
Copyright © 2009 Raymond R. Arons, Teaneck, NJ, USA](https://image.slidesharecdn.com/sta9000-12863759916745-phpapp01/85/Sta9000-366-320.jpg)
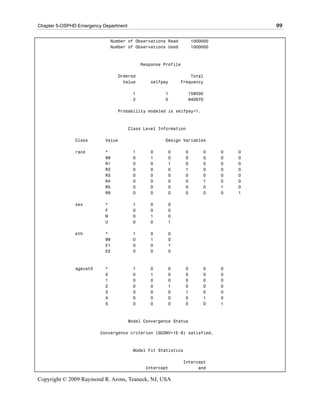
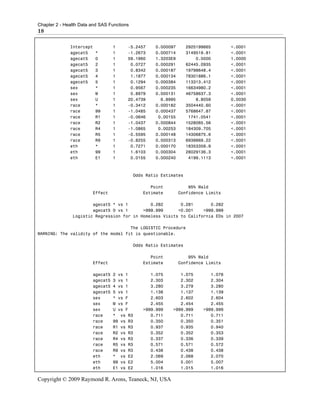
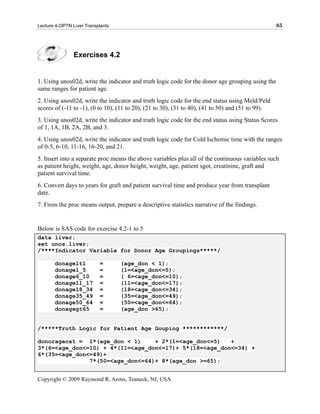
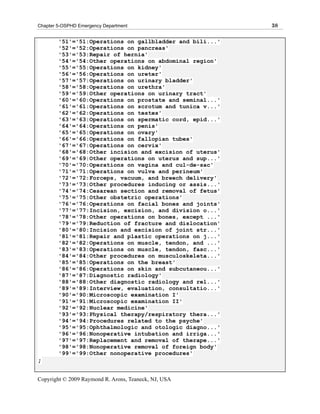
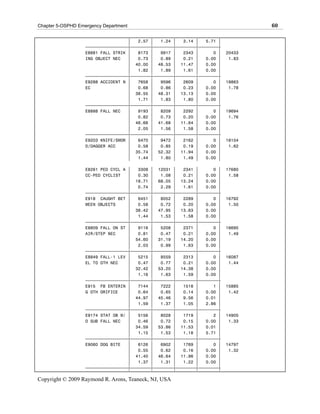
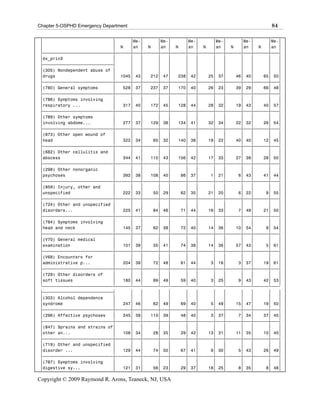
![Chapter 5-OSPHD Emergency Department 101
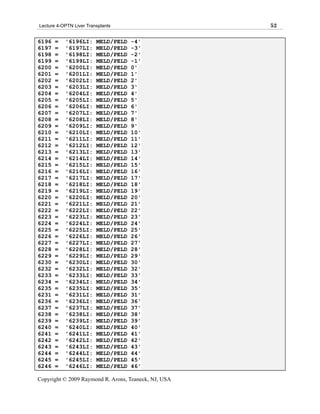
eth 99 1 0.2770 0.0212 171.1656 <.0001
eth E1 1 0.2605 0.00835 974.0387 <.0001
Odds Ratio Estimates
Point 95% Wald
Effect Estimate Confidence Limits
agecat5 * vs 1 3.113 2.959 3.274
agecat5 0 vs 1 1.839 0.418 8.098
agecat5 2 vs 1 1.163 1.116 1.211
agecat5 3 vs 1 5.052 4.857 5.255
agecat5 4 vs 1 2.980 2.865 3.100
agecat5 5 vs 1 0.305 0.288 0.323
sex * vs F 1.465 1.416 1.516
sex M vs F 1.719 1.699 1.739
sex U vs F 2.418 0.820 7.132
race * vs R3 0.742 0.709 0.777
race 99 vs R3 0.633 0.602 0.665
race R1 vs R3 0.820 0.753 0.893
race R2 vs R3 0.522 0.497 0.547
race R4 vs R3 0.847 0.742 0.966
race R5 vs R3 0.778 0.765 0.792
race R9 vs R3 0.712 0.696 0.729
eth * vs E2 1.293 1.247 1.342
eth 99 vs E2 1.319 1.266 1.375
eth E1 vs E2 1.298 1.276 1.319
Association of Predicted Probabilities and Observed Responses
Percent Concordant 68.0 Somers' D 0.390
Percent Discordant 29.0 Gamma 0.402
Percent Tied 2.9 Tau-a 0.104
Pairs 133739459100 c 0.695
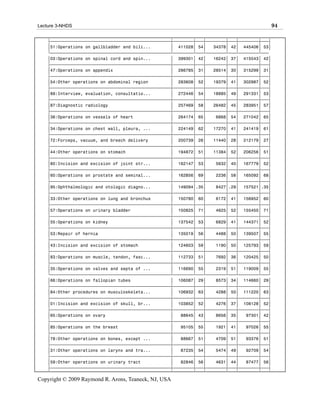
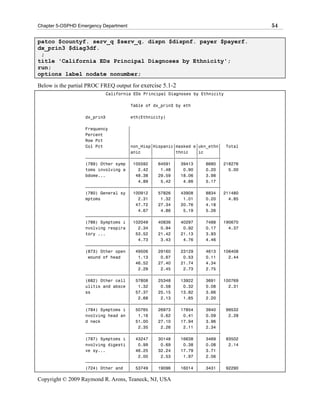
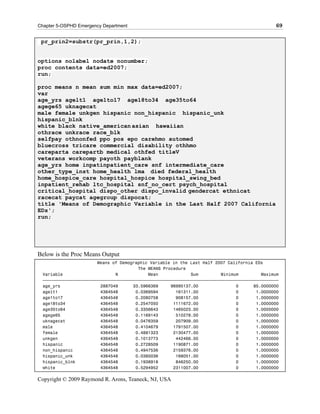
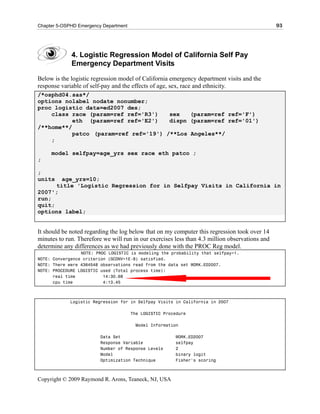
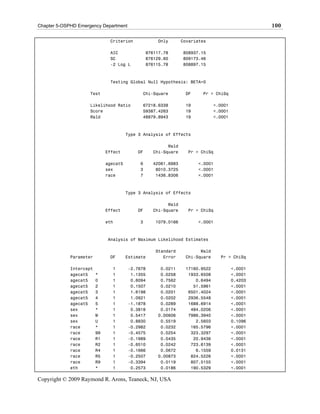
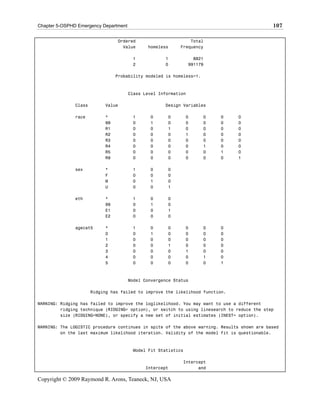
As seen above in the proc logistic with 1 million visits, the output of the response variable of
selfpay, considering the effects of visit age group, gender, race, and ethnicity, the findings are as
follows:
1. All else being equal, those who visit California ED between 18 and 34 years old compared to
those less than 1 year old are 5.0 times more likely to be self pay (uninsured). p<.0001[CI
4.857, 5.255]
2. All else being equal, males compared to females who visit California EDs are1.7 times more
likely to be uninsured. p<.0001[CI 1.699 , 1.739]
3. All else being equal, whites compared to blacks who visit California EDs are 28 percent
less likely to be uninsured. p<.0001[CI 0.753, 0.893]
4. All else being equal, Hispanics compared to non-Hispanics who visit California EDs are1.3
times more likely to be uninsured. p<.0001[CI 1.276, 1.319]
Copyright © 2009 Raymond R. Arons, Teaneck, NJ, USA](https://image.slidesharecdn.com/sta9000-12863759916745-phpapp01/85/Sta9000-370-320.jpg)
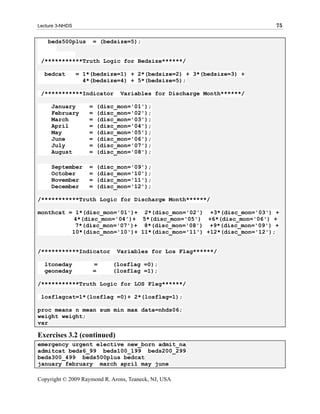
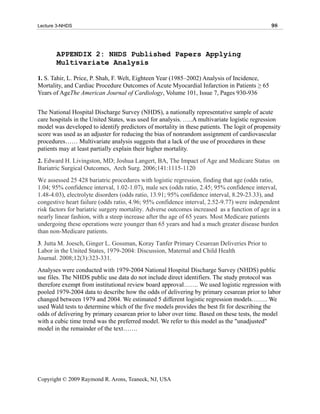
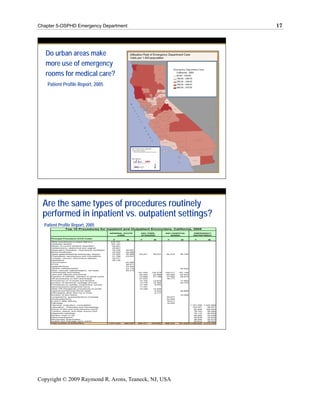
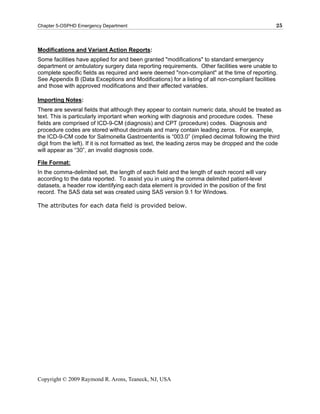
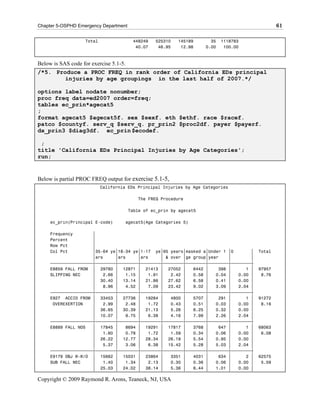
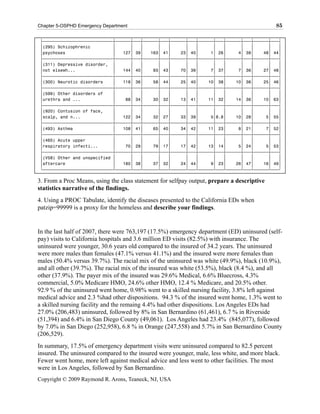
![Chapter 5-OSPHD Emergency Department 105
agecat5 2 vs 1 1.075 1.075 1.076
agecat5 3 vs 1 2.303 2.302 2.304
agecat5 4 vs 1 3.280 3.279 3.280
agecat5 5 vs 1 1.138 1.137 1.139
sex * vs F 2.603 2.602 2.604
sex M vs F 2.455 2.454 2.455
sex U vs F >999.999 >999.999 >999.999
race * vs R3 0.711 0.711 0.711
race 99 vs R3 0.350 0.350 0.351
race R1 vs R3 0.937 0.935 0.940
race R2 vs R3 0.352 0.352 0.353
race R4 vs R3 0.337 0.336 0.339
race R5 vs R3 0.571 0.571 0.572
race R9 vs R3 0.438 0.438 0.438
eth * vs E2 2.069 2.068 2.070
eth 99 vs E2 5.004 5.001 5.007
eth E1 vs E2 1.016 1.015 1.016
Association of Predicted Probabilities and Observed Responses
Percent Concordant 69.1 Somers' D 0.451
Percent Discordant 24.0 Gamma 0.484
Percent Tied 6.9 Tau-a 0.009
Pairs 200225370240 c 0.725
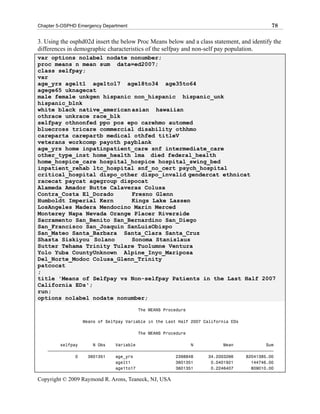
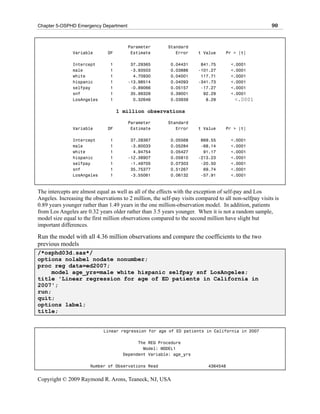
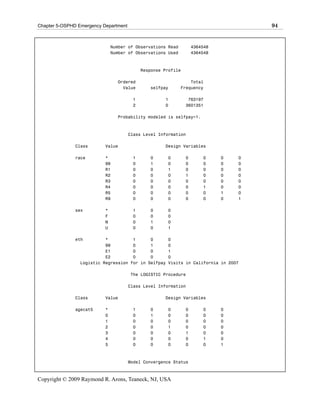
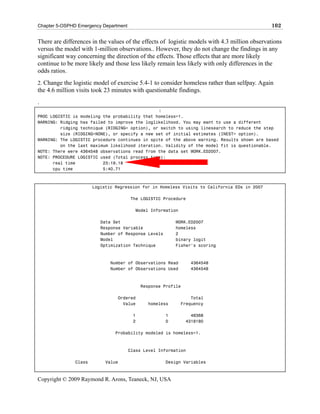
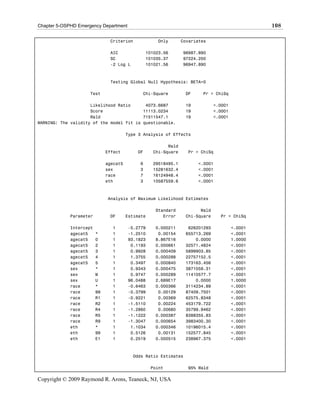
As seen above in the proc logistic with all visits, for the response variable of homeless
considering the effects of visit age group, gender, race, and ethnicity, the findings are as follows:
1. All else being equal, those who visit California ED between 18 and 34 years old compared to
those less than 1 years old are 2.3 times more likely to be homeless. p<.0001[CI 2.302,
2.304]
2. All else being equal, males compared to females who visit California EDs are 2.4 times more
likely to be homeless. p<.0001[CI 2.454, 2.455]
3. All else being equal, whites compared to blacks who visit California EDs are 16.3 percent
less likely to be homeless. p<.0001[CI 0.935, 0.940]
4. All else being equal, Hispanics compared to non-Hispanics who visit California EDs are1.6
percent more likely to be homeless. p<.0001[CI 1.015, 1.016]
agelt1 =(agecat5='1');
age1to17 =(agecat5='2');
Copyright © 2009 Raymond R. Arons, Teaneck, NJ, USA](https://image.slidesharecdn.com/sta9000-12863759916745-phpapp01/85/Sta9000-374-320.jpg)
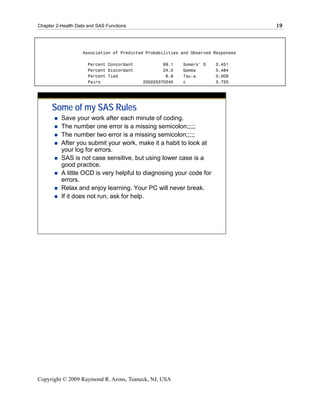
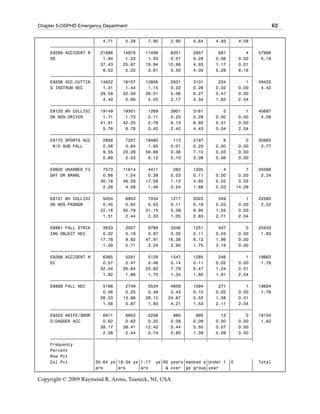
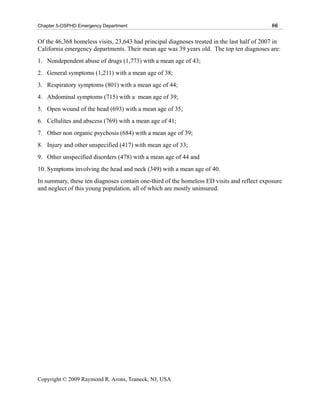
![Chapter 5-OSPHD Emergency Department 109
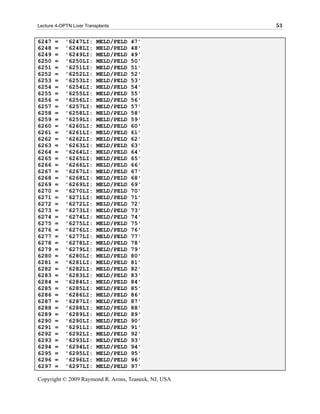
Effect Estimate Confidence Limits
agecat5 * vs 1 0.286 0.285 0.287
agecat5 0 vs 1 >999.999 <0.001 >999.999
WARNING: The validity of the model fit is questionable.
Odds Ratio Estimates
Point 95% Wald
Effect Estimate Confidence Limits
agecat5 2 vs 1 1.127 1.125 1.128
agecat5 3 vs 1 2.699 2.697 2.701
agecat5 4 vs 1 3.957 3.955 3.959
agecat5 5 vs 1 1.419 1.416 1.421
sex * vs F 2.545 2.543 2.548
sex M vs F 2.650 2.649 2.652
sex U vs F >999.999 <0.001 >999.999
race * vs R3 0.524 0.524 0.524
race 99 vs R3 0.684 0.682 0.686
race R1 vs R3 0.398 0.395 0.401
race R2 vs R3 0.221 0.220 0.222
race R4 vs R3 0.276 0.273 0.280
race R5 vs R3 0.326 0.325 0.326
race R9 vs R3 0.271 0.271 0.272
eth * vs E2 3.014 3.012 3.016
eth 99 vs E2 1.670 1.665 1.674
eth E1 vs E2 1.286 1.285 1.288
Association of Predicted Probabilities and Observed Responses
Percent Concordant 72.5 Somers' D 0.510
Percent Discordant 21.6 Gamma 0.542
Percent Tied 5.9 Tau-a 0.009
Pairs 8743189959 c 0.755
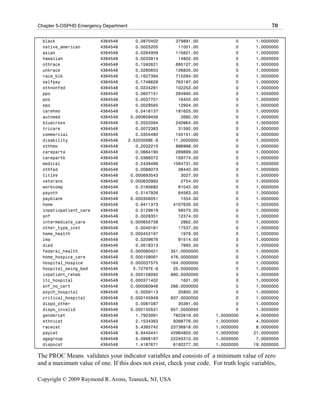
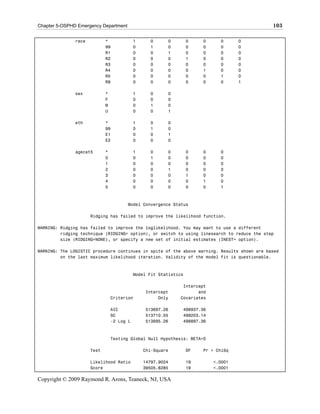
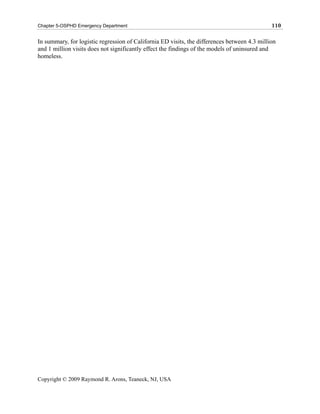
As seen above in the proc logistic with 1 million visits, for the output response variable of
homeless considering the effects of visit age group, gender, race, and ethnicity, the findings are
as follows:
1. All else being equal, those who visit California ED between 18 and 34 years old compared to
those less than 1 years old are 2.7 times more likely to be homeless. p<.0001[CI 2.697,
2.701]
2. All else being equal, males compared to females who visit California EDs are 2.6 times more
likely to be homeless. p<.0001[CI 2.649, 2.652]
3. All else being equal, whites compared to blacks who visit California EDs are 60.2 percent
less likely to be homeless. p<.0001[CI 0.395, 0.401]
4. All else being equal, Hispanics compared to non-Hispanics who visit California EDs are1.3
times more likely to be homeless. p<.0001[CI 1.285, 1.288]
Copyright © 2009 Raymond R. Arons, Teaneck, NJ, USA](https://image.slidesharecdn.com/sta9000-12863759916745-phpapp01/85/Sta9000-378-320.jpg)

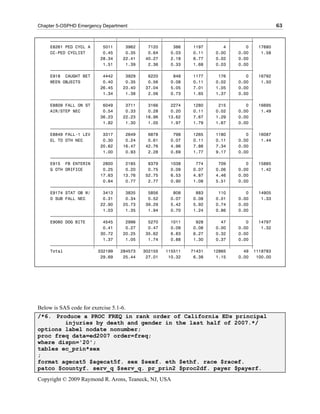
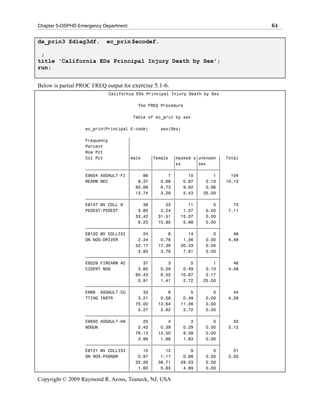
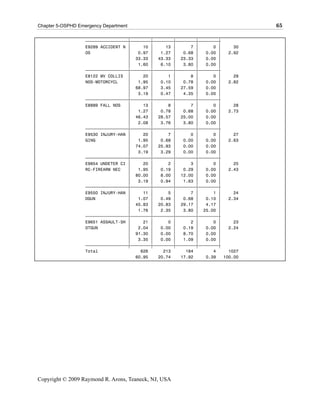
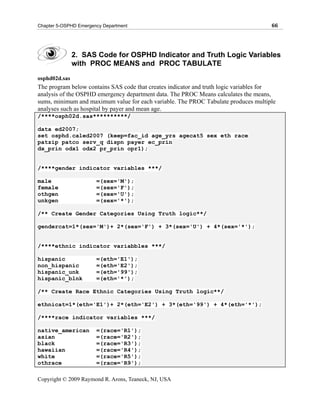
This document discusses health data analysis using SAS. It covers the forms raw data can take, such as magnetic tapes, cartridges, CDs/DVDs, and file transfer over the internet. It also defines key concepts like observations, variables, SAS data sets, and different variable types including character, numeric, continuous, and qualitative variables. Examples are provided to illustrate each variable type.