Download to read offline


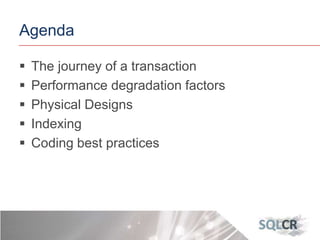

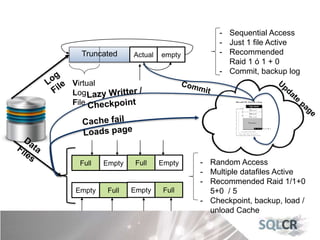

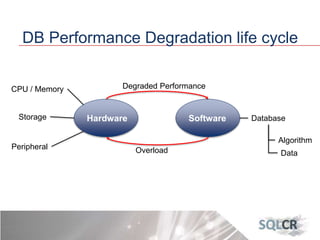


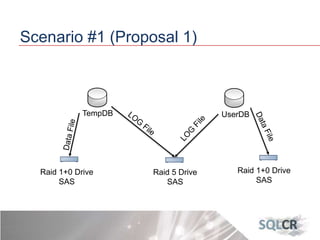
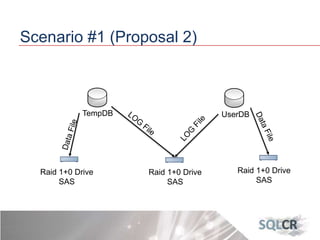
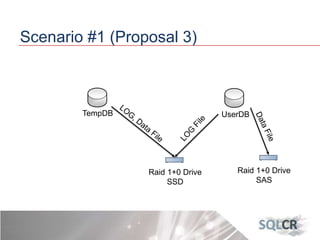
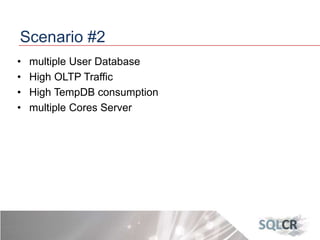
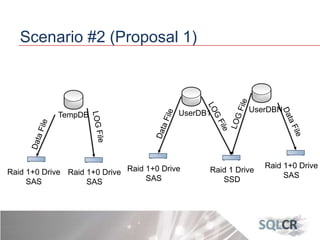

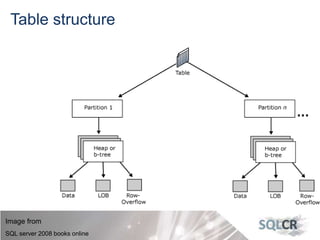
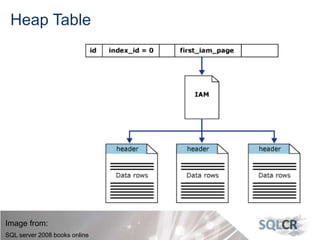
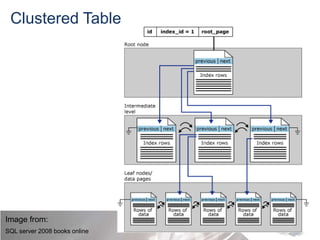


This document discusses strategies for optimizing database performance through physical design and indexing. It begins by describing the journey of a transaction through the database and factors that can degrade performance. Various physical designs are proposed for different scenarios involving storage configuration, database file placement, and raid levels. The document also covers indexing strategies, including the types and organization of indexes, and how they support different data access patterns. Coding best practices are outlined such as maximizing index coverage and avoiding unnecessary sorting.