Download to read offline

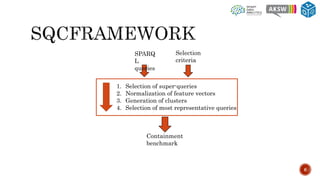
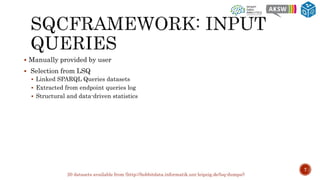
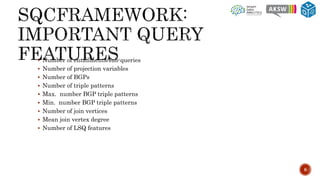
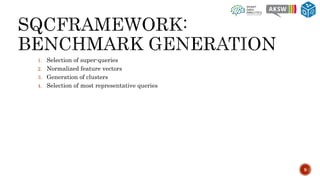
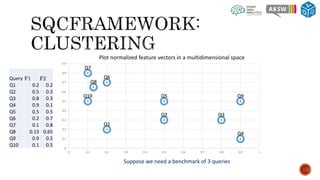
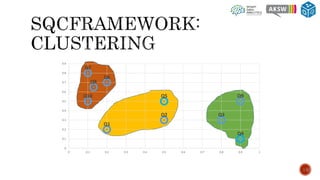
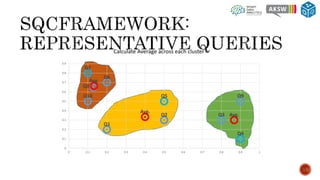
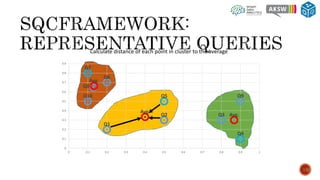
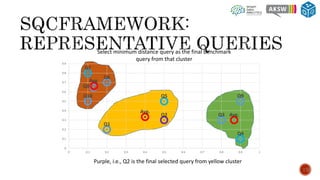
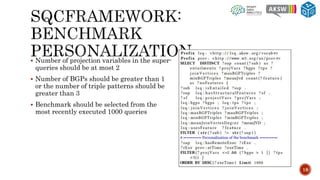
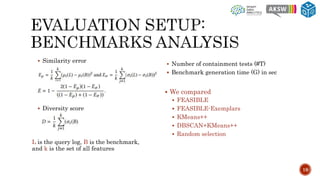
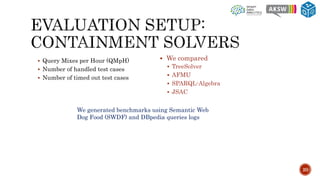
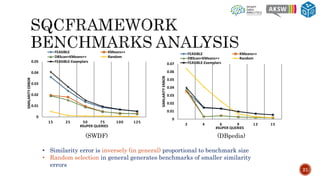
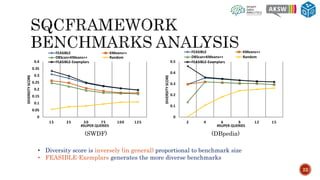
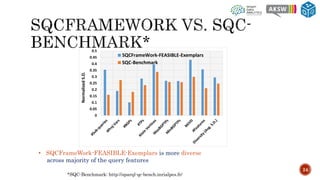
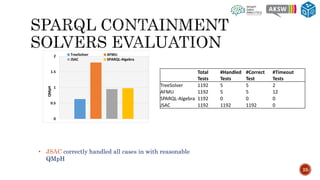
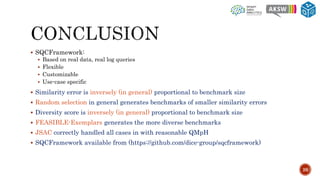

The document describes SQCFramework, a framework for generating customizable SPARQL query containment benchmarks from real query logs. SQCFramework first extracts features from queries, clusters similar queries, and then selects representative queries from each cluster to include in the benchmark. It generates more diverse benchmarks than existing approaches and allows customizing the benchmark based on criteria like the number of queries or specific query features. An evaluation found SQCFramework benchmarks had lower similarity than random benchmarks, and JSAC, an existing containment tool, was able to handle all queries from SQCFramework benchmarks efficiently.


![Polymer [ बहुलक ] Chemistry Notes PDF - Irfanullah Mehar - JJ Sir Chemistry.pdf](https://cdn.slidesharecdn.com/ss_thumbnails/polymerchemistrynotespdf-irfanullahmehar-jjsirchemistry-260210172118-3f9b37f7-thumbnail.jpg?width=640&height=640&fit=bounds)


