INTRODUCTION
MAPS
●
Place data arebest organized, displayed,
and examined on maps.
●
Maps give you the ability to compare
rates of disease by places.
●
Maps efficiently display a wealth of
underlying detail to compare with disease
distribution.
●
Maps allow quick recognition and
comparison relative to tables or other
data display.
3.
CONT...
●
However, on amap, the same data may show
spartial trend or aggregation of higher rates in
one area.
4.
SPOT MAPS
Definition
●
A mapthat indicates the location of each
case of a rare disease or outbreak by a
place that is potentially relevant to the
health event being investigated, such as
where each case lived or worked.
5.
CONT...
●
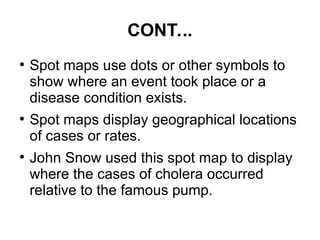
Spot maps usedots or other symbols to
show where an event took place or a
disease condition exists.
●
Spot maps display geographical locations
of cases or rates.
●
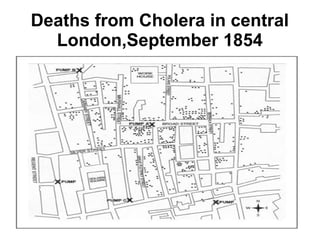
John Snow used this spot map to display
where the cases of cholera occurred
relative to the famous pump.
CONSTRUCTION OF ASPOT MAP
●
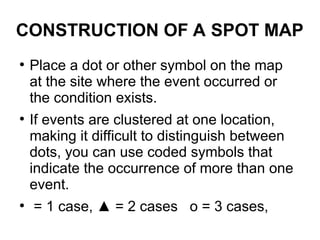
Place a dot or other symbol on the map
at the site where the event occurred or
the condition exists.
●
If events are clustered at one location,
making it difficult to distinguish between
dots, you can use coded symbols that
indicate the occurrence of more than one
event.
●
= 1 case, ▲ = 2 cases o = 3 cases,
9.
USES OF SPOTMAPS
●
for showing the geographic distribution of
an event
●
They can reflect their home address in a
community, their location in a school
room, work place, or hospital setting, or
location of some restuarents , bar,
swimming hole, or other place of social
activity that they visited.
10.
DISADVANTAGES OF SPOT
MAPS
●
Becauseit does not take into
consideration the size of the population
at risk—it does not show the risk of the
event occurring in that particular place,
for example, the risk of a resident
acquiring a particular disease.
●
Even when a spot map shows a large
number of dots in the same area, the risk
of acquiring the disease plotted may not
be great there if that area is densely
populated.