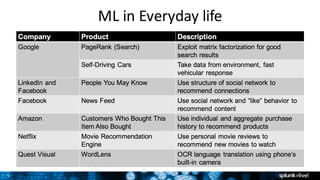
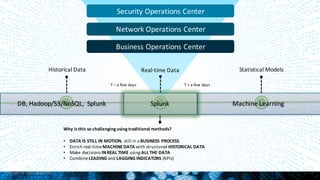
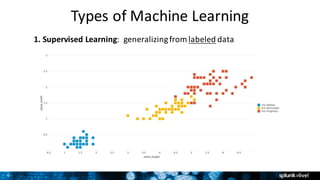
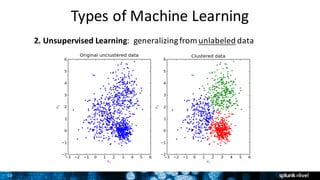
Copyright	©	2016	Splunk	Inc.
Machine	Learning
Andrew	Phillips
Sr.	Sales	Engineer
3
Disclaimer
During	the	course	of	this	presentation,	we	may	make	forward	looking	statements	regarding	future	
events	or	the	expected	performance	of	the	company.	We	caution	you	that	such	statements	reflect	our	
current	expectations	and	estimates	based	on	factors	currently	known	to	us	and	that	actual	events	or	
results	could	differ	materially.	For	important	factors	that	may	cause	actual	results	to	differ	from	those	
contained	in	our	forward-looking	statements,	please	review	our	filings	with	the	SEC.	The	forward-looking	
statements	made	in	the	this	presentation	are	being	made	as	of	the	time	and	date	of	its	live	presentation.	
If	reviewed	after	its	live	presentation,	this	presentation	may	not	contain	current	or	accurate	information.	
We	do	not	assume	any	obligation	to	update	any	forward	looking	statements	we	may	make.	
In	addition,	any	information	about	our	roadmap	outlines	our	general	product	direction	and	is	subject	to	
change	at	any	time	without	notice.	It	is	for	informational	purposes	only	and	shall	not,	be	incorporated	
into	any	contract	or	other	commitment.	Splunk	undertakes	no	obligation	either	to	develop	the	features	
or	functionality	described	or	to	include	any	such	feature	or	functionality	in	a	future	release.
Copyright	©	2016	Splunk	Inc.
Why	do	we	need	ML?
5
ML	in	Everyday	life
Copyright	©	2016	Splunk	Inc.
Historical	Data Real-time	Data Statistical	Models
DB,	Hadoop/S3/NoSQL,	 Splunk Machine	Learning
T	– a	few	days T	+	a	few	days
Why	is	this	so	challenging	using	traditional	methods?
• DATA	IS	STILL	IN	MOTION,	still	in	a	BUSINESS	PROCESS.	
• Enrich	real-time	MACHINE	DATA	with	structured	HISTORICAL	DATA
• Make	decisions	IN	REAL	TIME using	ALL	THE	DATA
• Combine	LEADING	and	LAGGING	INDICATORS (KPIs)
Splunk
Security	Operations	Center
Network	Operations	Center
Business	Operations	Center
Copyright	©	2016	Splunk	Inc.
What	is	ML?
8
ML	101:		What	is	it?
• Machine	Learning	(ML)	is	a	process	for	generalizing	from	examples
– Examples	=	example	or	“training”	data
– Generalizing	=	building	“statistical	models”	to	capture	correlations
– Process	=	ML	is	never	done,	you	must	keep	validating	&	refitting	models
• Simple	ML	workflow:
– Explore	data
– FIT	models	based	on	data
– APPLY	models	in	production
– Keep	validating	models
“All	models	are	wrong,	but	some	are	useful.”
- George	Box
9
Types	of	Machine	Learning
1.	Supervised Learning:		generalizing	from	labeled data
10
Types	of	Machine	Learning
2.	Unsupervised Learning:		generalizing	from	unlabeled data
11
Types	of	Machine	Learning
3.	Reinforcement	Learning:	generalizing	from	rewards in	time
Leitner System Recommender	systems
Copyright	©	2016	Splunk	Inc.
ML	Use	Cases
13
IT	Ops:	Predictive	Maintenance
1. Get	resource	usage	data	(CPU,	latency,	outage	reports)
2. Explore	data,	and	fit	predictive	models	on	past	/	real-time	data
3. Apply	&	validate	models	until	predictions	are	accurate
4. Forecast	resource	saturation,	demand	&	usage
5. Surface	incidents	to	IT	Ops,	who	INVESTIGATES	&	ACTS
Problem:	Network	outages	and	truck	rolls	cause	big	time	&	money	expense	
Solution:	Build	predictive	model	to	forecast	outage	scenarios,	act	pre-emptively	&	learn
14
Security:	Find	Insider	Threats
Problem:	Security	breaches	cause	big	time	&	money	expense	
Solution:	Build	predictive	model	to	forecast	threat	scenarios,	act	pre-emptively	&	learn
1. Get	security	data	(data	transfers,	authentication,	incidents)
2. Explore	data,	and	fit	predictive	models	on	past	/	real-time	data
3. Apply	&	validate	models	until	predictions	are	accurate
4. Forecast	abnormal	behavior,	risk	scores	&	notable	events
5. Surface	incidents	to	Security	Ops,	who	INVESTIGATES	&	ACTS
15
Business	Analytics:	Predict	Customer	Churn
Problem:	Customer	churn	causes	big	time	&	money	expense	
Solution:	Build	predictive	model	to	forecast	possible	churn,	act	pre-emptively	&	learn
1. Get	customer	data	(set-top	boxes,	web	logs,	transaction	history)
2. Explore	data,	and	fit	predictive	models	on	past	/	real-time	data
3. Apply	&	validate	models	until	predictions	are	accurate
4. Forecast	churn	rate	&	identify	customers	likely	to	churn
5. Surface	results	to	Business	Ops,	who	INVESTIGATES	&	ACTS
16
Summary:	The	ML	Process
Problem:	<Stuff	in	the	world>	causes	big	time	&	money	expense
Solution:	Build	predictive	model	to	forecast	<possible	incidents>,	act	pre-emptively	&	learn
1. Get	all	relevant	data	to	problem	
2. Explore	data,	and	fit	predictive	models	on	past	/	real-time	data
3. Apply	&	validate	models	until	predictions	are	accurate
4. Forecast	KPIs	&	notable	events	associated	to	use	case
5. Surface	incidents	to	X	Ops,	who	INVESTIGATES	&	ACTS	
Operationalize
Copyright	©	2016	Splunk	Inc.
ML	with	Splunk
18
Splunk	built-in	ML	capabilities
kmeans cluster
outliers	/	anomalies /	anomalydetection
predict
19
Machine	Learning	in	Splunk	ITSI
Adaptive	Thresholding:
• Learn	baselines	&	dynamic	thresholds
• Alert	&	act	on	deviations
• Manage	for	1000s	of	KPIs	&	entities
• Stdev/Avg,	Quartile/Median,	Range
Anomaly	Detection:
• Find	“hiccups”	in	expected	patterns
• Catches	deviations	beyond	thresholds
• Uses	Holt-Winters	algorithm
20
Splunk	User	Behavior	Analytics	(UBA)
• ~100%	of	breaches	involve	valid	credentials	(MandiantReport)
• Need	to	understand	normal	&	anomalous	behaviors	for	ALL	users
• UBA	detects	Advanced	Cyberattacks and	Malicious	Insider	Threats
• Lots	of	ML	under	the	hood:
– Behavior	Baselining	&	Modeling
– Anomaly	Detection	(30+	models)
– Advanced	Threat	Detection
• E.g.,	Data	Exfil Threat:
– “Saw	this	strange	login	&	data	transfer
for	user	mpittman at	3am	in	China…”
– Surface	threat	to	SOC	Analysts
21
ML	Toolkit	&	Showcase	– DIY	ML
• Splunk	Supported	framework	for	building	ML	Apps
– Get	it	for	free:	https://splunkbase.splunk.com/app/2890/
• Leverages	Python	for	Scientific	Computing (PSC)	add-
on:
– Get	it	for	free:	refer	to	Splunkbasefor	your	OS	version	
ê https://splunkbase.splunk.com/app/2881/ to	/2884/
– Open-source	Python	data	science	ecosystem
– NumPy,	SciPy,	scitkit-learn,	pandas,	statsmodels
• Showcase	use	cases:	Predict	Hard	Drive	Failure,	Server	
Power	Consumption,	Application	Usage,	Customer	
Churn	&	more
22
Standard	algorithms out	of	the	box:
Clustering: DBSCAN,	KMeans,	Birch,	SpectralClustering
Regression: LinearRegression,	RandomForestRegressor,	ElasticNet,	Ridge,	Lasso
Classification: LogisticRegression,	RandomForestClassifier,	SVM,	Naïve	Bayes	
(GaussianNB,	BernoulliNB)
Transformation: PCA,	KernelPCA,	TFIDF	Vectorizer,	StandardScaler
Text	Analytics: TF-IDF
Feature	Extraction: FieldSelector (e.g.	Univariate,	ANOVA,	K-best,	etc.)
Implement	one	of	300+	algorithms	by	editing	Python	scripts
23
Copyright	©	2016	Splunk	Inc.
Building	ML	Apps
25
Analysts Business	Users
1.	Get	Data	&	Find	Decision-Makers
2
IT	Users
ODBC
SDK
API
DB	Connect
Look-Ups
Ad	Hoc
Search
Monitor
and	Alert
Reports	/
Analyze
Custom
Dashboards
GPS	/
Cellular
Devices Networks Hadoop
Servers Applications Online
Shopping	Carts
Analysts Business	Users
Structured	Data	Sources
CRM ERP HR Billing Product Finance
Data	Warehouse
Clickstreams
26
2.	Explore	Data,	Build	Searches	&	Dashboards
• Start	with	the	Exploratory	Data	Analysis	phase
– “80%	of	data	science	is	sourcing,	cleaning,	and	preparing	the	data”	
– Tip:	leverage	ITSI	KPIs	– lots	of	domain	knowledge
• For	each	data	source,	build	“data	diagnostic”	dashboard
– What’s	interesting?	Throw	up	some	basic	charts.
– What’s	relevant	for	this	use	case?
– Any	anomalies?	Are	thresholds	useful?
• Mix	data	streams	&	compute	aggregates
– Compute	KPIs	&	statistics	w/	stats,	eventstats,	etc.
– Enrich	data	streams	with	useful	structured	data
– stats	count	by	X	Y	– where	X,Y	from	different	sources
– Build	new	KPIs	from	what	you	find
27
3.	Fit,	Apply	&	Validate	Models
• ML	SPL – New	grammar	for	doing	ML	in	Splunk
• fit – fit	models	based	on	training	data
– [training data] | fit LinearRegression costly_KPI
from feature1 feature2 feature3 into my_model
• apply – apply	models	on	testing	and	production	data
– [testing/production data] | apply my_model
• Validate	Your	Model (The	Hard	Part)	
– Why	hard?	Because	statistics	is	hard!	Also:	model	error	≠	real	world	risk.
– Analyze	residuals,	mean-square	error,	goodness	of	fit,	cross-validate,	etc.
– Take	Splunk’s	Analytics	&	Data	Science	Education	course
28
4.	Predict	&	Act	
• Forecast	KPIs	&	predict	notable	events
– When	will	my	system	have	a	critical	error?	
– In	which	service	or	process?
– What’s	the	probable	root	cause?
• How	will	people	act	on	predictions?
– Is	this	a	Sev 1/2/3	event?	Who	responds?
– Deliver	via	Notable	Events	or	dashboard?
– Human	response	or	automated	response?
• How	do	you	improve	the	models?
– Iterate,	add	more	data,	extract	more	features
– Keep	track	of	true/false	positives
Copyright	©	2016	Splunk	Inc.
Demo
Copyright	©	2016	Splunk	Inc.
Next	Steps
31
Getting	started
• Pre-requisite: you	must	be	running	 Splunk	6.4.x
• Download	and	install	the	free	ML	Toolkit	&	Showcase!
– https://splunkbase.splunk.com/app/2890/
– https://splunkbase.splunk.com/app/2881/ to	/2884/
• Speak	to	your	local	SE to	discuss	ways	you	could	use	ML
• Join	our	local	User	Group	– we’ll	be	running	 ML	workshops!
– http://www.meetup.com/splunk-melbourne/	
• Contact	me!	(aphillips@splunk.com)
Copyright	©	2016	Splunk	Inc.
Q&A
Copyright	©	2016	Splunk	Inc.
Thank	You
34
Example	Splunk	SPL	– Churn	Use	Case
|	inputlookup churn.csv
|	sample	partitions=2	seed=1234
|	search	partition_number=0
|	fit	LogisticRegression Churn?	from	"CustServ Calls"	"Day	Mins"	"Eve	Mins"	into	
example_churn_model
|	table	*Churn*
|	`confusionmatrix("Churn?","predicted(Churn?)")`	
|	listmodels
|	summary	example_churn_model
|	deletemodel example_churn_model
|	inputlookup churn.csv
|	sample	partitions=2	seed=1234
|	search	partition_number=1
|	apply	"example_churn_model"
|	inputlookup churn.csv
|	sample	partitions=2	seed=1234
|	search	partition_number=1
|	apply	"example_churn_model"	
|	`confusionmatrix("Churn?","predicted(Churn?)")`	
|	inputlookup churn.csv
|	sample	partitions=2	seed=1234
|	search	partition_number=1
|	apply	"example_churn_model"	
|	`classificationstatistics("Churn?",	"predicted(Churn?)")`
#####	example	training	using	logistic	regression	and	random	forest	classifier	in	combination
|	inputlookup churn.csv
|	sample	partitions=2	seed=1234
|	search	partition_number=0
|	fit	LogisticRegression "Churn?"	from	"CustServ Calls"	"Day	Mins"	"Eve	Mins"	"Int'l	Plan"	"Intl	
Calls"	"Intl	Charge"	"Intl	Mins"	"Night	Charge"	"Night	Mins"	"VMail Plan"	into	"LogReg_churn"
|	table	*Churn*
|	inputlookup churn.csv
|	sample	partitions=2	seed=1234
|	search	partition_number=0
|	fit	RandomForestClassifier "Churn?"	from	"CustServ Calls"	"Day	Mins"	"Eve	Mins"	"Int'l	Plan"	
"Intl	Calls"	"Intl	Charge"	"Intl	Mins"	"Night	Charge"	"Night	Mins"	"VMail Plan"	into	"RF_churn"
|	table	*Churn*
#####	example	testing	using	logistic	regression	and	random	forest	classifier	in	combination
|	inputlookup churn.csv
|	sample	partitions=2	seed=1234
|	search	partition_number=1
|	apply	LogReg_churn as	LogReg(Churn?)	
|	apply	RF_churn as	RF(Churn?)
|	eval priorityscore(Churn?)	=	if('LogReg(Churn?)'="True.",10,0)	+	if('RF(Churn?)'="True.",100,0)	
+	.1*'Day	Charge'
|	sort	- priorityscore(Churn?)
|	fields	priorityscore(Churn?)	*Churn?*	"CustServ Calls"	"Day	Calls"	"Day	Charge"	Phone	State
|	eval whattodo =	if('priorityscore(Churn?)'>15,	"Call	them!",	null())
|	fieldformat "Day	Charge"	=	"$".round('Day	Charge')
|	search	"Churn?"="False."
35
Example	Splunk	SPL	– Malware	Use	Case|	inputlookup firewall_traffic.csv
|	inputlookup firewall_traffic.csv
|	fit	LogisticRegression used_by_malware from	bytes_received bytes_sent dest_port dst_ip
has_known_vulnerability packets_received packets_sent receive_time serial_number
session_id src_ip src_port into	example_firewall_traffic_model
|	table	*used_by_malware*
|	`confusionmatrix("used_by_malware","predicted(used_by_malware)")`
|	listmodels
|	summary	example_firewall_traffic_model
|	deletemodel example_firewall_traffic_model
|	inputlookup firewall_traffic.csv
|	sample	partitions=2	seed=1234
|	search	partition_number=1
|	apply	"example_firewall_traffic_model”
|	inputlookup firewall_traffic.csv
|	sample	partitions=2	seed=1234
|	search	partition_number=1
|	apply	"example_firewall_traffic_model"	
|	`confusionmatrix("used_by_malware","predicted(used_by_malware)")`
|	inputlookup firewall_traffic.csv
|	sample	partitions=2	seed=1234
|	search	partition_number=1
|	apply	"example_firewall_traffic_model"	
|	`classificationstatistics("used_by_malware",	"predicted(used_by_malware)")`
#####	example	training	using	logistic	regression	and	random	forest	classifier	in	combination
|	inputlookup firewall_traffic.csv
|	sample	partitions=2	seed=1234
|	search	partition_number=0
|	fit	LogisticRegression used_by_malware from	bytes_received bytes_sent dest_port dst_ip
has_known_vulnerability packets_received packets_sent receive_time serial_number
session_id src_ip src_port into	LogReg_used_by_malware
|	table	*used_by_malware*
|	`confusionmatrix("used_by_malware","predicted(used_by_malware)")`
|	inputlookup firewall_traffic.csv
|	sample	partitions=2	seed=1234
|	search	partition_number=0
|	fit	RandomForestClassifier used_by_malware from	bytes_received bytes_sent dest_port
dst_ip has_known_vulnerability packets_received packets_sent receive_time serial_number
session_id src_ip src_port into	RF_used_by_malware
|	table	*used_by_malware*
|	`confusionmatrix("used_by_malware","predicted(used_by_malware)")`
#####	example	testing	using	logistic	regression	and	random	forest	classifier	in	combination
|	inputlookup firewall_traffic.csv
|	sample	partitions=2	seed=1234
|	search	partition_number=1
|	apply	LogReg_used_by_malware as	LogReg(used_by_malware)	
|	apply	RF_used_by_malware as	RF(used_by_malware)
|	eval priorityscore(used_by_malware)	=	if('LogReg(used_by_malware)'="yes",10,0)	+	
if('RF(used_by_malware)'="yes",100,0)	+	if(has_known_vulnerability="yes",50,0)
|	eval whattodo =	if('priorityscore(used_by_malware)'>50,	"Investigate!",	null())	
|	fields	whattodo priorityscore(used_by_malware)	*used_by_malware*	receive_time src_ip
serial_number session_id has_known_vulnerability
|	sort	whattodo

SplunkLive Perth Machine Learning & Analytics