Downloaded 27 times


![27
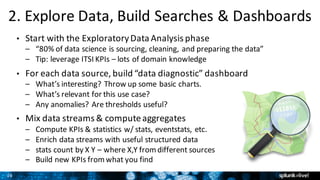
3. Fit, Apply & Validate Models
• ML SPL – New grammar for doing ML in Splunk
• fit – fit models based on training data
– [training data] | fit LinearRegression costly_KPI
from feature1 feature2 feature3 into my_model
• apply – apply models on testing and production data
– [testing/production data] | apply my_model
• Validate Your Model (The Hard Part)
– Why hard? Because statistics is hard! Also: model error ≠ real world risk.
– Analyze residuals, mean-square error, goodness of fit, cross-validate, etc.
– Take Splunk’s Analytics & Data Science Education course](https://image.slidesharecdn.com/splunklivesydneymachinelearning-160804042212/85/SplunkLive-Sydney-Machine-Learning-Analytics-27-320.jpg)


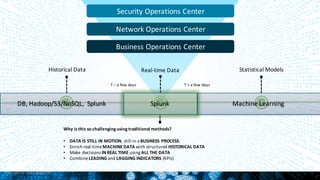
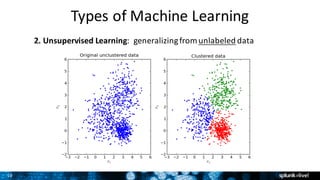
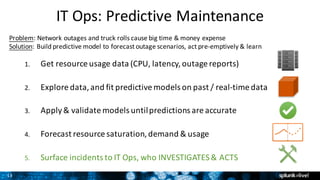
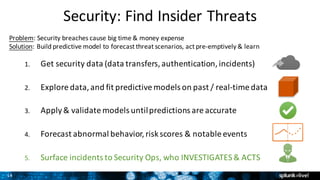
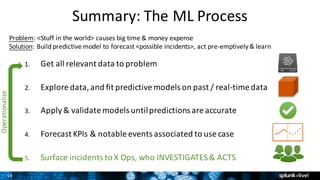
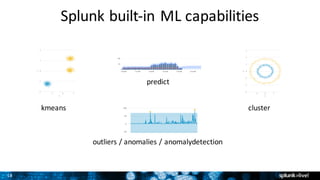
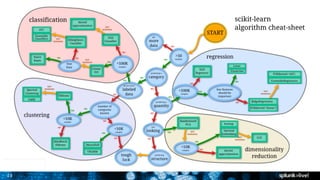
The document discusses the importance of machine learning (ML) in business operations, emphasizing its application to predictive maintenance, security threat detection, and customer churn analysis. It explains ML processes, types, and workflows alongside potential use cases in IT, security, and analytics, while highlighting the capabilities of Splunk's ML tools. The document also provides guidance on getting started, including software installation and exploration of data for fitting predictive models.


![[DSC Europe 25] Mijat Kustudic - Building Financial Intelligence with AI Agen...](https://cdn.slidesharecdn.com/ss_thumbnails/38y2lb5lse6wstegtvas-3-mijat-kustudic-building-financial-intelligence-with-ai-agents-260114111931-1a4783ce-thumbnail.jpg?width=640&height=640&fit=bounds)

![[DSC Europe 25] Ivica Milaric - The Future of Gaming and AI Tools.pptx](https://cdn.slidesharecdn.com/ss_thumbnails/tijgzsmgse2kj2y5pzzp-5-ivica-milaric-the-future-of-gaming-x-ai-tools-260114111931-87c2b3ac-thumbnail.jpg?width=640&height=640&fit=bounds)


![[DSC Europe 25] Slobodan Dolinic - Smart and Intelligent Green Region.pptx](https://cdn.slidesharecdn.com/ss_thumbnails/0bribinjsp6ghwtvsvor-2-sigre-slobodan-dolinic-260115093812-c9c10e90-thumbnail.jpg?width=640&height=640&fit=bounds)


![[DSC Europe 25] Danilo Djukanovic - From Vibes to KPIs: Turning Culture Into ...](https://cdn.slidesharecdn.com/ss_thumbnails/inqestws5wf0cik2glgv-3-danilo-djukanovic-from-vibes-to-kpis-presentation-260114111931-dacff81f-thumbnail.jpg?width=640&height=640&fit=bounds)