


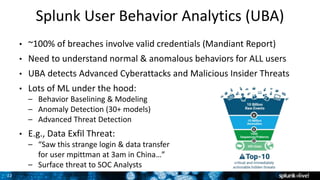

![30
3. Fit, Apply & Validate Models
• ML SPL – New grammar for doing ML in Splunk
• fit – fit models based on training data
– [training data] | fit LinearRegression costly_KPI
from feature1 feature2 feature3 into my_model
• apply – apply models on testing and production data
– [testing/production data] | apply my_model
• Validate Your Model (The Hard Part)
– Why hard? Because statistics is hard! Also: model error ≠ real world risk.
– Analyze residuals, mean-square error, goodness of fit, cross-validate, etc.
– Take Splunk’s Analytics & Data Science Education course](https://image.slidesharecdn.com/splunklivenycjuly2016-operationalizingmachinelearning-160714211807/85/Machine-Learning-Analytics-in-Splunk-26-320.jpg)


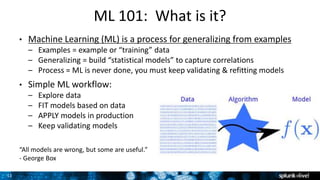
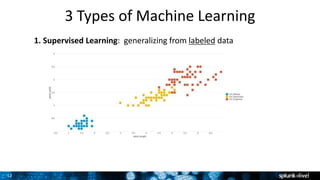
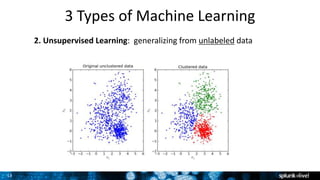
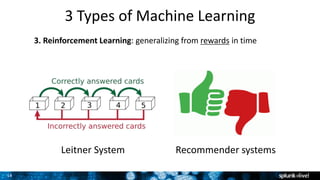
The document outlines Splunk's operationalization of machine learning (ML) and highlights its benefits across IT operations, security, and business analytics. It discusses a variety of ML concepts including supervised, unsupervised, and reinforcement learning, as well as specific use cases such as predictive maintenance, insider threat detection, and customer churn predictions. Lastly, it emphasizes the importance of continuously validating and improving models, while providing resources and tools available for users to implement ML solutions.


