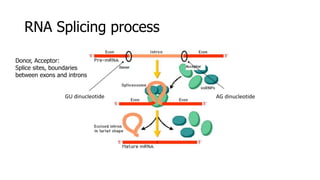
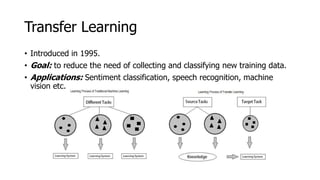
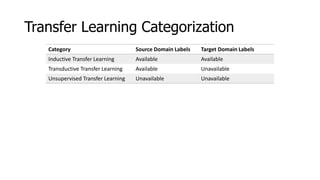
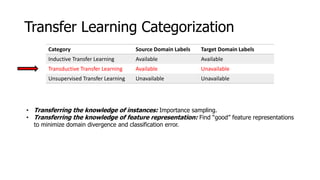
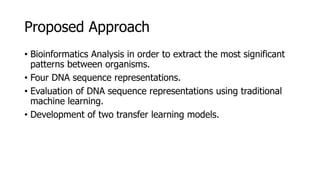
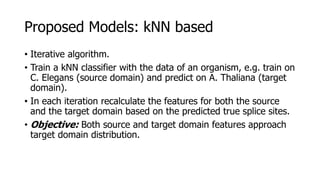
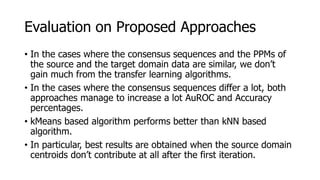
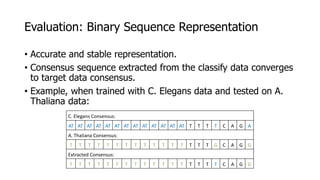
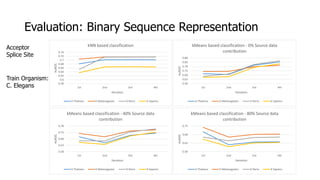
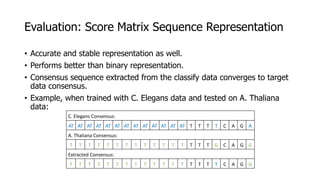
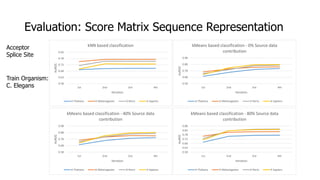
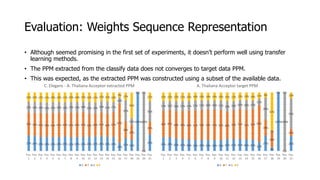
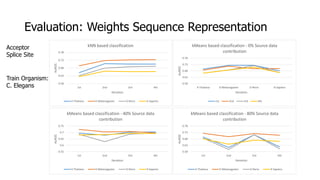
SlideShare a Scribd company logo
INTERDEPARTMENTAL POSTGRADUATE PROGRAM
"INFORMATION TECHNOLOGIES IN MEDICINE AND BIOLOGY"
MASTER THESIS
Splice site recognition among
different organisms
Despoina I. Kalfakakou
Supervisors:
Stavros Perantonis, Research Director, NCSR Demokritos
George Paliouras, Research Director, NCSR Demokritos
Anastasia Krithara, Post-Doctoral Researcher, NCSR Demokritos
Structure
• RNA Splicing
• Motivation
• Transfer Learning
• Proposed Approaches
• Conclusion
Central Dogma of Molecular Biology
RNA Splicing process
snRNPs:
small nuclear
ribonucleoproteins
Spliceosome:
Complex formed from
snRNPs which catalyzes
splicing process
RNA Splicing process
Donor, Acceptor:
Splice sites, boundaries
between exons and introns
GU dinucleotide AG dinucleotide
Importance of Accurate Splice Site Prediction
• Typical mammalian gene has 7-8 exons spread out over ~16 kb.
• Splice site prediction leads to identification of these exons.
• Exon identification is the first step to accurate genome annotation.
• Currently, hundreds of genomes have been annotated, but
thousands more remain unknown.
• Moreover, many of the already annotated genomes are incorrectly
annotated.
Existing Splice Site Prediction Techniques
• Models based on SVMs, HMMS, artificial neural networks.
• Variate DNA sequence representations, most using a large
neighborhood around the donor and acceptor dimers.
• Existing techniques using
traditional machine learning
methods perform well.
~150 nt around dimer
Issues of Existing Methods
• Ab initio splice site prediction is a time and money consuming
process.
• Poorly annotated genomes.
• Lack of labeled data.
• Idea: Transfer knowledge from already annotated genomes of
other organisms.
This kind of knowledge transfer is used every day by biologists during their experiments.
In machine learning it is called transfer learning.
Transfer Learning
• Introduced in 1995.
• Goal: to reduce the need of collecting and classifying new training data.
• Applications: Sentiment classification, speech recognition, machine
vision etc.
Transfer Learning Categorization
Category Source Domain Labels Target Domain Labels
Inductive Transfer Learning Available Available
Transductive Transfer Learning Available Unavailable
Unsupervised Transfer Learning Unavailable Unavailable
Transfer Learning Categorization
Category Source Domain Labels Target Domain Labels
Inductive Transfer Learning Available Available
Transductive Transfer Learning Available Unavailable
Unsupervised Transfer Learning Unavailable Unavailable
• Transferring the knowledge of instances: Importance sampling.
• Transferring the knowledge of feature representation: Find “good” feature representations
to minimize domain divergence and classification error.
Proposed Approach
• Bioinformatics Analysis in order to extract the most significant
patterns between organisms.
• Four DNA sequence representations.
• Evaluation of DNA sequence representations using traditional
machine learning.
• Development of two transfer learning models.
Data – Evaluation methods
A. Thaliana C. Elegans D. Melanogaster D. Rerio H. Sapiens
In each classification experiment:
• Training data 10000 decoy and 5000 true splice sites
• Test data 10000 decoy and 5000 true splice sites
Evaluation Methods: Accuracy, Area Under the Receiver Operating Characteristic curve (auROC)
For the statistical analysis, we used the DNA sequences of the splice sites of each organism’s
complete genome.
PPM and Consensus Calculation
• Features based on bioinformatics analysis of the sequences of
the true splice sites.
• Calculation of Position Probability Matrices (PPMs) and
Consensus sequences for each organism in order to extract
patterns.
• PPM calculation: 𝑀 𝑘,𝑗 =
1
𝑁 𝑖
𝑁
𝐼(𝑋𝑖,𝑗 = 𝑘)
Important Positions
• For the next steps, we consider as “important” positions, the
positions in the neighborhood around the splice site dimer
where a nucleotide occurs with a probability > 0.3.
• For the donor splice site the important positions are in a
neighborhood of 11 nt around the donor dimer, with the latter
being at positions 3 and 4 of the neighborhood.
• For the acceptor splice site the important positions are in a
neighborhood of 21 nt around the acceptor dimer, with the
latter being at positions 19 and 20 of the neighborhood.
PPMs
55
19
0 0
58
66
10
20
27 27 28
21
16
0
100
17
16
12
61
52 50 49
11
59
100
0
24 11
77
10 14
14 12
15
7
0 1 2
8
4
11 9 11 13
Pos. 1 Pos. 2 Pos. 3 Pos. 4 Pos. 5 Pos. 6 Pos. 7 Pos. 8 Pos. 9 Pos. 10 Pos. 11
C. Elegans Donor PPM
A T G C
65
9
0 0
68
55
21 23
31
27 26
17
10
0
99
17
27
20
52
41
44
43
8
79
100
0
12
6
51
11
12
10
10
11
4
0 2 5
14
10
16 18 21 24
Pos. 1 Pos. 2 Pos. 3 Pos. 4 Pos. 5 Pos. 6 Pos. 7 Pos. 8 Pos. 9 Pos. 10 Pos. 11
A. Thaliana Donor PPM
A T G C
PPMs
24 24 22 21 20 19 20 19 19 19 21 21 21 20 20
16
27
6
100
0
26
46 47
48 49 50 51 52 53 53 52 48 50 51 51 53 64
28
28
0
0
12
17 16 18 17 17 17 17 16 16 17 19 16 16 18 15
11
39
1
0
100
54
15 15 15 15 15 14 14 14 14 14 15 15 13 13 14 11 9
67
0 0
10
Pos.
1
Pos.
2
Pos.
3
Pos.
4
Pos.
5
Pos.
6
Pos.
7
Pos.
8
Pos.
9
Pos.
10
Pos.
11
Pos.
12
Pos.
13
Pos.
14
Pos.
15
Pos.
16
Pos.
17
Pos.
18
Pos.
19
Pos.
20
Pos.
21
A. Thaliana Acceptor PPM
A T G C
40 43
47
51 50
44
38
34 34 35 38 41 43
29
6
1
9
4
100
0
44
37
36
33
31 32
37
40
43 43 42
40
41
43
58
89 98
68
14
0
0
13
10 9 8
8 7 8 9 10 10 9 8
8
7 7
3
1
8
1
0
100
29
15 15 14 12 13 14 15 15 15 16 16
12
8 8
4 2
17
84
0 0
15
Pos.
1
Pos.
2
Pos.
3
Pos.
4
Pos.
5
Pos.
6
Pos.
7
Pos.
8
Pos.
9
Pos.
10
Pos.
11
Pos.
12
Pos.
13
Pos.
14
Pos.
15
Pos.
16
Pos.
17
Pos.
18
Pos.
19
Pos.
20
Pos.
21
C. Elegans Acceptor PPM
A T G C
Consensus Sequences
pos 1 2 3 4 5 6 7 8 9 10 11
AT A G G T A A G T AT T T
CE A G G T A A G T T T T
DM A G G T A A G T AT AT AT
DR A G G T A A G T A AT AT
HS A G G T A A G T X X X
pos 1 2 3 4 5 6 7 8 9 10 11 12 13 14 15 16 17 18 19 20 21
AT T T T T T T T T T T T T T T T T G C A G G
CE AT AT AT AT AT AT AT AT AT AT AT AT AT T T T T C A G A
DM AT AT AT T T T T T T T T T T T T T T C A G A
DR T T T T T T T T T T T T T T T T T C A G G
HS T T T T T T T T T T T T T T T T X C A G G
Donor:
Acceptor:
GT dinucleotide at positions 3-4
of the examined sequence
AG dinucleotide at positions 19-20
of the examined sequence
DNA Sequence Representation
• Per se representation:
𝑓 𝑥𝑖 =
0, 𝑥𝑖 = 𝐴
1, 𝑥𝑖 = 𝑇
2, 𝑥𝑖 = 𝐺
3, 𝑥𝑖 = 𝐶
DNA Sequence Representation
• Per se representation:
𝑓 𝑥𝑖 =
0, 𝑥𝑖 = 𝐴
1, 𝑥𝑖 = 𝑇
2, 𝑥𝑖 = 𝐺
3, 𝑥𝑖 = 𝐶
• Binary representation:
𝑓𝑁 𝑖
𝑥𝑖 = ||𝑁𝑖 = 𝑥𝑖 ||
DNA Sequence Representation
• Per se representation:
𝑓 𝑥𝑖 =
0, 𝑥𝑖 = 𝐴
1, 𝑥𝑖 = 𝑇
2, 𝑥𝑖 = 𝐺
3, 𝑥𝑖 = 𝐶
• Binary representation:
𝑓𝑁 𝑖
𝑥𝑖 = ||𝑁𝑖 = 𝑥𝑖 ||
• Score Matrix representation:
𝑓𝑁 𝑖
𝑥𝑖 =
2, 𝑥𝑖 = 𝑁𝑖
1, 𝑥𝑖 = 𝑀𝑖
0, 𝑒𝑙𝑠𝑒
DNA Sequence Representation
• Per se representation:
𝑓 𝑥𝑖 =
0, 𝑥𝑖 = 𝐴
1, 𝑥𝑖 = 𝑇
2, 𝑥𝑖 = 𝐺
3, 𝑥𝑖 = 𝐶
• Binary representation:
𝑓𝑁 𝑖
𝑥𝑖 = ||𝑁𝑖 = 𝑥𝑖 ||
• Score Matrix representation:
𝑓𝑁 𝑖
𝑥𝑖 =
2, 𝑥𝑖 = 𝑁𝑖
1, 𝑥𝑖 = 𝑀𝑖
0, 𝑒𝑙𝑠𝑒
A T C G
A 2 0 0 1
T 0 2 1 0
C 0 1 2 0
G 1 0 0 2
Score Matrix
A and G belong to the purine family
T and C belong to the pyrimidine family
DNA Sequence Representation
• Per se representation:
𝑓 𝑥𝑖 =
0, 𝑥𝑖 = 𝐴
1, 𝑥𝑖 = 𝑇
2, 𝑥𝑖 = 𝐺
3, 𝑥𝑖 = 𝐶
• Binary representation:
𝑓𝑁 𝑖
𝑥𝑖 = ||𝑁𝑖 = 𝑥𝑖 ||
• Score Matrix representation:
𝑓𝑁 𝑖
𝑥𝑖 =
2, 𝑥𝑖 = 𝑁𝑖
1, 𝑥𝑖 = 𝑀𝑖
0, 𝑒𝑙𝑠𝑒
• Weighted representation:
𝑓 𝑥𝑖 = 𝑝(𝑥𝑖|𝑖)
DNA Sequence Representation
• Per se representation:
𝑓 𝑥𝑖 =
0, 𝑥𝑖 = 𝐴
1, 𝑥𝑖 = 𝑇
2, 𝑥𝑖 = 𝐺
3, 𝑥𝑖 = 𝐶
• Binary representation:
𝑓𝑁 𝑖
𝑥𝑖 = ||𝑁𝑖 = 𝑥𝑖 ||
• Score Matrix representation:
𝑓𝑁 𝑖
𝑥𝑖 =
2, 𝑥𝑖 = 𝑁𝑖
1, 𝑥𝑖 = 𝑀𝑖
0, 𝑒𝑙𝑠𝑒
• Weighted representation:
𝑓 𝑥𝑖 = 𝑝(𝑥𝑖|𝑖)
Examples, given the PPM
the consensus TAGGTAAGT
and the sequence ATGGTCGTT:
A 0.3 0.6 0.1 0.0 0.0 0.6 0.7 0.2 0.1
C 0.2 0.2 0.1 0.0 0.0 0.2 0.1 0.1 0.2
G 0.1 0.1 0.7 1.0 0.0 0.1 0.1 0.5 0.1
T 0.4 0.1 0.1 0.0 1.0 0.1 0.1 0.2 0.6
Per se representation 0 1 2 2 1 3 2 1 1
Binary representation 0 0 1 1 1 0 0 0 1
Score Matrix representation 0 0 2 2 2 0 1 0 0
Weighted representation 0.3 0.1 0.7 1.0 1.0 0.2 0.1 0.2 0.6
Feature Evaluation
• Traditional machine learning classification using SVM
and kNN.
• The values of the parameters used were tested
experimentally.
• SVM: Linear kernel.
• kNN: 5 neighbors, Manhattan distance.
Feature Evaluation Results
0.00%
20.00%
40.00%
60.00%
80.00%
100.00%
Per Se Binary Score Matrix Weights
Accuracy
Representation
Test Organism: D. Melanogaster
Method: SVM
A Thaliana
C Elegans
D Melanogaster
D Rerio
H Sapiens 0.00%
20.00%
40.00%
60.00%
80.00%
100.00%
Per Se Binary Score Matrix Weights
Accuracy
Representation
Test Organism: D. Melanogaster
Method: kNN
A Thaliana
C Elegans
D Melanogaster
D Rerio
H Sapiens
Donor Splice Site
Feature Evaluation Results
Acceptor Splice Site
0.00%
20.00%
40.00%
60.00%
80.00%
100.00%
Per Se Binary Score Matrix Weights
Accuracy
Representation
Test Organism: D. Melanogaster
Method: kNN
A Thaliana
C Elegans
D Melanogaster
D Rerio
H Sapiens0.00%
20.00%
40.00%
60.00%
80.00%
100.00%
Per Se Binary Score Matrix Weights
Accuracy
Representation
Test Organism: D.Melanogaster
Method: SVM
A Thaliana
C Elegans
D Melanogaster
D Rerio
H Sapiens
Proposed Models: kNN based
• Iterative algorithm.
• Train a kNN classifier with the data of an organism, e.g. train on
C. Elegans (source domain) and predict on A. Thaliana (target
domain).
• In each iteration recalculate the features for both the source
and the target domain based on the predicted true splice sites.
• Objective: Both source and target domain features approach
target domain distribution.
Proposed Models: kNN based
Algorithm 1. kNN based approach
- Represent all sequences in one of the three representations,
based on the source domain data.
- Repeat
• Train kNN classifier with the source domain data.
• Classify the target domain data.
• Recalculate the PPM and/or the consensus.
• Represent all sequences based on the new PPM or consensus.
- Until divergence or a number of iterations.
• Iterative algorithm.
• Initiate target centroids to be the same as the source centroids
and predict on target domain organism.
• In each iteration recalculate the features for the target domain
based on the predicted true splice sites and recalculate the
target domain centroids.
• The source domain centroids remain stable and contribute to a
percentage to the classification.
• Objective: The target centroids are “moved” closer to the
target domain data.
Proposed Models: kMeans based
• Algorithm 2. kMeans based approach
• Represent all sequences in one of the three representations, based on the source
domain data.
• Compute source domain centers.
• Initialize target domain centers to be the same as the source domain centers.
• Repeat
• Classify the target domain data based on the function
• Recalculate the PPM and/or the consensus from the target domain instances that are
classified as true splice sites.
• Represent the target domain sequences based on the new PPM or consensus.
• Calculate the new target domain centroids.
• Until divergence or a number of iterations.
Evaluation on Proposed Approaches
• In the cases where the consensus sequences and the PPMs of
the source and the target domain data are similar, we don’t
gain much from the transfer learning algorithms.
• In the cases where the consensus sequences differ a lot, both
approaches manage to increase a lot AuROC and Accuracy
percentages.
• kMeans based algorithm performs better than kNN based
algorithm.
• In particular, best results are obtained when the source domain
centroids don’t contribute at all after the first iteration.
Evaluation: Binary Sequence Representation
• Accurate and stable representation.
• Consensus sequence extracted from the classify data converges
to target data consensus.
• Example, when trained with C. Elegans data and tested on A.
Thaliana data:
C. Elegans Consensus:
AT AT AT AT AT AT AT AT AT AT AT AT AT T T T T C A G A
A. Thaliana Consensus:
T T T T T T T T T T T T T T T T G C A G G
Extracted Consensus:
T T T T T T T T T T T T T T T T T C A G G
0.58
0.6
0.62
0.64
0.66
0.68
0.7
0.72
0.74
1st 2nd 3rd 4th
AuROC
Iteration
kNN based classification
A Thaliana D Melanogaster D Rerio H Sapiens
0.58
0.63
0.68
0.73
0.78
0.83
0.88
1st 2nd 3rd 4th
AuROC
Iteration
kMeans based classification - 0% Source data
contribution
A Thaliana D Melanogaster D Rerio H Sapiens
0.58
0.63
0.68
0.73
0.78
1st 2nd 3rd 4th
AuROC
Iteration
kMeans based classification - 40% Source data
contribution
A Thaliana D Melanogaster D Rerio H Sapiens
0.58
0.63
0.68
0.73
1st 2nd 3rd 4th
AuROC
Iteration
kMeans based classification - 80% Source data
contribution
A Thaliana D Melanogaster D Rerio H Sapiens
Evaluation: Binary Sequence Representation
Acceptor
Splice Site
Train Organism:
C. Elegans
Evaluation: Score Matrix Sequence Representation
• Accurate and stable representation as well.
• Performs better than binary representation.
• Consensus sequence extracted from the classify data converges to target
data consensus.
• Example, when trained with C. Elegans data and tested on A. Thaliana
data:
C. Elegans Consensus:
AT AT AT AT AT AT AT AT AT AT AT AT AT T T T T C A G A
A. Thaliana Consensus:
T T T T T T T T T T T T T T T T G C A G G
Extracted Consensus:
T T T T T T T T T T T T T T T T T C A G G
0.58
0.63
0.68
0.73
0.78
0.83
1st 2nd 3rd 4th
AuROC
Iteration
kNN based classification
A Thaliana D Melanogaster D Rerio H Sapiens
0.58
0.68
0.78
0.88
0.98
1st 2nd 3rd 4th
AuROC
Iteration
kMeans based classification - 0% Source data
contribution
A Thaliana D Melanogaster D Rerio H Sapiens
0.58
0.68
0.78
0.88
0.98
1st 2nd 3rd 4th
AuROC
Iteration
kMeans based classification - 40% Source data
contribution
A Thaliana D Melanogaster D Rerio H Sapiens
0.58
0.63
0.68
0.73
0.78
0.83
0.88
1st 2nd 3rd 4th
AuROC
Iteration
kMeans based classification - 80% Source data
contribution
A Thaliana D Melanogaster D Rerio H Sapiens
Evaluation: Score Matrix Sequence Representation
Acceptor
Splice Site
Train Organism:
C. Elegans
Evaluation: Weights Sequence Representation
• Although seemed promising in the first set of experiments, it doesn’t perform well using transfer
learning methods.
• The PPM extracted from the classify data does not converges to target data PPM.
• This was expected, as the extracted PPM was constructed using a subset of the available data.
27% 26% 24% 24% 24% 24% 25% 23% 24% 24% 24% 25% 25% 24% 24%
14%
22% 19%
100%
0%
28%
39% 39% 41% 40% 41% 41% 40% 42% 41% 43% 39% 40% 41% 40% 42% 67%
28%
25%
0%
0%
22%
19% 19% 18% 19% 19% 18% 18% 19% 19% 18% 20% 19% 19% 21% 17%
10%
37%
12%
0%
100%
35%
16% 16% 17% 17% 16% 16% 17% 16% 16% 15% 16% 17% 15% 15% 16%
9% 13%
44%
0% 0%
15%
Pos.
1
Pos.
2
Pos.
3
Pos.
4
Pos.
5
Pos.
6
Pos.
7
Pos.
8
Pos.
9
Pos.
10
Pos.
11
Pos.
12
Pos.
13
Pos.
14
Pos.
15
Pos.
16
Pos.
17
Pos.
18
Pos.
19
Pos.
20
Pos.
21
C. Elegans - A. Thaliana Acceptor extracted PPM
A T G C
24% 24% 22% 21% 20% 19% 20% 19% 19% 19% 21% 21% 21% 20% 20% 16%
27%
6%
100%
0%
26%
46% 47% 48% 49% 50% 51% 52% 53% 53% 52% 48% 50% 51% 51% 53% 64%
28%
28%
0%
0%
12%
17% 16% 18% 17% 17% 17% 17% 16% 16% 17% 19% 16% 16% 18% 15%
11%
39%
1%
0%
100%
54%
15% 15% 15% 15% 15% 14% 14% 14% 14% 14% 15% 15% 13% 13% 14% 11% 9%
67%
0% 0%
10%
Pos.
1
Pos.
2
Pos.
3
Pos.
4
Pos.
5
Pos.
6
Pos.
7
Pos.
8
Pos.
9
Pos.
10
Pos.
11
Pos.
12
Pos.
13
Pos.
14
Pos.
15
Pos.
16
Pos.
17
Pos.
18
Pos.
19
Pos.
20
Pos.
21
A. Thaliana Acceptor target PPM
A T G C
Evaluation: Weights Sequence Representation
0.58
0.63
0.68
0.73
0.78
1st 2nd 3rd 4th
AuROC
Iteration
kNN based classification
A Thaliana D Melanogaster D Rerio H Sapiens
0.58
0.63
0.68
0.73
0.78
A Thaliana D Melanogaster D Rerio H Sapiens
AuROC
Iteration
kMeans based classification - 0% Source data
contribution
1st 2nd 3rd 4th
0.55
0.6
0.65
0.7
0.75
1st 2nd 3rd 4th
AuROC
Iteration
kMeans based classification - 40% Source data
contribution
A Thaliana D Melanogaster D Rerio H Sapiens
0.58
0.63
0.68
0.73
0.78
1st 2nd 3rd 4th
AuROC
Iteration
kMeans based classification - 80% Source data
contribution
A Thaliana D Melanogaster D Rerio H Sapiens
Acceptor
Splice Site
Train Organism:
C. Elegans
Summary
• The common patterns in the sequences of the five studied
organisms were extracted using bioinformatics analysis.
• For the classification task, only the “important” positions of the
neighborhood were used.
• Four DNA sequence representations were proposed, namely:
• Sequence per se.
• Binary representation.
• Score Matrix representation.
• Weighted representation.
• Binary, Score Matrix and Weighted representations perform well
even when using traditional machine learning.
• Two transfer learning algorithms are proposed:
• kNN based.
• kMeans based.
• When the patterns in the sequences are similar between
organisms, transfer learning doesn’t contribute a lot as the
results are already good.
• When the patterns differ a lot, kMeans based algorithm with no
source data contribution after first iteration, helps reducing the
gap.
• Best performance: Score Matrix Representation.
Summary
Future Steps
• More experiments using all the available data.
• Study more organisms.
• Perform detailed comparison with other approaches.
• Variation of the proposed transfer learning models, using in the
training set in each iteration, the most certainly classified target
data from the previous iteration.
Thank you!

More Related Content

Similar to Splice site recognition among different organisms

Errorpredictorsmodeling
ErrorpredictorsmodelingErrorpredictorsmodeling
Errorpredictorsmodeling
Manuel Rivas
 
Improving the accuracy of k-means algorithm using genetic algorithm
Improving the accuracy of k-means algorithm using genetic algorithmImproving the accuracy of k-means algorithm using genetic algorithm
Improving the accuracy of k-means algorithm using genetic algorithm
Kasun Ranga Wijeweera
 
3. RTPCR.ppt
3. RTPCR.ppt3. RTPCR.ppt
3. RTPCR.ppt
habtamu biazin
 
Two-Tailed PCR - New Ultrasensitive and Ultraspecific Technique for the Quant...
Two-Tailed PCR - New Ultrasensitive and Ultraspecific Technique for the Quant...Two-Tailed PCR - New Ultrasensitive and Ultraspecific Technique for the Quant...
Two-Tailed PCR - New Ultrasensitive and Ultraspecific Technique for the Quant...
Kate Barlow
 
Do Fractional Norms and Quasinorms Help to Overcome the Curse of Dimensiona...
Do Fractional Norms and Quasinorms Help to Overcome the Curse of Dimensiona...Do Fractional Norms and Quasinorms Help to Overcome the Curse of Dimensiona...
Do Fractional Norms and Quasinorms Help to Overcome the Curse of Dimensiona...
Alexander Gorban
 
Generalizing phylogenetics to infer patterns predicted by processes of divers...
Generalizing phylogenetics to infer patterns predicted by processes of divers...Generalizing phylogenetics to infer patterns predicted by processes of divers...
Generalizing phylogenetics to infer patterns predicted by processes of divers...
Jamie Oaks
 
01-Sequencing_Technologies (1).ppt for education
01-Sequencing_Technologies (1).ppt for education01-Sequencing_Technologies (1).ppt for education
01-Sequencing_Technologies (1).ppt for education
aryajayakottarathil
 
Real-time PCR.ppt
Real-time PCR.pptReal-time PCR.ppt
Real-time PCR.ppt
SappahAhmed
 
Genetic Algorithm
Genetic AlgorithmGenetic Algorithm
Genetic Algorithm
SHIMI S L
 
Assay Development in Digital PCR
Assay Development in Digital PCRAssay Development in Digital PCR
Assay Development in Digital PCR
Kirsten Copren
 
EVE161: Microbial Phylogenomics - Class 2 - Evolution of DNA Sequencing
EVE161: Microbial Phylogenomics - Class 2 - Evolution of DNA SequencingEVE161: Microbial Phylogenomics - Class 2 - Evolution of DNA Sequencing
EVE161: Microbial Phylogenomics - Class 2 - Evolution of DNA Sequencing
Jonathan Eisen
 
Characterization of Novel ctDNA Reference Materials Developed using the Genom...
Characterization of Novel ctDNA Reference Materials Developed using the Genom...Characterization of Novel ctDNA Reference Materials Developed using the Genom...
Characterization of Novel ctDNA Reference Materials Developed using the Genom...
Thermo Fisher Scientific
 
Predicting phenotype from genotype with machine learning
Predicting phenotype from genotype with machine learningPredicting phenotype from genotype with machine learning
Predicting phenotype from genotype with machine learning
Patricia Francis-Lyon
 
Algorithm Implementation of Genetic Association ‎Analysis for Rheumatoid Arth...
Algorithm Implementation of Genetic Association ‎Analysis for Rheumatoid Arth...Algorithm Implementation of Genetic Association ‎Analysis for Rheumatoid Arth...
Algorithm Implementation of Genetic Association ‎Analysis for Rheumatoid Arth...
Fatma Sayed Ibrahim
 
160627 giab for festival sv workshop
160627 giab for festival sv workshop160627 giab for festival sv workshop
160627 giab for festival sv workshop
GenomeInABottle
 
DNA cell cycle by flow cytometry
DNA cell cycle by flow cytometryDNA cell cycle by flow cytometry
DNA cell cycle by flow cytometry
Richard Hastings
 
Dna sequencing and its types
Dna sequencing and its typesDna sequencing and its types
Dna sequencing and its types
Yuvaraj neelakandan
 
Detecting STR Peaks in Degraded DNA samples
Detecting STR Peaks in Degraded DNA samplesDetecting STR Peaks in Degraded DNA samples
Detecting STR Peaks in Degraded DNA samples
Emanuela Marasco
 
High throughput qPCR: tips for analysis across multiple plates
High throughput qPCR: tips for analysis across multiple platesHigh throughput qPCR: tips for analysis across multiple plates
High throughput qPCR: tips for analysis across multiple plates
Integrated DNA Technologies
 
Rnaseq basics ngs_application1
Rnaseq basics ngs_application1Rnaseq basics ngs_application1
Rnaseq basics ngs_application1
Yaoyu Wang
 

Similar to Splice site recognition among different organisms (20)

Errorpredictorsmodeling
ErrorpredictorsmodelingErrorpredictorsmodeling
Errorpredictorsmodeling
 
Improving the accuracy of k-means algorithm using genetic algorithm
Improving the accuracy of k-means algorithm using genetic algorithmImproving the accuracy of k-means algorithm using genetic algorithm
Improving the accuracy of k-means algorithm using genetic algorithm
 
3. RTPCR.ppt
3. RTPCR.ppt3. RTPCR.ppt
3. RTPCR.ppt
 
Two-Tailed PCR - New Ultrasensitive and Ultraspecific Technique for the Quant...
Two-Tailed PCR - New Ultrasensitive and Ultraspecific Technique for the Quant...Two-Tailed PCR - New Ultrasensitive and Ultraspecific Technique for the Quant...
Two-Tailed PCR - New Ultrasensitive and Ultraspecific Technique for the Quant...
 
Do Fractional Norms and Quasinorms Help to Overcome the Curse of Dimensiona...
Do Fractional Norms and Quasinorms Help to Overcome the Curse of Dimensiona...Do Fractional Norms and Quasinorms Help to Overcome the Curse of Dimensiona...
Do Fractional Norms and Quasinorms Help to Overcome the Curse of Dimensiona...
 
Generalizing phylogenetics to infer patterns predicted by processes of divers...
Generalizing phylogenetics to infer patterns predicted by processes of divers...Generalizing phylogenetics to infer patterns predicted by processes of divers...
Generalizing phylogenetics to infer patterns predicted by processes of divers...
 
01-Sequencing_Technologies (1).ppt for education
01-Sequencing_Technologies (1).ppt for education01-Sequencing_Technologies (1).ppt for education
01-Sequencing_Technologies (1).ppt for education
 
Real-time PCR.ppt
Real-time PCR.pptReal-time PCR.ppt
Real-time PCR.ppt
 
Genetic Algorithm
Genetic AlgorithmGenetic Algorithm
Genetic Algorithm
 
Assay Development in Digital PCR
Assay Development in Digital PCRAssay Development in Digital PCR
Assay Development in Digital PCR
 
EVE161: Microbial Phylogenomics - Class 2 - Evolution of DNA Sequencing
EVE161: Microbial Phylogenomics - Class 2 - Evolution of DNA SequencingEVE161: Microbial Phylogenomics - Class 2 - Evolution of DNA Sequencing
EVE161: Microbial Phylogenomics - Class 2 - Evolution of DNA Sequencing
 
Characterization of Novel ctDNA Reference Materials Developed using the Genom...
Characterization of Novel ctDNA Reference Materials Developed using the Genom...Characterization of Novel ctDNA Reference Materials Developed using the Genom...
Characterization of Novel ctDNA Reference Materials Developed using the Genom...
 
Predicting phenotype from genotype with machine learning
Predicting phenotype from genotype with machine learningPredicting phenotype from genotype with machine learning
Predicting phenotype from genotype with machine learning
 
Algorithm Implementation of Genetic Association ‎Analysis for Rheumatoid Arth...
Algorithm Implementation of Genetic Association ‎Analysis for Rheumatoid Arth...Algorithm Implementation of Genetic Association ‎Analysis for Rheumatoid Arth...
Algorithm Implementation of Genetic Association ‎Analysis for Rheumatoid Arth...
 
160627 giab for festival sv workshop
160627 giab for festival sv workshop160627 giab for festival sv workshop
160627 giab for festival sv workshop
 
DNA cell cycle by flow cytometry
DNA cell cycle by flow cytometryDNA cell cycle by flow cytometry
DNA cell cycle by flow cytometry
 
Dna sequencing and its types
Dna sequencing and its typesDna sequencing and its types
Dna sequencing and its types
 
Detecting STR Peaks in Degraded DNA samples
Detecting STR Peaks in Degraded DNA samplesDetecting STR Peaks in Degraded DNA samples
Detecting STR Peaks in Degraded DNA samples
 
High throughput qPCR: tips for analysis across multiple plates
High throughput qPCR: tips for analysis across multiple platesHigh throughput qPCR: tips for analysis across multiple plates
High throughput qPCR: tips for analysis across multiple plates
 
Rnaseq basics ngs_application1
Rnaseq basics ngs_application1Rnaseq basics ngs_application1
Rnaseq basics ngs_application1
 

Recently uploaded

Quality assurance B.pharm 6th semester BP606T UNIT 5
Quality assurance B.pharm 6th semester BP606T UNIT 5Quality assurance B.pharm 6th semester BP606T UNIT 5
Quality assurance B.pharm 6th semester BP606T UNIT 5
vimalveerammal
 
Call Girls Noida🔥9873777170🔥Gorgeous Escorts in Noida Available 24/7
Call Girls Noida🔥9873777170🔥Gorgeous Escorts in Noida Available 24/7Call Girls Noida🔥9873777170🔥Gorgeous Escorts in Noida Available 24/7
Call Girls Noida🔥9873777170🔥Gorgeous Escorts in Noida Available 24/7
yashika sharman06
 
Mechanics:- Simple and Compound Pendulum
Mechanics:- Simple and Compound PendulumMechanics:- Simple and Compound Pendulum
Mechanics:- Simple and Compound Pendulum
PravinHudge1
 
Nutaceuticsls herbal drug technology CVS, cancer.pptx
Nutaceuticsls herbal drug technology CVS, cancer.pptxNutaceuticsls herbal drug technology CVS, cancer.pptx
Nutaceuticsls herbal drug technology CVS, cancer.pptx
vimalveerammal
 
Module_1.In autotrophic nutrition ORGANISM
Module_1.In autotrophic nutrition ORGANISMModule_1.In autotrophic nutrition ORGANISM
Module_1.In autotrophic nutrition ORGANISM
rajeshwexl
 
Synopsis presentation VDR gene polymorphism and anemia (2).pptx
Synopsis presentation VDR gene polymorphism and anemia (2).pptxSynopsis presentation VDR gene polymorphism and anemia (2).pptx
Synopsis presentation VDR gene polymorphism and anemia (2).pptx
FarhanaHussain18
 
Evidence of Jet Activity from the Secondary Black Hole in the OJ 287 Binary S...
Evidence of Jet Activity from the Secondary Black Hole in the OJ 287 Binary S...Evidence of Jet Activity from the Secondary Black Hole in the OJ 287 Binary S...
Evidence of Jet Activity from the Secondary Black Hole in the OJ 287 Binary S...
Sérgio Sacani
 
23PH301 - Optics - Unit 2 - Interference
23PH301 - Optics - Unit 2 - Interference23PH301 - Optics - Unit 2 - Interference
23PH301 - Optics - Unit 2 - Interference
RDhivya6
 
Flow chart.pdf LIFE SCIENCES CSIR UGC NET CONTENT
Flow chart.pdf  LIFE SCIENCES CSIR UGC NET CONTENTFlow chart.pdf  LIFE SCIENCES CSIR UGC NET CONTENT
Flow chart.pdf LIFE SCIENCES CSIR UGC NET CONTENT
savindersingh16
 
The Limited Role of the Streaming Instability during Moon and Exomoon Formation
The Limited Role of the Streaming Instability during Moon and Exomoon FormationThe Limited Role of the Streaming Instability during Moon and Exomoon Formation
The Limited Role of the Streaming Instability during Moon and Exomoon Formation
Sérgio Sacani
 
BIRDS DIVERSITY OF SOOTEA BISWANATH ASSAM.ppt.pptx
BIRDS  DIVERSITY OF SOOTEA BISWANATH ASSAM.ppt.pptxBIRDS  DIVERSITY OF SOOTEA BISWANATH ASSAM.ppt.pptx
BIRDS DIVERSITY OF SOOTEA BISWANATH ASSAM.ppt.pptx
goluk9330
 
Holsinger, Bruce W. - Music, body and desire in medieval culture [2001].pdf
Holsinger, Bruce W. - Music, body and desire in medieval culture [2001].pdfHolsinger, Bruce W. - Music, body and desire in medieval culture [2001].pdf
Holsinger, Bruce W. - Music, body and desire in medieval culture [2001].pdf
frank0071
 
Lattice Defects in ionic solid compound.pptx
Lattice Defects in ionic solid compound.pptxLattice Defects in ionic solid compound.pptx
Lattice Defects in ionic solid compound.pptx
DrRajeshDas
 
Physics Investigatory Project on transformers. Class 12th
Physics Investigatory Project on transformers. Class 12thPhysics Investigatory Project on transformers. Class 12th
Physics Investigatory Project on transformers. Class 12th
pihuart12
 
Discovery of An Apparent Red, High-Velocity Type Ia Supernova at 𝐳 = 2.9 wi...
Discovery of An Apparent Red, High-Velocity Type Ia Supernova at  𝐳 = 2.9  wi...Discovery of An Apparent Red, High-Velocity Type Ia Supernova at  𝐳 = 2.9  wi...
Discovery of An Apparent Red, High-Velocity Type Ia Supernova at 𝐳 = 2.9 wi...
Sérgio Sacani
 
Evaluation and Identification of J'BaFofi the Giant Spider of Congo and Moke...
Evaluation and Identification of J'BaFofi the Giant  Spider of Congo and Moke...Evaluation and Identification of J'BaFofi the Giant  Spider of Congo and Moke...
Evaluation and Identification of J'BaFofi the Giant Spider of Congo and Moke...
MrSproy
 
Delhi Call Girls ✓WhatsApp 9999965857 🔝Top Class Call Girl Service Available
Delhi Call Girls ✓WhatsApp 9999965857 🔝Top Class Call Girl Service AvailableDelhi Call Girls ✓WhatsApp 9999965857 🔝Top Class Call Girl Service Available
Delhi Call Girls ✓WhatsApp 9999965857 🔝Top Class Call Girl Service Available
kk090568
 
Post translation modification by Suyash Garg
Post translation modification by Suyash GargPost translation modification by Suyash Garg
Post translation modification by Suyash Garg
suyashempire
 
Compositions of iron-meteorite parent bodies constrainthe structure of the pr...
Compositions of iron-meteorite parent bodies constrainthe structure of the pr...Compositions of iron-meteorite parent bodies constrainthe structure of the pr...
Compositions of iron-meteorite parent bodies constrainthe structure of the pr...
Sérgio Sacani
 
一比一原版美国佩斯大学毕业证如何办理
一比一原版美国佩斯大学毕业证如何办理一比一原版美国佩斯大学毕业证如何办理
一比一原版美国佩斯大学毕业证如何办理
gyhwyo
 

Recently uploaded (20)

Quality assurance B.pharm 6th semester BP606T UNIT 5
Quality assurance B.pharm 6th semester BP606T UNIT 5Quality assurance B.pharm 6th semester BP606T UNIT 5
Quality assurance B.pharm 6th semester BP606T UNIT 5
 
Call Girls Noida🔥9873777170🔥Gorgeous Escorts in Noida Available 24/7
Call Girls Noida🔥9873777170🔥Gorgeous Escorts in Noida Available 24/7Call Girls Noida🔥9873777170🔥Gorgeous Escorts in Noida Available 24/7
Call Girls Noida🔥9873777170🔥Gorgeous Escorts in Noida Available 24/7
 
Mechanics:- Simple and Compound Pendulum
Mechanics:- Simple and Compound PendulumMechanics:- Simple and Compound Pendulum
Mechanics:- Simple and Compound Pendulum
 
Nutaceuticsls herbal drug technology CVS, cancer.pptx
Nutaceuticsls herbal drug technology CVS, cancer.pptxNutaceuticsls herbal drug technology CVS, cancer.pptx
Nutaceuticsls herbal drug technology CVS, cancer.pptx
 
Module_1.In autotrophic nutrition ORGANISM
Module_1.In autotrophic nutrition ORGANISMModule_1.In autotrophic nutrition ORGANISM
Module_1.In autotrophic nutrition ORGANISM
 
Synopsis presentation VDR gene polymorphism and anemia (2).pptx
Synopsis presentation VDR gene polymorphism and anemia (2).pptxSynopsis presentation VDR gene polymorphism and anemia (2).pptx
Synopsis presentation VDR gene polymorphism and anemia (2).pptx
 
Evidence of Jet Activity from the Secondary Black Hole in the OJ 287 Binary S...
Evidence of Jet Activity from the Secondary Black Hole in the OJ 287 Binary S...Evidence of Jet Activity from the Secondary Black Hole in the OJ 287 Binary S...
Evidence of Jet Activity from the Secondary Black Hole in the OJ 287 Binary S...
 
23PH301 - Optics - Unit 2 - Interference
23PH301 - Optics - Unit 2 - Interference23PH301 - Optics - Unit 2 - Interference
23PH301 - Optics - Unit 2 - Interference
 
Flow chart.pdf LIFE SCIENCES CSIR UGC NET CONTENT
Flow chart.pdf  LIFE SCIENCES CSIR UGC NET CONTENTFlow chart.pdf  LIFE SCIENCES CSIR UGC NET CONTENT
Flow chart.pdf LIFE SCIENCES CSIR UGC NET CONTENT
 
The Limited Role of the Streaming Instability during Moon and Exomoon Formation
The Limited Role of the Streaming Instability during Moon and Exomoon FormationThe Limited Role of the Streaming Instability during Moon and Exomoon Formation
The Limited Role of the Streaming Instability during Moon and Exomoon Formation
 
BIRDS DIVERSITY OF SOOTEA BISWANATH ASSAM.ppt.pptx
BIRDS  DIVERSITY OF SOOTEA BISWANATH ASSAM.ppt.pptxBIRDS  DIVERSITY OF SOOTEA BISWANATH ASSAM.ppt.pptx
BIRDS DIVERSITY OF SOOTEA BISWANATH ASSAM.ppt.pptx
 
Holsinger, Bruce W. - Music, body and desire in medieval culture [2001].pdf
Holsinger, Bruce W. - Music, body and desire in medieval culture [2001].pdfHolsinger, Bruce W. - Music, body and desire in medieval culture [2001].pdf
Holsinger, Bruce W. - Music, body and desire in medieval culture [2001].pdf
 
Lattice Defects in ionic solid compound.pptx
Lattice Defects in ionic solid compound.pptxLattice Defects in ionic solid compound.pptx
Lattice Defects in ionic solid compound.pptx
 
Physics Investigatory Project on transformers. Class 12th
Physics Investigatory Project on transformers. Class 12thPhysics Investigatory Project on transformers. Class 12th
Physics Investigatory Project on transformers. Class 12th
 
Discovery of An Apparent Red, High-Velocity Type Ia Supernova at 𝐳 = 2.9 wi...
Discovery of An Apparent Red, High-Velocity Type Ia Supernova at  𝐳 = 2.9  wi...Discovery of An Apparent Red, High-Velocity Type Ia Supernova at  𝐳 = 2.9  wi...
Discovery of An Apparent Red, High-Velocity Type Ia Supernova at 𝐳 = 2.9 wi...
 
Evaluation and Identification of J'BaFofi the Giant Spider of Congo and Moke...
Evaluation and Identification of J'BaFofi the Giant  Spider of Congo and Moke...Evaluation and Identification of J'BaFofi the Giant  Spider of Congo and Moke...
Evaluation and Identification of J'BaFofi the Giant Spider of Congo and Moke...
 
Delhi Call Girls ✓WhatsApp 9999965857 🔝Top Class Call Girl Service Available
Delhi Call Girls ✓WhatsApp 9999965857 🔝Top Class Call Girl Service AvailableDelhi Call Girls ✓WhatsApp 9999965857 🔝Top Class Call Girl Service Available
Delhi Call Girls ✓WhatsApp 9999965857 🔝Top Class Call Girl Service Available
 
Post translation modification by Suyash Garg
Post translation modification by Suyash GargPost translation modification by Suyash Garg
Post translation modification by Suyash Garg
 
Compositions of iron-meteorite parent bodies constrainthe structure of the pr...
Compositions of iron-meteorite parent bodies constrainthe structure of the pr...Compositions of iron-meteorite parent bodies constrainthe structure of the pr...
Compositions of iron-meteorite parent bodies constrainthe structure of the pr...
 
一比一原版美国佩斯大学毕业证如何办理
一比一原版美国佩斯大学毕业证如何办理一比一原版美国佩斯大学毕业证如何办理
一比一原版美国佩斯大学毕业证如何办理
 

Splice site recognition among different organisms

  • 1. INTERDEPARTMENTAL POSTGRADUATE PROGRAM "INFORMATION TECHNOLOGIES IN MEDICINE AND BIOLOGY" MASTER THESIS Splice site recognition among different organisms Despoina I. Kalfakakou Supervisors: Stavros Perantonis, Research Director, NCSR Demokritos George Paliouras, Research Director, NCSR Demokritos Anastasia Krithara, Post-Doctoral Researcher, NCSR Demokritos
  • 2. Structure • RNA Splicing • Motivation • Transfer Learning • Proposed Approaches • Conclusion
  • 3. Central Dogma of Molecular Biology
  • 4. RNA Splicing process snRNPs: small nuclear ribonucleoproteins Spliceosome: Complex formed from snRNPs which catalyzes splicing process
  • 5. RNA Splicing process Donor, Acceptor: Splice sites, boundaries between exons and introns GU dinucleotide AG dinucleotide
  • 6. Importance of Accurate Splice Site Prediction • Typical mammalian gene has 7-8 exons spread out over ~16 kb. • Splice site prediction leads to identification of these exons. • Exon identification is the first step to accurate genome annotation. • Currently, hundreds of genomes have been annotated, but thousands more remain unknown. • Moreover, many of the already annotated genomes are incorrectly annotated.
  • 7. Existing Splice Site Prediction Techniques • Models based on SVMs, HMMS, artificial neural networks. • Variate DNA sequence representations, most using a large neighborhood around the donor and acceptor dimers. • Existing techniques using traditional machine learning methods perform well. ~150 nt around dimer
  • 8. Issues of Existing Methods • Ab initio splice site prediction is a time and money consuming process. • Poorly annotated genomes. • Lack of labeled data. • Idea: Transfer knowledge from already annotated genomes of other organisms. This kind of knowledge transfer is used every day by biologists during their experiments. In machine learning it is called transfer learning.
  • 9. Transfer Learning • Introduced in 1995. • Goal: to reduce the need of collecting and classifying new training data. • Applications: Sentiment classification, speech recognition, machine vision etc.
  • 10. Transfer Learning Categorization Category Source Domain Labels Target Domain Labels Inductive Transfer Learning Available Available Transductive Transfer Learning Available Unavailable Unsupervised Transfer Learning Unavailable Unavailable
  • 11. Transfer Learning Categorization Category Source Domain Labels Target Domain Labels Inductive Transfer Learning Available Available Transductive Transfer Learning Available Unavailable Unsupervised Transfer Learning Unavailable Unavailable • Transferring the knowledge of instances: Importance sampling. • Transferring the knowledge of feature representation: Find “good” feature representations to minimize domain divergence and classification error.
  • 12. Proposed Approach • Bioinformatics Analysis in order to extract the most significant patterns between organisms. • Four DNA sequence representations. • Evaluation of DNA sequence representations using traditional machine learning. • Development of two transfer learning models.
  • 13. Data – Evaluation methods A. Thaliana C. Elegans D. Melanogaster D. Rerio H. Sapiens In each classification experiment: • Training data 10000 decoy and 5000 true splice sites • Test data 10000 decoy and 5000 true splice sites Evaluation Methods: Accuracy, Area Under the Receiver Operating Characteristic curve (auROC) For the statistical analysis, we used the DNA sequences of the splice sites of each organism’s complete genome.
  • 14. PPM and Consensus Calculation • Features based on bioinformatics analysis of the sequences of the true splice sites. • Calculation of Position Probability Matrices (PPMs) and Consensus sequences for each organism in order to extract patterns. • PPM calculation: 𝑀 𝑘,𝑗 = 1 𝑁 𝑖 𝑁 𝐼(𝑋𝑖,𝑗 = 𝑘)
  • 15. Important Positions • For the next steps, we consider as “important” positions, the positions in the neighborhood around the splice site dimer where a nucleotide occurs with a probability > 0.3. • For the donor splice site the important positions are in a neighborhood of 11 nt around the donor dimer, with the latter being at positions 3 and 4 of the neighborhood. • For the acceptor splice site the important positions are in a neighborhood of 21 nt around the acceptor dimer, with the latter being at positions 19 and 20 of the neighborhood.
  • 16. PPMs 55 19 0 0 58 66 10 20 27 27 28 21 16 0 100 17 16 12 61 52 50 49 11 59 100 0 24 11 77 10 14 14 12 15 7 0 1 2 8 4 11 9 11 13 Pos. 1 Pos. 2 Pos. 3 Pos. 4 Pos. 5 Pos. 6 Pos. 7 Pos. 8 Pos. 9 Pos. 10 Pos. 11 C. Elegans Donor PPM A T G C 65 9 0 0 68 55 21 23 31 27 26 17 10 0 99 17 27 20 52 41 44 43 8 79 100 0 12 6 51 11 12 10 10 11 4 0 2 5 14 10 16 18 21 24 Pos. 1 Pos. 2 Pos. 3 Pos. 4 Pos. 5 Pos. 6 Pos. 7 Pos. 8 Pos. 9 Pos. 10 Pos. 11 A. Thaliana Donor PPM A T G C
  • 17. PPMs 24 24 22 21 20 19 20 19 19 19 21 21 21 20 20 16 27 6 100 0 26 46 47 48 49 50 51 52 53 53 52 48 50 51 51 53 64 28 28 0 0 12 17 16 18 17 17 17 17 16 16 17 19 16 16 18 15 11 39 1 0 100 54 15 15 15 15 15 14 14 14 14 14 15 15 13 13 14 11 9 67 0 0 10 Pos. 1 Pos. 2 Pos. 3 Pos. 4 Pos. 5 Pos. 6 Pos. 7 Pos. 8 Pos. 9 Pos. 10 Pos. 11 Pos. 12 Pos. 13 Pos. 14 Pos. 15 Pos. 16 Pos. 17 Pos. 18 Pos. 19 Pos. 20 Pos. 21 A. Thaliana Acceptor PPM A T G C 40 43 47 51 50 44 38 34 34 35 38 41 43 29 6 1 9 4 100 0 44 37 36 33 31 32 37 40 43 43 42 40 41 43 58 89 98 68 14 0 0 13 10 9 8 8 7 8 9 10 10 9 8 8 7 7 3 1 8 1 0 100 29 15 15 14 12 13 14 15 15 15 16 16 12 8 8 4 2 17 84 0 0 15 Pos. 1 Pos. 2 Pos. 3 Pos. 4 Pos. 5 Pos. 6 Pos. 7 Pos. 8 Pos. 9 Pos. 10 Pos. 11 Pos. 12 Pos. 13 Pos. 14 Pos. 15 Pos. 16 Pos. 17 Pos. 18 Pos. 19 Pos. 20 Pos. 21 C. Elegans Acceptor PPM A T G C
  • 18. Consensus Sequences pos 1 2 3 4 5 6 7 8 9 10 11 AT A G G T A A G T AT T T CE A G G T A A G T T T T DM A G G T A A G T AT AT AT DR A G G T A A G T A AT AT HS A G G T A A G T X X X pos 1 2 3 4 5 6 7 8 9 10 11 12 13 14 15 16 17 18 19 20 21 AT T T T T T T T T T T T T T T T T G C A G G CE AT AT AT AT AT AT AT AT AT AT AT AT AT T T T T C A G A DM AT AT AT T T T T T T T T T T T T T T C A G A DR T T T T T T T T T T T T T T T T T C A G G HS T T T T T T T T T T T T T T T T X C A G G Donor: Acceptor: GT dinucleotide at positions 3-4 of the examined sequence AG dinucleotide at positions 19-20 of the examined sequence
  • 19. DNA Sequence Representation • Per se representation: 𝑓 𝑥𝑖 = 0, 𝑥𝑖 = 𝐴 1, 𝑥𝑖 = 𝑇 2, 𝑥𝑖 = 𝐺 3, 𝑥𝑖 = 𝐶
  • 20. DNA Sequence Representation • Per se representation: 𝑓 𝑥𝑖 = 0, 𝑥𝑖 = 𝐴 1, 𝑥𝑖 = 𝑇 2, 𝑥𝑖 = 𝐺 3, 𝑥𝑖 = 𝐶 • Binary representation: 𝑓𝑁 𝑖 𝑥𝑖 = ||𝑁𝑖 = 𝑥𝑖 ||
  • 21. DNA Sequence Representation • Per se representation: 𝑓 𝑥𝑖 = 0, 𝑥𝑖 = 𝐴 1, 𝑥𝑖 = 𝑇 2, 𝑥𝑖 = 𝐺 3, 𝑥𝑖 = 𝐶 • Binary representation: 𝑓𝑁 𝑖 𝑥𝑖 = ||𝑁𝑖 = 𝑥𝑖 || • Score Matrix representation: 𝑓𝑁 𝑖 𝑥𝑖 = 2, 𝑥𝑖 = 𝑁𝑖 1, 𝑥𝑖 = 𝑀𝑖 0, 𝑒𝑙𝑠𝑒
  • 22. DNA Sequence Representation • Per se representation: 𝑓 𝑥𝑖 = 0, 𝑥𝑖 = 𝐴 1, 𝑥𝑖 = 𝑇 2, 𝑥𝑖 = 𝐺 3, 𝑥𝑖 = 𝐶 • Binary representation: 𝑓𝑁 𝑖 𝑥𝑖 = ||𝑁𝑖 = 𝑥𝑖 || • Score Matrix representation: 𝑓𝑁 𝑖 𝑥𝑖 = 2, 𝑥𝑖 = 𝑁𝑖 1, 𝑥𝑖 = 𝑀𝑖 0, 𝑒𝑙𝑠𝑒 A T C G A 2 0 0 1 T 0 2 1 0 C 0 1 2 0 G 1 0 0 2 Score Matrix A and G belong to the purine family T and C belong to the pyrimidine family
  • 23. DNA Sequence Representation • Per se representation: 𝑓 𝑥𝑖 = 0, 𝑥𝑖 = 𝐴 1, 𝑥𝑖 = 𝑇 2, 𝑥𝑖 = 𝐺 3, 𝑥𝑖 = 𝐶 • Binary representation: 𝑓𝑁 𝑖 𝑥𝑖 = ||𝑁𝑖 = 𝑥𝑖 || • Score Matrix representation: 𝑓𝑁 𝑖 𝑥𝑖 = 2, 𝑥𝑖 = 𝑁𝑖 1, 𝑥𝑖 = 𝑀𝑖 0, 𝑒𝑙𝑠𝑒 • Weighted representation: 𝑓 𝑥𝑖 = 𝑝(𝑥𝑖|𝑖)
  • 24. DNA Sequence Representation • Per se representation: 𝑓 𝑥𝑖 = 0, 𝑥𝑖 = 𝐴 1, 𝑥𝑖 = 𝑇 2, 𝑥𝑖 = 𝐺 3, 𝑥𝑖 = 𝐶 • Binary representation: 𝑓𝑁 𝑖 𝑥𝑖 = ||𝑁𝑖 = 𝑥𝑖 || • Score Matrix representation: 𝑓𝑁 𝑖 𝑥𝑖 = 2, 𝑥𝑖 = 𝑁𝑖 1, 𝑥𝑖 = 𝑀𝑖 0, 𝑒𝑙𝑠𝑒 • Weighted representation: 𝑓 𝑥𝑖 = 𝑝(𝑥𝑖|𝑖) Examples, given the PPM the consensus TAGGTAAGT and the sequence ATGGTCGTT: A 0.3 0.6 0.1 0.0 0.0 0.6 0.7 0.2 0.1 C 0.2 0.2 0.1 0.0 0.0 0.2 0.1 0.1 0.2 G 0.1 0.1 0.7 1.0 0.0 0.1 0.1 0.5 0.1 T 0.4 0.1 0.1 0.0 1.0 0.1 0.1 0.2 0.6 Per se representation 0 1 2 2 1 3 2 1 1 Binary representation 0 0 1 1 1 0 0 0 1 Score Matrix representation 0 0 2 2 2 0 1 0 0 Weighted representation 0.3 0.1 0.7 1.0 1.0 0.2 0.1 0.2 0.6
  • 25. Feature Evaluation • Traditional machine learning classification using SVM and kNN. • The values of the parameters used were tested experimentally. • SVM: Linear kernel. • kNN: 5 neighbors, Manhattan distance.
  • 26. Feature Evaluation Results 0.00% 20.00% 40.00% 60.00% 80.00% 100.00% Per Se Binary Score Matrix Weights Accuracy Representation Test Organism: D. Melanogaster Method: SVM A Thaliana C Elegans D Melanogaster D Rerio H Sapiens 0.00% 20.00% 40.00% 60.00% 80.00% 100.00% Per Se Binary Score Matrix Weights Accuracy Representation Test Organism: D. Melanogaster Method: kNN A Thaliana C Elegans D Melanogaster D Rerio H Sapiens Donor Splice Site
  • 27. Feature Evaluation Results Acceptor Splice Site 0.00% 20.00% 40.00% 60.00% 80.00% 100.00% Per Se Binary Score Matrix Weights Accuracy Representation Test Organism: D. Melanogaster Method: kNN A Thaliana C Elegans D Melanogaster D Rerio H Sapiens0.00% 20.00% 40.00% 60.00% 80.00% 100.00% Per Se Binary Score Matrix Weights Accuracy Representation Test Organism: D.Melanogaster Method: SVM A Thaliana C Elegans D Melanogaster D Rerio H Sapiens
  • 28. Proposed Models: kNN based • Iterative algorithm. • Train a kNN classifier with the data of an organism, e.g. train on C. Elegans (source domain) and predict on A. Thaliana (target domain). • In each iteration recalculate the features for both the source and the target domain based on the predicted true splice sites. • Objective: Both source and target domain features approach target domain distribution.
  • 29. Proposed Models: kNN based Algorithm 1. kNN based approach - Represent all sequences in one of the three representations, based on the source domain data. - Repeat • Train kNN classifier with the source domain data. • Classify the target domain data. • Recalculate the PPM and/or the consensus. • Represent all sequences based on the new PPM or consensus. - Until divergence or a number of iterations.
  • 30. • Iterative algorithm. • Initiate target centroids to be the same as the source centroids and predict on target domain organism. • In each iteration recalculate the features for the target domain based on the predicted true splice sites and recalculate the target domain centroids. • The source domain centroids remain stable and contribute to a percentage to the classification. • Objective: The target centroids are “moved” closer to the target domain data. Proposed Models: kMeans based
  • 31. Proposed Models: kMeans based • Algorithm 2. kMeans based approach • Represent all sequences in one of the three representations, based on the source domain data. • Compute source domain centers. • Initialize target domain centers to be the same as the source domain centers. • Repeat • Classify the target domain data based on the function • Recalculate the PPM and/or the consensus from the target domain instances that are classified as true splice sites. • Represent the target domain sequences based on the new PPM or consensus. • Calculate the new target domain centroids. • Until divergence or a number of iterations.
  • 32. Evaluation on Proposed Approaches • In the cases where the consensus sequences and the PPMs of the source and the target domain data are similar, we don’t gain much from the transfer learning algorithms. • In the cases where the consensus sequences differ a lot, both approaches manage to increase a lot AuROC and Accuracy percentages. • kMeans based algorithm performs better than kNN based algorithm. • In particular, best results are obtained when the source domain centroids don’t contribute at all after the first iteration.
  • 33. Evaluation: Binary Sequence Representation • Accurate and stable representation. • Consensus sequence extracted from the classify data converges to target data consensus. • Example, when trained with C. Elegans data and tested on A. Thaliana data: C. Elegans Consensus: AT AT AT AT AT AT AT AT AT AT AT AT AT T T T T C A G A A. Thaliana Consensus: T T T T T T T T T T T T T T T T G C A G G Extracted Consensus: T T T T T T T T T T T T T T T T T C A G G
  • 34. 0.58 0.6 0.62 0.64 0.66 0.68 0.7 0.72 0.74 1st 2nd 3rd 4th AuROC Iteration kNN based classification A Thaliana D Melanogaster D Rerio H Sapiens 0.58 0.63 0.68 0.73 0.78 0.83 0.88 1st 2nd 3rd 4th AuROC Iteration kMeans based classification - 0% Source data contribution A Thaliana D Melanogaster D Rerio H Sapiens 0.58 0.63 0.68 0.73 0.78 1st 2nd 3rd 4th AuROC Iteration kMeans based classification - 40% Source data contribution A Thaliana D Melanogaster D Rerio H Sapiens 0.58 0.63 0.68 0.73 1st 2nd 3rd 4th AuROC Iteration kMeans based classification - 80% Source data contribution A Thaliana D Melanogaster D Rerio H Sapiens Evaluation: Binary Sequence Representation Acceptor Splice Site Train Organism: C. Elegans
  • 35. Evaluation: Score Matrix Sequence Representation • Accurate and stable representation as well. • Performs better than binary representation. • Consensus sequence extracted from the classify data converges to target data consensus. • Example, when trained with C. Elegans data and tested on A. Thaliana data: C. Elegans Consensus: AT AT AT AT AT AT AT AT AT AT AT AT AT T T T T C A G A A. Thaliana Consensus: T T T T T T T T T T T T T T T T G C A G G Extracted Consensus: T T T T T T T T T T T T T T T T T C A G G
  • 36. 0.58 0.63 0.68 0.73 0.78 0.83 1st 2nd 3rd 4th AuROC Iteration kNN based classification A Thaliana D Melanogaster D Rerio H Sapiens 0.58 0.68 0.78 0.88 0.98 1st 2nd 3rd 4th AuROC Iteration kMeans based classification - 0% Source data contribution A Thaliana D Melanogaster D Rerio H Sapiens 0.58 0.68 0.78 0.88 0.98 1st 2nd 3rd 4th AuROC Iteration kMeans based classification - 40% Source data contribution A Thaliana D Melanogaster D Rerio H Sapiens 0.58 0.63 0.68 0.73 0.78 0.83 0.88 1st 2nd 3rd 4th AuROC Iteration kMeans based classification - 80% Source data contribution A Thaliana D Melanogaster D Rerio H Sapiens Evaluation: Score Matrix Sequence Representation Acceptor Splice Site Train Organism: C. Elegans
  • 37. Evaluation: Weights Sequence Representation • Although seemed promising in the first set of experiments, it doesn’t perform well using transfer learning methods. • The PPM extracted from the classify data does not converges to target data PPM. • This was expected, as the extracted PPM was constructed using a subset of the available data. 27% 26% 24% 24% 24% 24% 25% 23% 24% 24% 24% 25% 25% 24% 24% 14% 22% 19% 100% 0% 28% 39% 39% 41% 40% 41% 41% 40% 42% 41% 43% 39% 40% 41% 40% 42% 67% 28% 25% 0% 0% 22% 19% 19% 18% 19% 19% 18% 18% 19% 19% 18% 20% 19% 19% 21% 17% 10% 37% 12% 0% 100% 35% 16% 16% 17% 17% 16% 16% 17% 16% 16% 15% 16% 17% 15% 15% 16% 9% 13% 44% 0% 0% 15% Pos. 1 Pos. 2 Pos. 3 Pos. 4 Pos. 5 Pos. 6 Pos. 7 Pos. 8 Pos. 9 Pos. 10 Pos. 11 Pos. 12 Pos. 13 Pos. 14 Pos. 15 Pos. 16 Pos. 17 Pos. 18 Pos. 19 Pos. 20 Pos. 21 C. Elegans - A. Thaliana Acceptor extracted PPM A T G C 24% 24% 22% 21% 20% 19% 20% 19% 19% 19% 21% 21% 21% 20% 20% 16% 27% 6% 100% 0% 26% 46% 47% 48% 49% 50% 51% 52% 53% 53% 52% 48% 50% 51% 51% 53% 64% 28% 28% 0% 0% 12% 17% 16% 18% 17% 17% 17% 17% 16% 16% 17% 19% 16% 16% 18% 15% 11% 39% 1% 0% 100% 54% 15% 15% 15% 15% 15% 14% 14% 14% 14% 14% 15% 15% 13% 13% 14% 11% 9% 67% 0% 0% 10% Pos. 1 Pos. 2 Pos. 3 Pos. 4 Pos. 5 Pos. 6 Pos. 7 Pos. 8 Pos. 9 Pos. 10 Pos. 11 Pos. 12 Pos. 13 Pos. 14 Pos. 15 Pos. 16 Pos. 17 Pos. 18 Pos. 19 Pos. 20 Pos. 21 A. Thaliana Acceptor target PPM A T G C
  • 38. Evaluation: Weights Sequence Representation 0.58 0.63 0.68 0.73 0.78 1st 2nd 3rd 4th AuROC Iteration kNN based classification A Thaliana D Melanogaster D Rerio H Sapiens 0.58 0.63 0.68 0.73 0.78 A Thaliana D Melanogaster D Rerio H Sapiens AuROC Iteration kMeans based classification - 0% Source data contribution 1st 2nd 3rd 4th 0.55 0.6 0.65 0.7 0.75 1st 2nd 3rd 4th AuROC Iteration kMeans based classification - 40% Source data contribution A Thaliana D Melanogaster D Rerio H Sapiens 0.58 0.63 0.68 0.73 0.78 1st 2nd 3rd 4th AuROC Iteration kMeans based classification - 80% Source data contribution A Thaliana D Melanogaster D Rerio H Sapiens Acceptor Splice Site Train Organism: C. Elegans
  • 39. Summary • The common patterns in the sequences of the five studied organisms were extracted using bioinformatics analysis. • For the classification task, only the “important” positions of the neighborhood were used. • Four DNA sequence representations were proposed, namely: • Sequence per se. • Binary representation. • Score Matrix representation. • Weighted representation. • Binary, Score Matrix and Weighted representations perform well even when using traditional machine learning.
  • 40. • Two transfer learning algorithms are proposed: • kNN based. • kMeans based. • When the patterns in the sequences are similar between organisms, transfer learning doesn’t contribute a lot as the results are already good. • When the patterns differ a lot, kMeans based algorithm with no source data contribution after first iteration, helps reducing the gap. • Best performance: Score Matrix Representation. Summary
  • 41. Future Steps • More experiments using all the available data. • Study more organisms. • Perform detailed comparison with other approaches. • Variation of the proposed transfer learning models, using in the training set in each iteration, the most certainly classified target data from the previous iteration.