1. Introduction tospectroscopy
Branch of science that involves study of interaction
of electromagnetic radiation with matter
Study of the absorption and emission of light and
other radiation by matter.
Spectroscopy deals with emission as well as
absorption spectra.
An emission spectrum is produced by the
emission of radiant energy by an excited atom.
Reference: Spectroscopy by Y.R Sharma page no. 2-3
8.
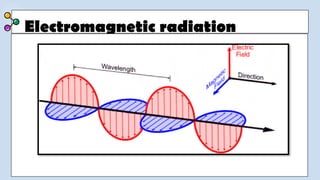
1.3 Electromagnetic radiation
Also known as radiant energy.
These are produced by the oscillation of electric
charge and magnetic field residing on the atom.
The electric and magnetic components are
mutually perpendicular to each other and are
coplanar.
These are characterised by their wavelengths or
frequencies or wavenumbers.
Reference: Spectroscopy by Y.R Sharma page number 1.
9.
Electromagnetic radiation
Theenergy carried by an electromagnetic radiation is
directly proportional to its frequency.
The emission or absorption of radiation is quantised
and each quantum of radiation is called a photon.
All types of radiations travel with the same velocity
and no medium is required for their propagation.
They can travel through vacuum.
They travel with speed of light c(3x10⁸
m/s ).
Reference: Spectroscopy by Y.R Sharma page no.1-5
Electromagnetic radiation
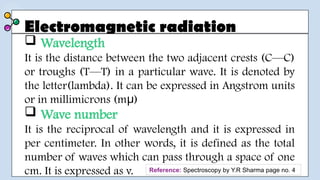
Wavelength
Itis the distance between the two adjacent crests (C—C)
or troughs (T—T) in a particular wave. It is denoted by
the letter(lambda). It can be expressed in Angstrom units
or in millimicrons (m )
μ
Wave number
It is the reciprocal of wavelength and it is expressed in
per centimeter. In other words, it is defined as the total
number of waves which can pass through a space of one
cm. It is expressed as v. Reference: Spectroscopy by Y.R Sharma page no. 4
12.
Electromagnetic radiation
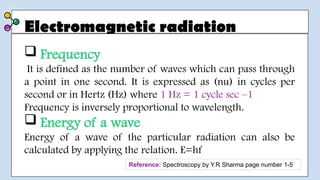
Frequency
Itis defined as the number of waves which can pass through
a point in one second. It is expressed as (nu) in cycles per
second or in Hertz (Hz) where 1 Hz = 1 cycle sec –1
Frequency is inversely proportional to wavelength.
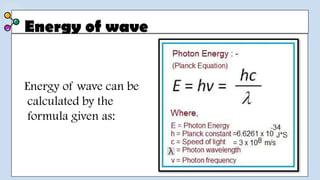
Energy of a wave
Energy of a wave of the particular radiation can also be
calculated by applying the relation. E=hf
Reference: Spectroscopy by Y.R Sharma page number 1-5
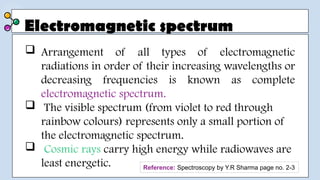
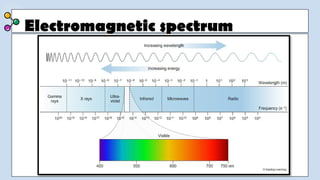
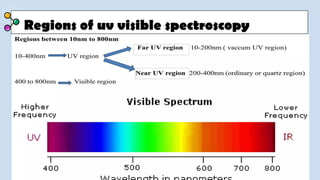
Electromagnetic spectrum
Arrangementof all types of electromagnetic
radiations in order of their increasing wavelengths or
decreasing frequencies is known as complete
electromagnetic spectrum.
The visible spectrum (from violet to red through
rainbow colours) represents only a small portion of
the electromagnetic spectrum.
Cosmic rays carry high energy while radiowaves are
least energetic. Reference: Spectroscopy by Y.R Sharma page no. 2-3
15.
Electromagnetic spectrum
Cosmicrays are used in treatment of cancer.
Microwaves have larger wavelengths and are used in
telephone transmission.
X-rays can pass through glass and muscle tissues.
Radiowaves can pass through air and used in
transmission of signals of telephone and radars.
Visible, Ultraviolet and Infra-red radiations are
used in spectroscopic techniques.
1.1 Absorption spectroscopy
If electromagnetic radiations (of certain wavelength range) are
passed through the substance under analysis for sometime, then
radiations of certain wavelengths are absorbed by the substance.
The wavelengths which are absorbed characterise some
particular functional groups present in the compound or the
compound itself.
This dark pattern of lines which correspond to the wavelengths
absorbed is called Absorption spectrum.
After absorption, the transmitted light is analysed by the
spectrometer relative to the incident light of a given frequency.
Reference: Spectroscopy by Y.R Sharma page no. 2-3
20.
1.2 Emission spectroscopy
An emission spectrum is produced by the emission of radiant energy
by an excited atom. The excitation of atoms can be brought about
thermally (by heating the substance strongly) or electrically (by
passing electric discharge through the vapours of the substance at a
very low pressure).
Energy is absorbed and electrons in the ground state are promoted to
meta-stable states.
Electrons from the meta stable state jump to the lower energy state,
then some energy of definite frequency is released as radiation.
Radiation emitted is analysed with the help of a spectroscope, an
emission spectrum is observed.
Reference: Spectroscopy by Y.R Sharma page no. 2-3
2. UV visiblespectroscopy
Absorption of electromagnetic radiation by an
organic sample in both UV(10-400nm) and visible
region(400-800nm).
Alternate title for this technique is Electronic
Spectroscopy.
Because involves the promotion of electrons (sigma,
pi and n* electrons) from the ground state to the
higher energy state.
Reference: Organic spectroscopy by Dr.Younas page no. 21
23.
2. UV visiblespectroscopy
Detection of a functional group and impurities.
to determine extent of conjugation in a system
To differentiate aromatic system from non aromatic
systems
To differentiate between cis and trans geometrical
isomers
For quantitative analysis e.g single component and
multiple component analysis.
Reference: Organic spectroscopy by Dr.Younas page no. 21
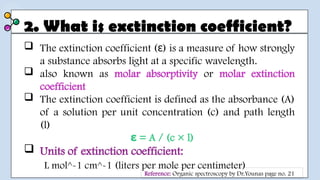
2. What isexctinction coefficient?
The extinction coefficient ( ) is a measure of how strongly
ε
a substance absorbs light at a specific wavelength.
also known as molar absorptivity or molar extinction
coefficient
The extinction coefficient is defined as the absorbance (A)
of a solution per unit concentration (c) and path length
(l)
= A / (c × l)
ε
Units of extinction coefficient:
L mol^-1 cm^-1 (liters per mole per centimeter)
Reference: Organic spectroscopy by Dr.Younas page no. 21
26.
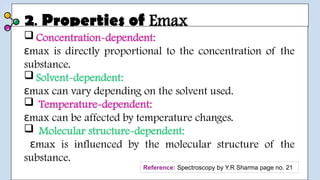
2. Properties ofEmax
Concentration-dependent:
max is directly proportional to the concentration of the
ε
substance.
Solvent-dependent:
max can vary depending on the solvent used.
ε
Temperature-dependent:
max can be affected by temperature changes.
ε
Molecular structure-dependent:
max is influenced by the molecular structure of the
ε
substance.
Reference: Spectroscopy by Y.R Sharma page no. 21
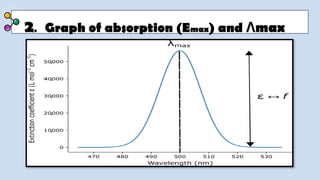
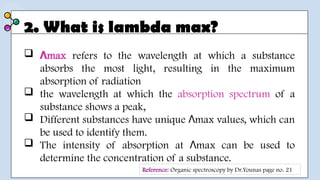
2. What islambda max?
max
Λ refers to the wavelength at which a substance
absorbs the most light, resulting in the maximum
absorption of radiation
the wavelength at which the absorption spectrum of a
substance shows a peak,
Different substances have unique max values, which can
Λ
be used to identify them.
The intensity of absorption at max can be used to
Λ
determine the concentration of a substance.
Reference: Organic spectroscopy by Dr.Younas page no. 21
29.
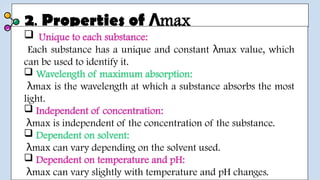
2. Properties ofmax
Λ
Unique to each substance:
Each substance has a unique and constant max value, which
λ
can be used to identify it.
Wavelength of maximum absorption:
max is the wavelength at which a substance absorbs the most
λ
light.
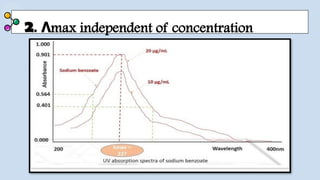
Independent of concentration:
max is independent of the concentration of the substance.
λ
Dependent on solvent:
max can vary depending on the solvent used.
λ
Dependent on temperature and pH:
max can vary slightly with temperature and pH changes.
λ
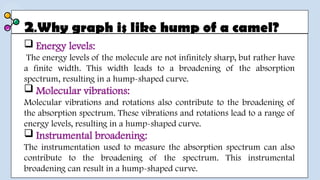
2.Why graph islike hump of a camel?
Energy levels:
The energy levels of the molecule are not infinitely sharp, but rather have
a finite width. This width leads to a broadening of the absorption
spectrum, resulting in a hump-shaped curve.
Molecular vibrations:
Molecular vibrations and rotations also contribute to the broadening of
the absorption spectrum. These vibrations and rotations lead to a range of
energy levels, resulting in a hump-shaped curve.
Instrumental broadening:
The instrumentation used to measure the absorption spectrum can also
contribute to the broadening of the spectrum. This instrumental
broadening can result in a hump-shaped curve.
32.
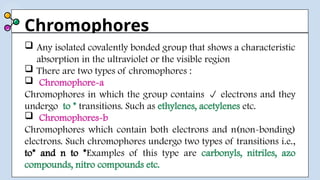
Chromophores
Any isolatedcovalently bonded group that shows a characteristic
absorption in the ultraviolet or the visible region
There are two types of chromophores :
Chromophore-a
Chromophores in which the group contains electrons and they
undergo to * transitions. Such as ethylenes, acetylenes etc.
Chromophores-b
Chromophores which contain both electrons and n(non-bonding)
electrons. Such chromophores undergo two types of transitions i.e.,
to* and n to *Examples of this type are carbonyls, nitriles, azo
compounds, nitro compounds etc.
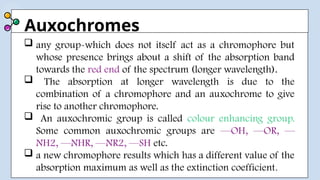
Auxochromes
any group-whichdoes not itself act as a chromophore but
whose presence brings about a shift of the absorption band
towards the red end of the spectrum (longer wavelength).
The absorption at longer wavelength is due to the
combination of a chromophore and an auxochrome to give
rise to another chromophore.
An auxochromic group is called colour enhancing group.
Some common auxochromic groups are —OH, —OR, —
NH2, —NHR, —NR2, —SH etc.
a new chromophore results which has a different value of the
absorption maximum as well as the extinction coefficient.
35.
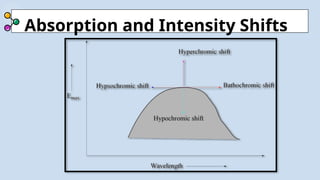
Absorption and IntensityShifts
Bathochromic effect:
When the absorption maximum is shifted towards longer
wavelength due to the presence of an auxochrome or by
the change of solvent then the effect is called bathochromic
shift. Such shift towards longer wavelength is called red
shift.
Groups like OH, CH3, OCH3 shows this effect.
Example:
Benzene shows an absorption maximum at 255nm [Emax 203] whereas
aniline absorbs at 280nm [Emax 1430]. Hence, amino (—NH2) group is
an auxochrome.
36.
Absorption and IntensityShifts
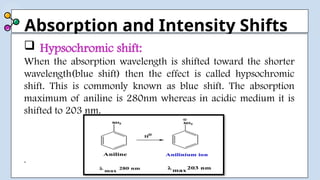
Hypsochromic shift:
When the absorption wavelength is shifted toward the shorter
wavelength(blue shift) then the effect is called hypsochromic
shift. This is commonly known as blue shift. The absorption
maximum of aniline is 280nm whereas in acidic medium it is
shifted to 203 nm.
.
37.
Absorption and IntensityShifts
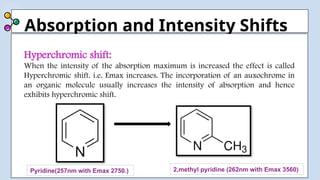
Hyperchromic shift:
When the intensity of the absorption maximum is increased the effect is called
Hyperchromic shift. i.e. Emax increases. The incorporation of an auxochrome in
an organic molecule usually increases the intensity of absorption and hence
exhibits hyperchromic shift.
Pyridine(257nm with Emax 2750.) 2,methyl pyridine (262nm with Emax 3560)
38.
Absorption and IntensityShifts
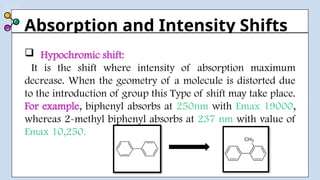
Hypochromic shift:
It is the shift where intensity of absorption maximum
decrease. When the geometry of a molecule is distorted due
to the introduction of group this Type of shift may take place.
For example, biphenyl absorbs at 250nm with Emax 19000,
whereas 2-methyl biphenyl absorbs at 237 nm with value of
Emax 10,250.
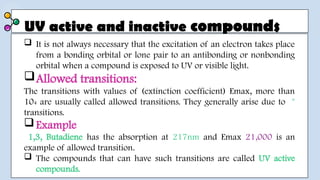
UV active andinactive compounds
It is not always necessary that the excitation of an electron takes place
from a bonding orbital or lone pair to an antibonding or nonbonding
orbital when a compound is exposed to UV or visible light.
Allowed transitions:
The transitions with values of (extinction coefficient) Emax, more than
104 are usually called allowed transitions. They generally arise due to *
transitions.
Example
1,3, Butadiene has the absorption at 217nm and Emax 21,000 is an
example of allowed transition.
The compounds that can have such transitions are called UV active
compounds.
41.
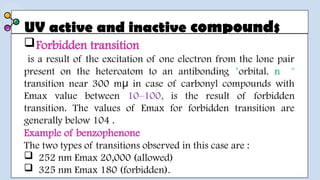
UV active andinactive compounds
Forbidden transition
is a result of the excitation of one electron from the lone pair
present on the heteroatom to an antibonding *orbital. n *
transition near 300 m in case of carbonyl compounds with
μ
Emax value between 10–100, is the result of forbidden
transition. The values of Emax for forbidden transition are
generally below 104 .
Example of benzophenone
The two types of transitions observed in this case are :
252 nm Emax 20,000 (allowed)
325 nm Emax 180 (forbidden).
42.
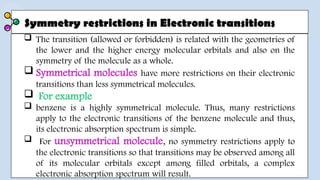
Symmetry restrictions inElectronic transitions
The transition (allowed or forbidden) is related with the geometries of
the lower and the higher energy molecular orbitals and also on the
symmetry of the molecule as a whole.
Symmetrical molecules have more restrictions on their electronic
transitions than less symmetrical molecules.
For example
benzene is a highly symmetrical molecule. Thus, many restrictions
apply to the electronic transitions of the benzene molecule and thus,
its electronic absorption spectrum is simple.
For unsymmetrical molecule, no symmetry restrictions apply to
the electronic transitions so that transitions may be observed among all
of its molecular orbitals except among filled orbitals, a complex
electronic absorption spectrum will result.
43.
Symmetry restrictions inElectronic transitions
To decide whether the transition is allowed or forbidden for
such molecules, it is important to consider:
the geometry of the molecular orbital in the ground state
the geometry of the molecular orbital in the excited state
the orientation of the electric dipole of the incident light
that might induce the transition.
NOTE:
The transition will be an allowed transition if the above three
factors have an appropriate symmetry relationship.
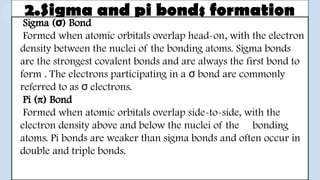
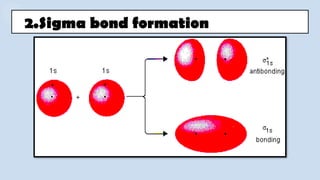
2.Sigma and pibonds formation
Sigma ( ) Bond
σ
Formed when atomic orbitals overlap head-on, with the electron
density between the nuclei of the bonding atoms. Sigma bonds
are the strongest covalent bonds and are always the first bond to
form . The electrons participating in a bond are commonly
σ
referred to as electrons.
σ
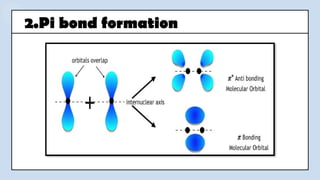
Pi (π) Bond
Formed when atomic orbitals overlap side-to-side, with the
electron density above and below the nuclei of the bonding
atoms. Pi bonds are weaker than sigma bonds and often occur in
double and triple bonds.
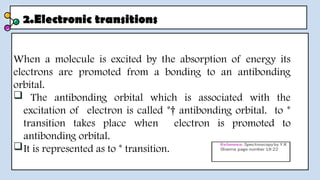
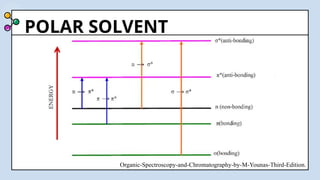
2.Electronic transitions
When amolecule is excited by the absorption of energy its
electrons are promoted from a bonding to an antibonding
orbital.
The antibonding orbital which is associated with the
excitation of electron is called *† antibonding orbital. to *
transition takes place when electron is promoted to
antibonding orbital.
It is represented as to * transition.
50.
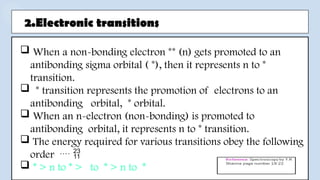
2.Electronic transitions
Whena non-bonding electron ** (n) gets promoted to an
antibonding sigma orbital ( *), then it represents n to *
transition.
* transition represents the promotion of electrons to an
antibonding orbital, * orbital.
When an n-electron (non-bonding) is promoted to
antibonding orbital, it represents n to * transition.
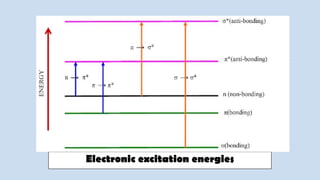
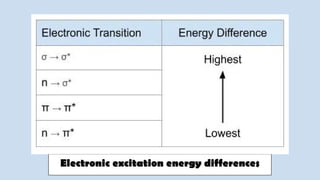
The energy required for various transitions obey the following
order
* > n to * > to * > n to *
2.1 to*transition
Itis a high energy process since bonds are, in general, very
strong.
Organic compounds in which all the valence shell electrons
are involved in the formation of sigma bonds do not show
absorption in the normal ultra-violet region 180–400 m .
μ
. For saturated hydrocarbons, like methane, propane etc.
absorption occurs near 150 m .
μ
54.
2.1 to*transition
Theusual spectroscopic technique cannot be
used below 200 m , since oxygen begins to
μ
absorb strongly.
Thus, the region below 200 m is commonly
μ
called Vacuum Ultraviolet region.
For example:
methane,ethane propane.
55.
2.2 nto* transitions
This type of transition takes place in saturated compounds
containing one hetero atom with unshared pair of electrons .
Some compounds undergoing this type of transitions are
saturated halides, alcohols, ethers, aldehydes, ketones, amines
etc.
Such transitions require comparatively less energy than that
required for * transitions.
Water absorbs at 167 m, methyl alcohol at 174 m and
μ
methyl chloride absorbs at 169 m .
μ
56.
2.2 nto* transitions
In saturated alkyl halides, the energy required for transition
decreases with the increase in the size of the halogen atom.
compare nto * transition in methyl chloride and methyl iodide.
Due to the greater electronegativity of chlorine atom, the n
electrons on chlorine atom are difficult to excite*. The
absorption maximum for methyl chloride is 172–175mμ
whereas that for methyl iodide is 258 .
57.
2.3 * transitions
This type of transition occurs in the unsaturated centres of
the molecule.
In compounds containing double or triple bonds and also in
aromatics.
The excitation of electron requires smaller energy and
transition of this type occurs at longer wavelength.
A electron of a double bond is excited to * orbital.
For example:
Alkenes, alkynes, carbonyl compounds, cyanides, azo
compounds .
58.
2.4 nto *transitions
In this type of transition, an electron of unshared
electron pair on hetero atom gets excited to *
antibonding orbital.
This type of transition requires least amount of energy
out of all the transitions discussed above and hence
occurs at longer wavelengths.
59.
2.4 nto *transitions
For example:
Aldehyde ,ketones,esters,carboxlic acids.
Saturated aldehydes show both the types of
transitions, low energy n to * and high energy *
occuring around 290 m and 180 m respectively.
μ μ
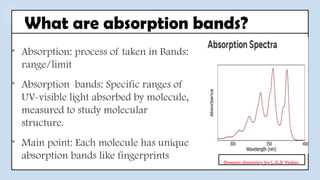
• Absorption: processof taken in Bands:
range/limit
• Absorption bands: Specific ranges of
UV-visible light absorbed by molecule,
measured to study molecular
structure.
• Main point: Each molecule has unique
absorption bands like fingerprints
What are absorption bands?
Organic chemistry by L.G.D Yadav
62.
●Here are someof the main points we will discuss for
the formation of absorption bands:
1-Absorption Mechanism
2-Why sharp bands are not formed?
3-Spectral overlap
Formation of absorption bands
63.
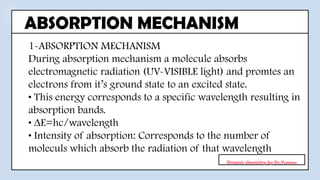
1-ABSORPTION MECHANISM
During absorptionmechanism a molecule absorbs
electromagnetic radiation (UV-VISIBLE light) and promtes an
electrons from it’s ground state to an excited state.
• This energy corresponds to a specific wavelength resulting in
absorption bands.
• ∆E=hc/wavelength
• Intensity of absorption: Corresponds to the number of
moleculs which absorb the radiation of that wavelength
ABSORPTION MECHANISM
Organic chemistry by Dr.Yunous
64.
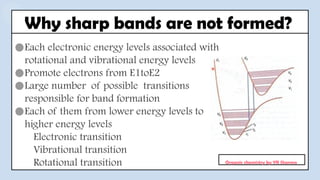
●Each electronic energylevels associated with
rotational and vibrational energy levels
●Promote electrons from E1toE2
●Large number of possible transitions
responsible for band formation
●Each of them from lower energy levels to
higher energy levels
Electronic transition
Vibrational transition
Rotational transition
Why sharp bands are not formed?
Organic chemistry by YR Sharma
65.
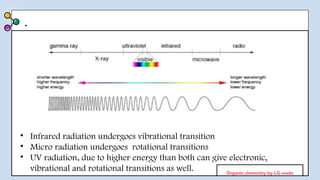
.
• Infrared radiationundergoes vibrational transition
• Micro radiation undergoes rotational transitions
• UV radiation, due to higher energy than both can give electronic,
vibrational and rotational transitions as well. Organic chemistry by LG wade
66.
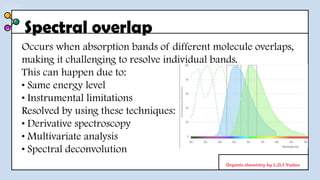
Spectral overlap
Occurs whenabsorption bands of different molecule overlaps,
making it challenging to resolve individual bands.
This can happen due to:
• Same energy level
• Instrumental limitations
Resolved by using these techniques:
• Derivative spectroscopy
• Multivariate analysis
• Spectral deconvolution
Organic chemistry by L.D.S Yadav
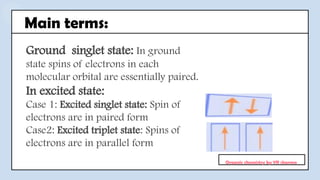
Ground singlet state:In ground
state spins of electrons in each
molecular orbital are essentially paired.
In excited state:
Case 1: Excited singlet state: Spin of
electrons are in paired form
Case2: Excited triplet state: Spins of
electrons are in parallel form
Main terms:
Organic chemistry by YR sharma
69.
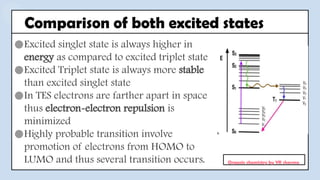
●Excited singlet stateis always higher in
energy as compared to excited triplet state
●Excited Triplet state is always more stable
than excited singlet state
●In TES electrons are farther apart in space
thus electron-electron repulsion is
minimized
●Highly probable transition involve
promotion of electrons from HOMO to
LUMO and thus several transition occurs.
Comparison of both excited states
Organic chemistry by YR sharma
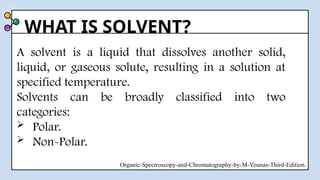
WHAT IS SOLVENT?
Asolvent is a liquid that dissolves another solid,
liquid, or gaseous solute, resulting in a solution at
specified temperature.
Solvents can be broadly classified into two
categories:
Polar.
Non-Polar.
Organic-Spectroscopy-and-Chromatography-by-M-Younas-Third-Edition.
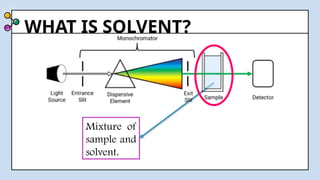
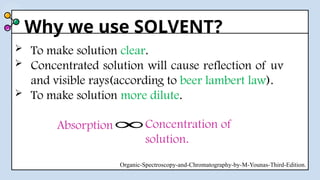
Why we useSOLVENT?
To make solution clear.
Concentrated solution will cause reflection of uv
and visible rays(according to beer lambert law).
To make solution more dilute.
Organic-Spectroscopy-and-Chromatography-by-M-Younas-Third-Edition.
Absorption Concentration of
solution.
∞
74.
CHOICE OF SOLVENT:
Benzene,chloroform , carbon tetrachloride cannot be
used because they absorb in the range of 240-280 nm.
It should not itself absorb radiations between 200-
800nm. So it should be saturated.
It should be less polar so that it has minimum interaction
with the solute molecules.
Pavia-Introduction-to-Spectroscopy.
75.
EFFECT OF SOLVENT
A drug may show varied spectrum at particular
wavelength in one particular condition but shall
absorb partially at the same wavelength in another
conditions.
This variation depend upon
1.Nature of solvent
2.Nature of the solute
Organic-Spectroscopy-and-Chromatography-by-M-Younas-Third-Edition.
76.
EFFECT OF SOLVENT
Thesolvent exerts a profound influence on the quality
and shape of spectrum.
A drug may absorb a maximum radiation energy at
particular wavelength in one solvent but shall
absorb partially at the same wavelength in another
solvent.
For example:
acetone in n-hexane lambda max at 279nm.
Acetone in water lambda max at 264.5nm.
Organic-Spectroscopy-and-Chromatography-by-M-Younas-Third-Edition.
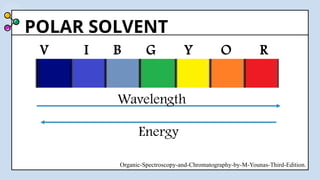
77.
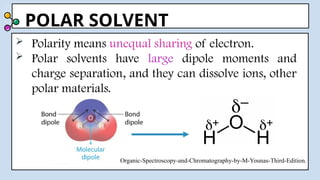
POLAR SOLVENT
Polaritymeans unequal sharing of electron.
Polar solvents have large dipole moments and
charge separation, and they can dissolve ions, other
polar materials.
Organic-Spectroscopy-and-Chromatography-by-M-Younas-Third-Edition.
78.
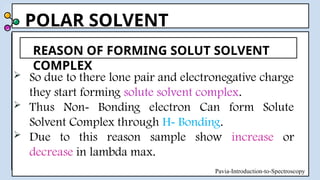
POLAR SOLVENT
Sodue to there lone pair and electronegative charge
they start forming solute solvent complex.
Thus Non- Bonding electron Can form Solute
Solvent Complex through H- Bonding.
Due to this reason sample show increase or
decrease in lambda max.
REASON OF FORMING SOLUT SOLVENT
COMPLEX
Pavia-Introduction-to-Spectroscopy
79.
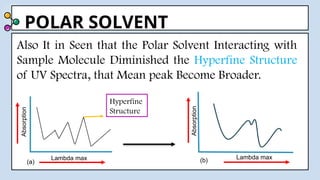
POLAR SOLVENT
Also Itin Seen that the Polar Solvent Interacting with
Sample Molecule Diminished the Hyperfine Structure
of UV Spectra, that Mean peak Become Broader.
Lambda max
Absorption
Lambda max
Absorption
Hyperfine
Structure
(a) (b)
POLAR SOLVENT
Due topolar solvent the energy difference between
bonding and antibonding orbital increase or decrease.
This increase and decrease depend upon the type of
transition.
Mostly;
Pi-pi*
n-pi*
Organic-Spectroscopy-and-Chromatography-by-M-Younas-Third-Edition.
83.
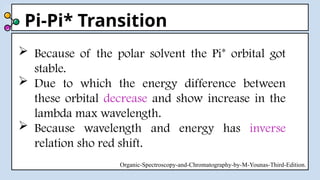
POLAR SOLVENT
Thesample like C=O show both pi-pi* and n-pi*
transition.
Due to solvent polarity band undergoes red shift.
Since a pi* orbital is more polar than a n orbital
so it will be get stable due to polar solvent. As a
result, the energy difference between the two
states decreases.
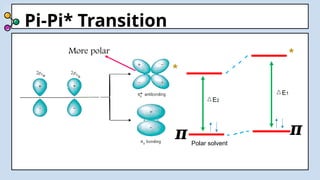
Pi-Pi* Transition
..
..
..
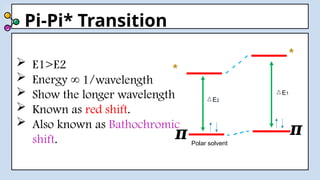
Pi-Pi* Transition
E2
E1
Polar solvent
E1>E2
Energy ∞
Show the longer wavelength
Known as red shift.
Also known as Bathochromic
shift.
1/wavelength
*
𝝅
𝝅
*
86.
Pi-Pi* Transition
Becauseof the polar solvent the Pi* orbital got
stable.
Due to which the energy difference between
these orbital decrease and show increase in the
lambda max wavelength.
Because wavelength and energy has inverse
relation sho red shift.
Organic-Spectroscopy-and-Chromatography-by-M-Younas-Third-Edition.
87.
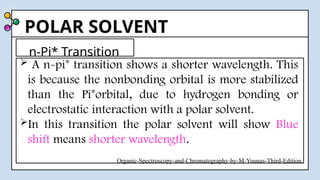
POLAR SOLVENT
n-Pi* Transition
A n-pi* transition shows a shorter wavelength. This
is because the nonbonding orbital is more stabilized
than the Pi*orbital, due to hydrogen bonding or
electrostatic interaction with a polar solvent.
In this transition the polar solvent will show Blue
shift means shorter wavelength.
Organic-Spectroscopy-and-Chromatography-by-M-Younas-Third-Edition.
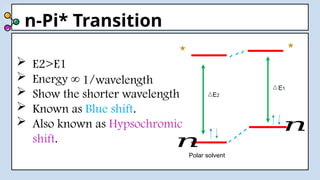
88.
n-Pi* Transition
E2
E1
Polar solvent
E2>E1
Energy ∞
Show the shorter wavelength
Known as Blue shift.
Also known as Hypsochromic
shift.
1/wavelength
*
*
𝑛
𝑛
89.
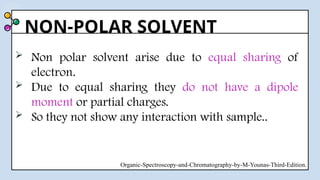
NON-POLAR SOLVENT
Nonpolar solvent arise due to equal sharing of
electron.
Due to equal sharing they do not have a dipole
moment or partial charges.
So they not show any interaction with sample..
Organic-Spectroscopy-and-Chromatography-by-M-Younas-Third-Edition.
90.
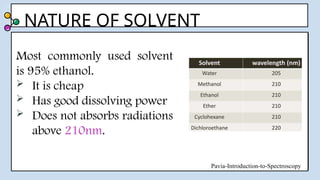
NATURE OF SOLVENT
Mostcommonly used solvent is 95% ethanol.
It is cheap
Has good dissolving power
Does not absorbs radiations above 210nm.
Most commonly used solvent
is 95% ethanol.
It is cheap
Has good dissolving power
Does not absorbs radiations
above 210nm.
Pavia-Introduction-to-Spectroscopy
91.
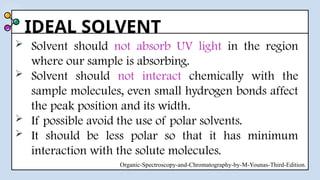
IDEAL SOLVENT
Solventshould not absorb UV light in the region
where our sample is absorbing.
Solvent should not interact chemically with the
sample molecules, even small hydrogen bonds affect
the peak position and its width.
If possible avoid the use of polar solvents.
It should be less polar so that it has minimum
interaction with the solute molecules.
Organic-Spectroscopy-and-Chromatography-by-M-Younas-Third-Edition.


![Absorption and Intensity Shifts
Bathochromic effect:
When the absorption maximum is shifted towards longer
wavelength due to the presence of an auxochrome or by
the change of solvent then the effect is called bathochromic
shift. Such shift towards longer wavelength is called red
shift.
Groups like OH, CH3, OCH3 shows this effect.
Example:
Benzene shows an absorption maximum at 255nm [Emax 203] whereas
aniline absorbs at 280nm [Emax 1430]. Hence, amino (—NH2) group is
an auxochrome.](https://image.slidesharecdn.com/spectroscopyfinal-250422164242-431b98b4/85/spectroscopyyyyyyyyyyyyyyyyyy-Final-pptx-35-320.jpg)