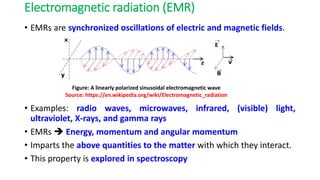
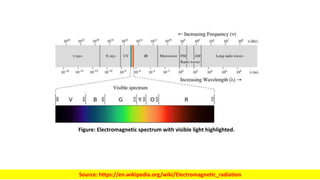
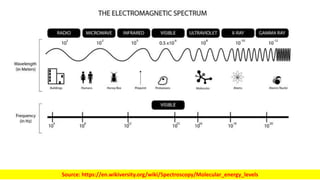
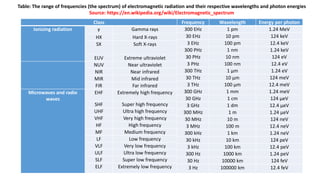
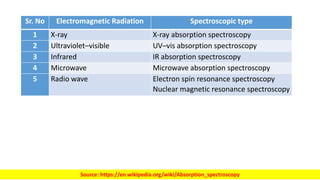
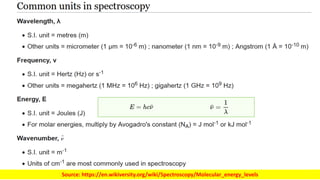
Electromagnetic radiation
and absorption spectroscopy
Course Outcomes (COs):
At the end of the course, the students will be able to:
1. categorize different analytical techniques on the basis of their operational principle
2. understand how to apply the basic principles of analytical techniques in handling the analytical instruments
3. design basic analytical instruments and tailor the specifications of different analytical instruments
4. determine unknown concentrations and obtain structural information of analytes
5. understand the strengths, limitations, and use of the analytical techniques for problem-solving
Electromagnetic radiation (EMR)
• EMRs are synchronized oscillations of electric and magnetic fields.
• Examples: radio waves, microwaves, infrared, (visible) light,
ultraviolet, X-rays, and gamma rays
• EMRs  Energy, momentum and angular momentum
• Imparts the above quantities to the matter with which they interact.
• This property is explored in spectroscopy
Figure: A linearly polarized sinusoidal electromagnetic wave
Source: https://en.wikipedia.org/wiki/Electromagnetic_radiation
Figure: Electromagnetic spectrum with visible light highlighted.
Source: https://en.wikipedia.org/wiki/Electromagnetic_radiation
Source: https://en.wikiversity.org/wiki/Spectroscopy/Molecular_energy_levels
Class Frequency Wavelength Energy per photon
Ionizing radiation γ Gamma rays 300 EHz 1 pm 1.24 MeV
30 EHz 10 pm 124 keV
HX Hard X-rays
3 EHz 100 pm 12.4 keV
SX Soft X-rays
300 PHz 1 nm 1.24 keV
30 PHz 10 nm 124 eV
EUV Extreme ultraviolet
3 PHz 100 nm 12.4 eV
NUV Near ultraviolet
300 THz 1 μm 1.24 eV
NIR Near infrared
30 THz 10 μm 124 meV
MIR Mid infrared
3 THz 100 μm 12.4 meV
FIR Far infrared
300 GHz 1 mm 1.24 meV
Microwaves and radio
waves
EHF Extremely high frequency
30 GHz 1 cm 124 μeV
SHF Super high frequency 3 GHz 1 dm 12.4 μeV
UHF Ultra high frequency 300 MHz 1 m 1.24 μeV
VHF Very high frequency 30 MHz 10 m 124 neV
HF High frequency 3 MHz 100 m 12.4 neV
MF Medium frequency 300 kHz 1 km 1.24 neV
LF Low frequency 30 kHz 10 km 124 peV
VLF Very low frequency 3 kHz 100 km 12.4 peV
ULF Ultra low frequency 300 Hz 1000 km 1.24 peV
SLF Super low frequency 30 Hz 10000 km 124 feV
ELF Extremely low frequency 3 Hz 100000 km 12.4 feV
Table: The range of frequencies (the spectrum) of electromagnetic radiation and their respective wavelengths and photon energies
Source: https://en.wikipedia.org/wiki/Electromagnetic_spectrum
Sr. No Electromagnetic Radiation Spectroscopic type
1 X-ray X-ray absorption spectroscopy
2 Ultraviolet–visible UV–vis absorption spectroscopy
3 Infrared IR absorption spectroscopy
4 Microwave Microwave absorption spectroscopy
5 Radio wave Electron spin resonance spectroscopy
Nuclear magnetic resonance spectroscopy
Source: https://en.wikipedia.org/wiki/Absorption_spectroscopy
Source: https://en.wikiversity.org/wiki/Spectroscopy/Molecular_energy_levels
Basics of spectroscopy
• Absorption: Transfer of energy from the EM radiation to a molecule
• Absorption spectroscopy  Lines of patterns  Functional group
identification, and Chemical structure determination
• Emission: The internal energy of the molecule is converted to EM
radiation
• Emission spectroscopy
• Ground energy level: Rotational energy, vibrational energy, electronic
energy
𝐸𝐺 = 𝐸𝑅 + 𝐸𝑉 + 𝐸𝐸
• When wavelength of natural frequencies strike a molecule, the
molecule is raised to excited state level
∆𝐸 = 286,000
𝑘𝑐𝑎𝑙
𝑚𝑜𝑙𝑒
• Molecules return to ground state in 10-9 to 10-8 sec  Releases
energy.
Source: https://en.wikiversity.org/wiki/Spectroscopy/Molecular_energy_levels
Source:
https://chem.libretexts.org/Courses/Solano_Community_College/Chem_160/Chapter_07%3A_Atomic_Structure_and_Periodi
city/7.03_The_Atomic_Spectrum_of_Hydrogen
Source: Instrumental methods of analysis- Mahadik and Sathiyanarayanan (Nirali Prakashan)
Source: https://en.wikiversity.org/wiki/Spectroscopy/Molecular_energy_levels
Source: Instrumental methods of analysis- Mahadik and Sathiyanarayanan (Nirali Prakashan)
Forbidden
transitions
Types of electrons
• σ (sigma) electrons: Found in fully saturated systems (e.g., alkanes)
 Large amount of energy is needed for excitation  Usually do not
show absorption in the UV region  In some cases, σ to π*
transition to give hyper conjugation
• n (non-bonding) electrons: Valance electrons that do not participate
in chemical bonding  Principally located at the atomic orbital of
nitrogen, oxygen, sulphur and halogen as lone pairs  n to π*
transition in UV region
• π electrons: Mobile electrons (atomic p-orbital electrons)  Found in
unsaturated compounds in multiple bonds  π to π* transition in
UV-visible
Absorption spectra
• Due to electronic level transitions in the groups present in a
molecule.
• Chromophore: The group that absorbs in visible and UV wavelengths
• Auxochrome: Groups that have non-bonding valence electrons, and
do not absorb radiation at wavelengths >200 nm  Modify and shift
the absorption bands of the chromophores
• Spectral shifts
Source: Instrumental methods of analysis- Mahadik and Sathiyanarayanan (Nirali Prakashan)
Source: https://www.slideshare.net/Santachem/uv-visible-spectroscopy
Bathochromic shift
Hypsochromic shift
Nature of Shift Descriptive Term
To Longer Wavelength Bathochromic
To Shorter Wavelength Hypsochromic
To Greater Absorbance Hyperchromic
To Lower Absorbance Hypochromic
Terminology for Absorption Shifts
THANKS

Chapter 1- Electromagnetic radiation and absorption spectroscopy.pptx

  • 1.
    Electromagnetic radiation and absorptionspectroscopy Course Outcomes (COs): At the end of the course, the students will be able to: 1. categorize different analytical techniques on the basis of their operational principle 2. understand how to apply the basic principles of analytical techniques in handling the analytical instruments 3. design basic analytical instruments and tailor the specifications of different analytical instruments 4. determine unknown concentrations and obtain structural information of analytes 5. understand the strengths, limitations, and use of the analytical techniques for problem-solving
  • 2.
    Electromagnetic radiation (EMR) •EMRs are synchronized oscillations of electric and magnetic fields. • Examples: radio waves, microwaves, infrared, (visible) light, ultraviolet, X-rays, and gamma rays • EMRs  Energy, momentum and angular momentum • Imparts the above quantities to the matter with which they interact. • This property is explored in spectroscopy Figure: A linearly polarized sinusoidal electromagnetic wave Source: https://en.wikipedia.org/wiki/Electromagnetic_radiation
  • 3.
    Figure: Electromagnetic spectrumwith visible light highlighted. Source: https://en.wikipedia.org/wiki/Electromagnetic_radiation
  • 4.
  • 5.
    Class Frequency WavelengthEnergy per photon Ionizing radiation γ Gamma rays 300 EHz 1 pm 1.24 MeV 30 EHz 10 pm 124 keV HX Hard X-rays 3 EHz 100 pm 12.4 keV SX Soft X-rays 300 PHz 1 nm 1.24 keV 30 PHz 10 nm 124 eV EUV Extreme ultraviolet 3 PHz 100 nm 12.4 eV NUV Near ultraviolet 300 THz 1 μm 1.24 eV NIR Near infrared 30 THz 10 μm 124 meV MIR Mid infrared 3 THz 100 μm 12.4 meV FIR Far infrared 300 GHz 1 mm 1.24 meV Microwaves and radio waves EHF Extremely high frequency 30 GHz 1 cm 124 μeV SHF Super high frequency 3 GHz 1 dm 12.4 μeV UHF Ultra high frequency 300 MHz 1 m 1.24 μeV VHF Very high frequency 30 MHz 10 m 124 neV HF High frequency 3 MHz 100 m 12.4 neV MF Medium frequency 300 kHz 1 km 1.24 neV LF Low frequency 30 kHz 10 km 124 peV VLF Very low frequency 3 kHz 100 km 12.4 peV ULF Ultra low frequency 300 Hz 1000 km 1.24 peV SLF Super low frequency 30 Hz 10000 km 124 feV ELF Extremely low frequency 3 Hz 100000 km 12.4 feV Table: The range of frequencies (the spectrum) of electromagnetic radiation and their respective wavelengths and photon energies Source: https://en.wikipedia.org/wiki/Electromagnetic_spectrum
  • 6.
    Sr. No ElectromagneticRadiation Spectroscopic type 1 X-ray X-ray absorption spectroscopy 2 Ultraviolet–visible UV–vis absorption spectroscopy 3 Infrared IR absorption spectroscopy 4 Microwave Microwave absorption spectroscopy 5 Radio wave Electron spin resonance spectroscopy Nuclear magnetic resonance spectroscopy Source: https://en.wikipedia.org/wiki/Absorption_spectroscopy
  • 7.
  • 8.
    Basics of spectroscopy •Absorption: Transfer of energy from the EM radiation to a molecule • Absorption spectroscopy  Lines of patterns  Functional group identification, and Chemical structure determination • Emission: The internal energy of the molecule is converted to EM radiation • Emission spectroscopy • Ground energy level: Rotational energy, vibrational energy, electronic energy 𝐸𝐺 = 𝐸𝑅 + 𝐸𝑉 + 𝐸𝐸 • When wavelength of natural frequencies strike a molecule, the molecule is raised to excited state level ∆𝐸 = 286,000 𝑘𝑐𝑎𝑙 𝑚𝑜𝑙𝑒 • Molecules return to ground state in 10-9 to 10-8 sec  Releases energy.
  • 9.
  • 10.
  • 11.
    Source: Instrumental methodsof analysis- Mahadik and Sathiyanarayanan (Nirali Prakashan)
  • 12.
  • 13.
  • 14.
    Source: Instrumental methodsof analysis- Mahadik and Sathiyanarayanan (Nirali Prakashan) Forbidden transitions
  • 15.
    Types of electrons •σ (sigma) electrons: Found in fully saturated systems (e.g., alkanes)  Large amount of energy is needed for excitation  Usually do not show absorption in the UV region  In some cases, σ to π* transition to give hyper conjugation • n (non-bonding) electrons: Valance electrons that do not participate in chemical bonding  Principally located at the atomic orbital of nitrogen, oxygen, sulphur and halogen as lone pairs  n to π* transition in UV region • π electrons: Mobile electrons (atomic p-orbital electrons)  Found in unsaturated compounds in multiple bonds  π to π* transition in UV-visible
  • 16.
    Absorption spectra • Dueto electronic level transitions in the groups present in a molecule. • Chromophore: The group that absorbs in visible and UV wavelengths • Auxochrome: Groups that have non-bonding valence electrons, and do not absorb radiation at wavelengths >200 nm  Modify and shift the absorption bands of the chromophores • Spectral shifts Source: Instrumental methods of analysis- Mahadik and Sathiyanarayanan (Nirali Prakashan)
  • 17.
    Source: Instrumental methodsof analysis- Mahadik and Sathiyanarayanan (Nirali Prakashan)
  • 18.
    Source: https://www.slideshare.net/Santachem/uv-visible-spectroscopy Bathochromic shift Hypsochromicshift Nature of Shift Descriptive Term To Longer Wavelength Bathochromic To Shorter Wavelength Hypsochromic To Greater Absorbance Hyperchromic To Lower Absorbance Hypochromic Terminology for Absorption Shifts
  • 19.