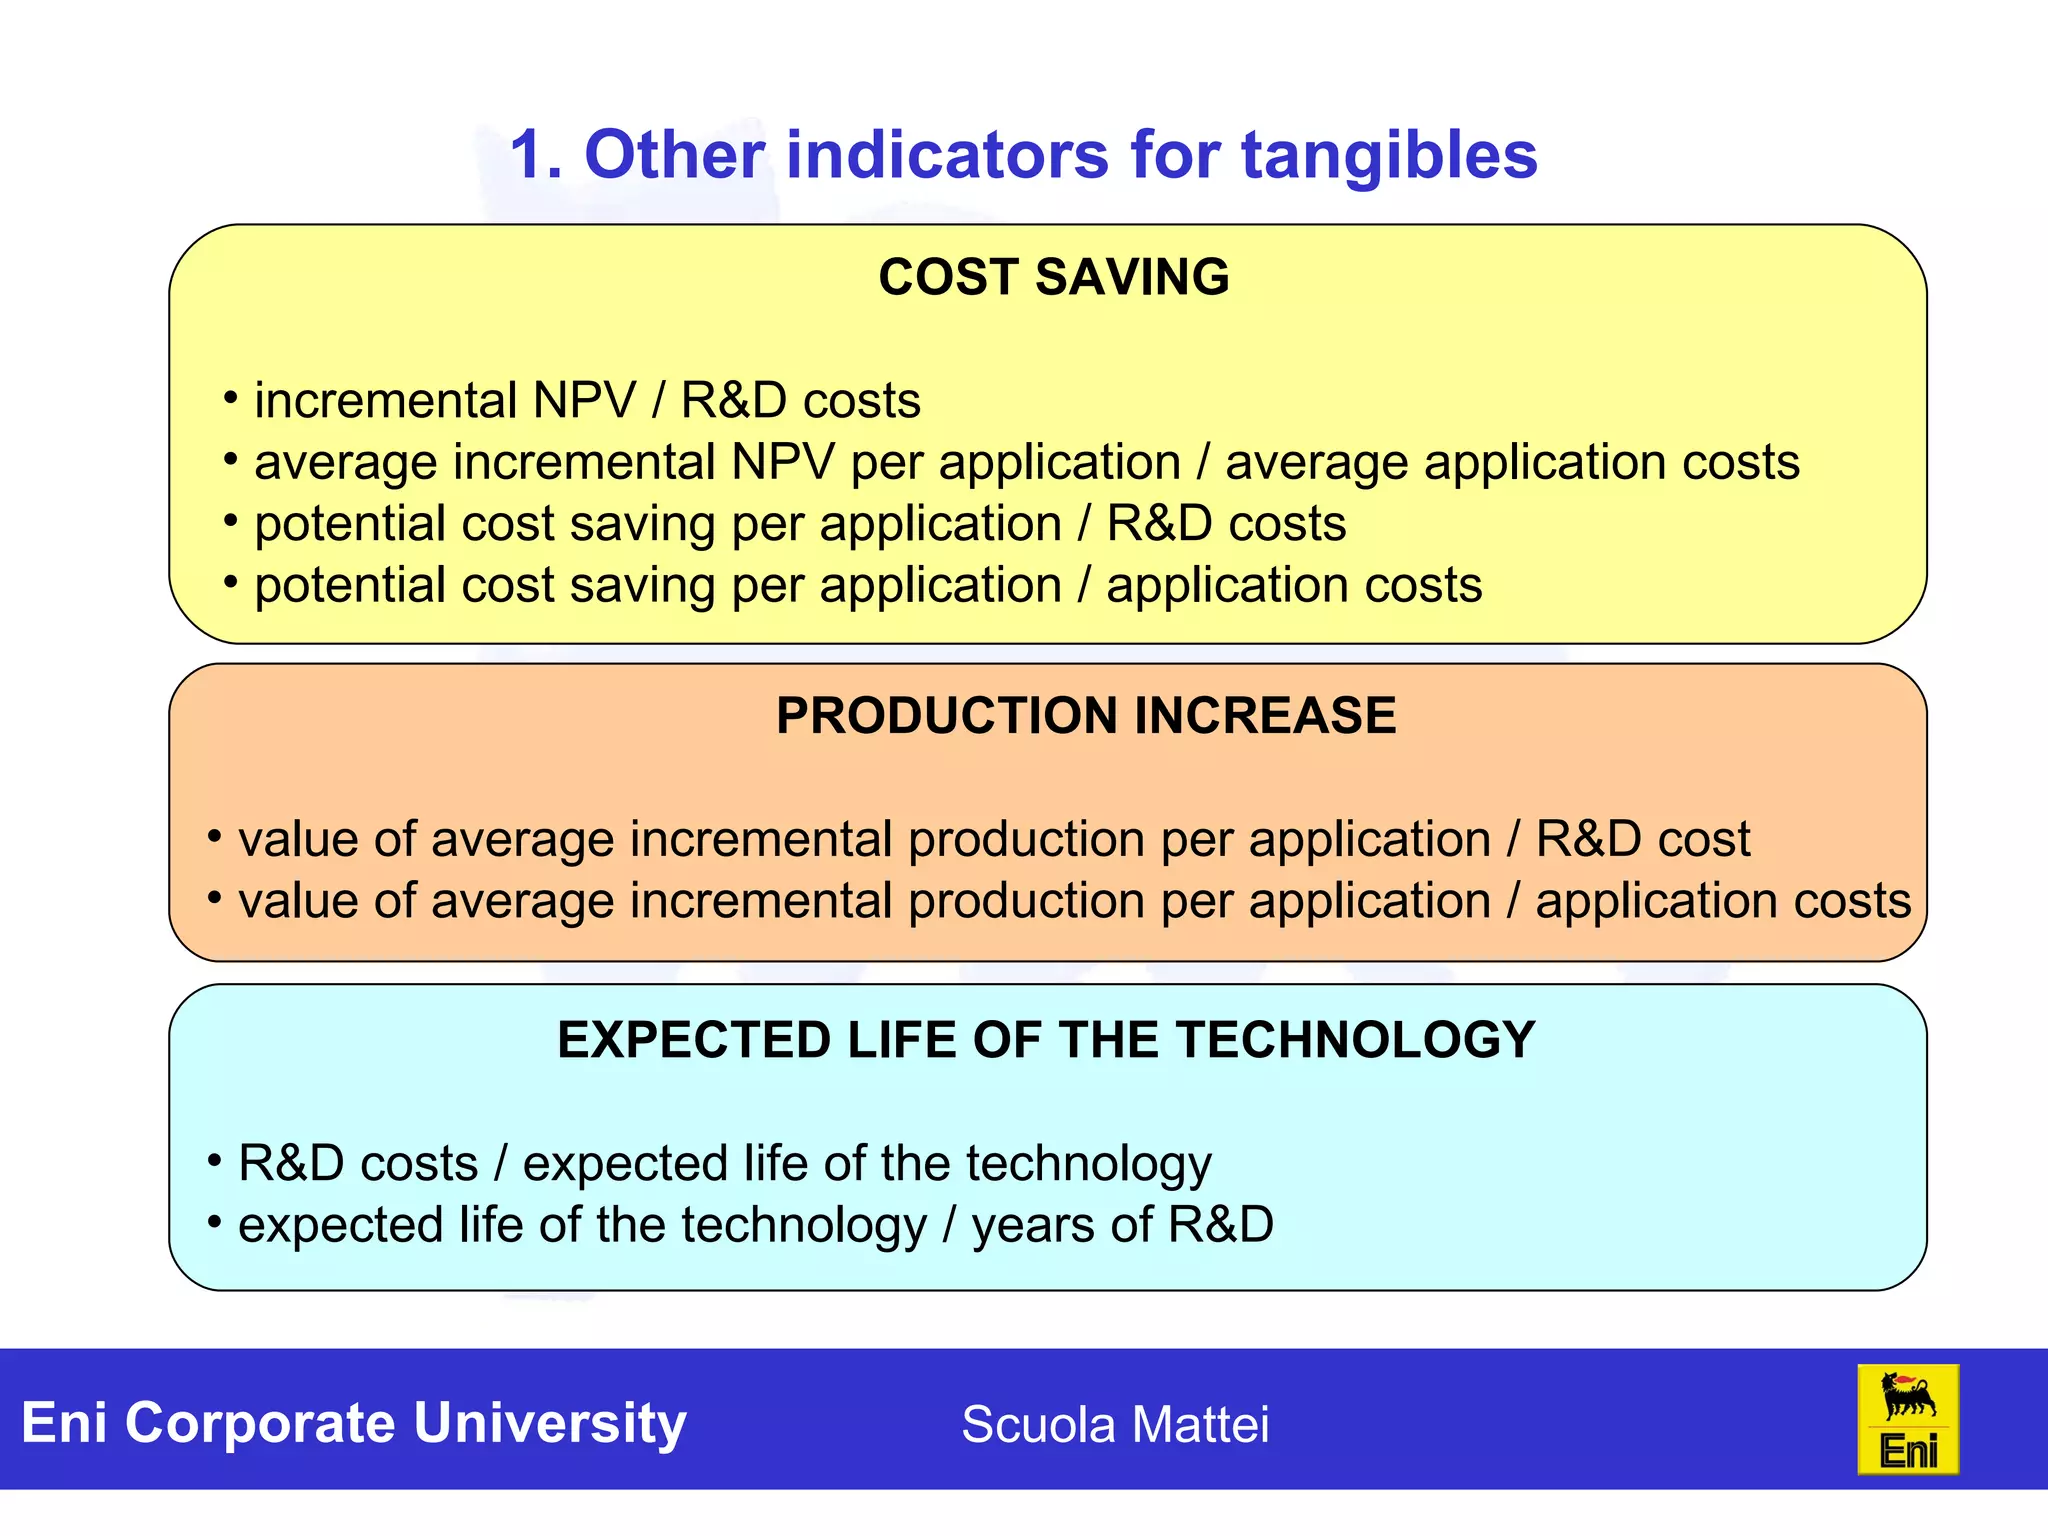
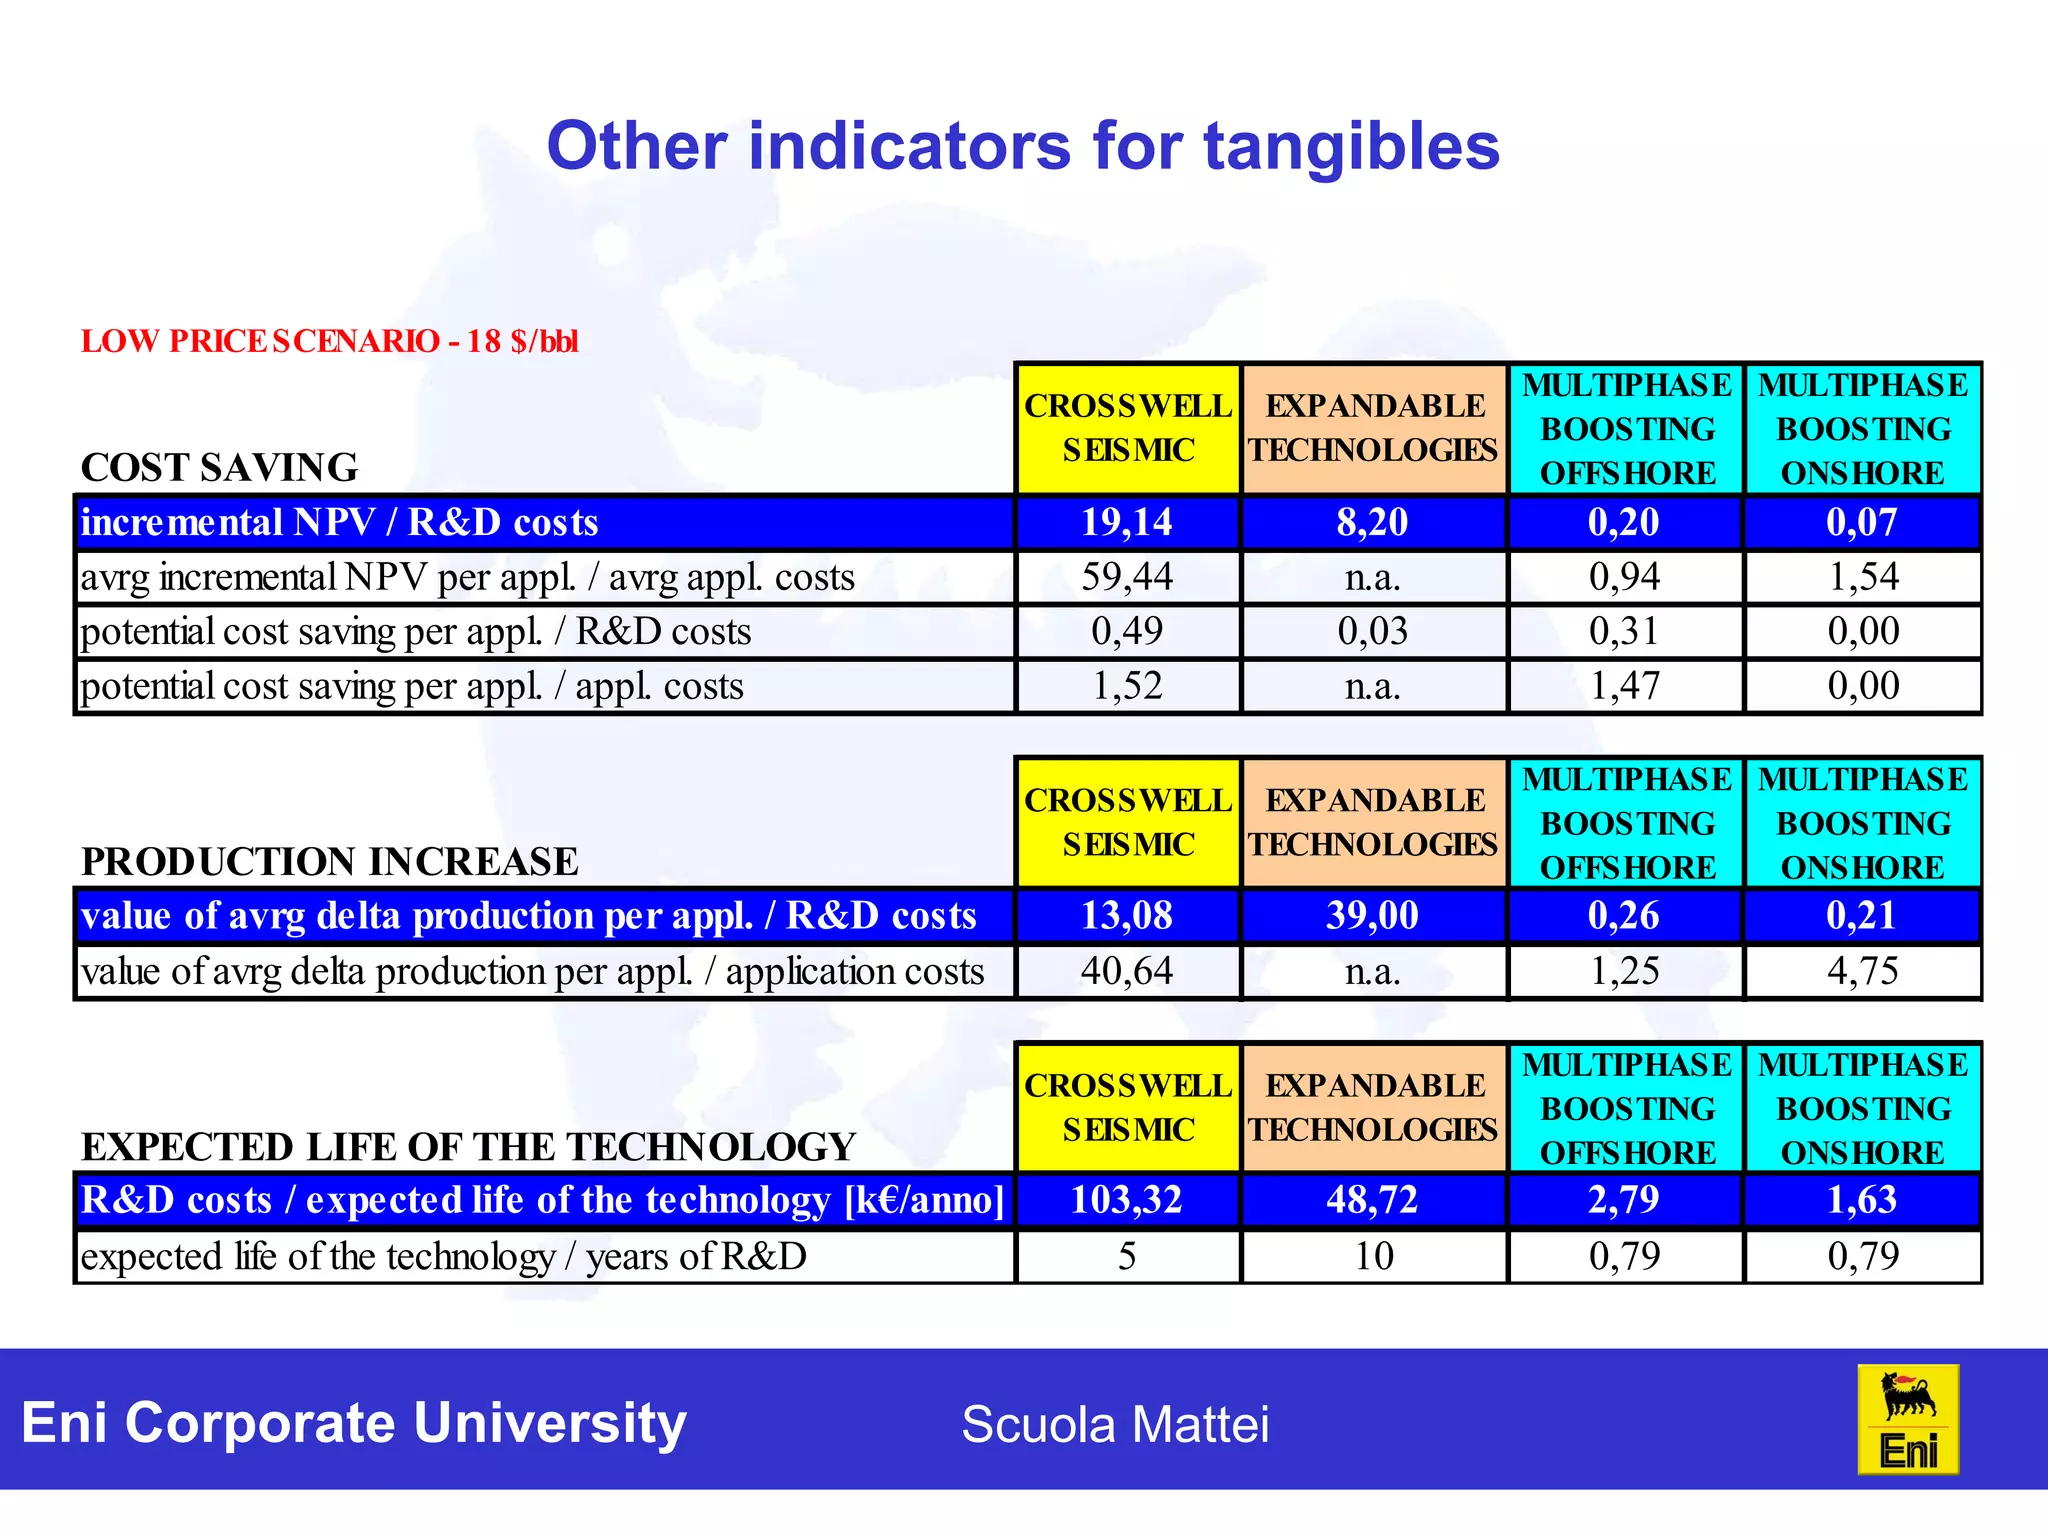
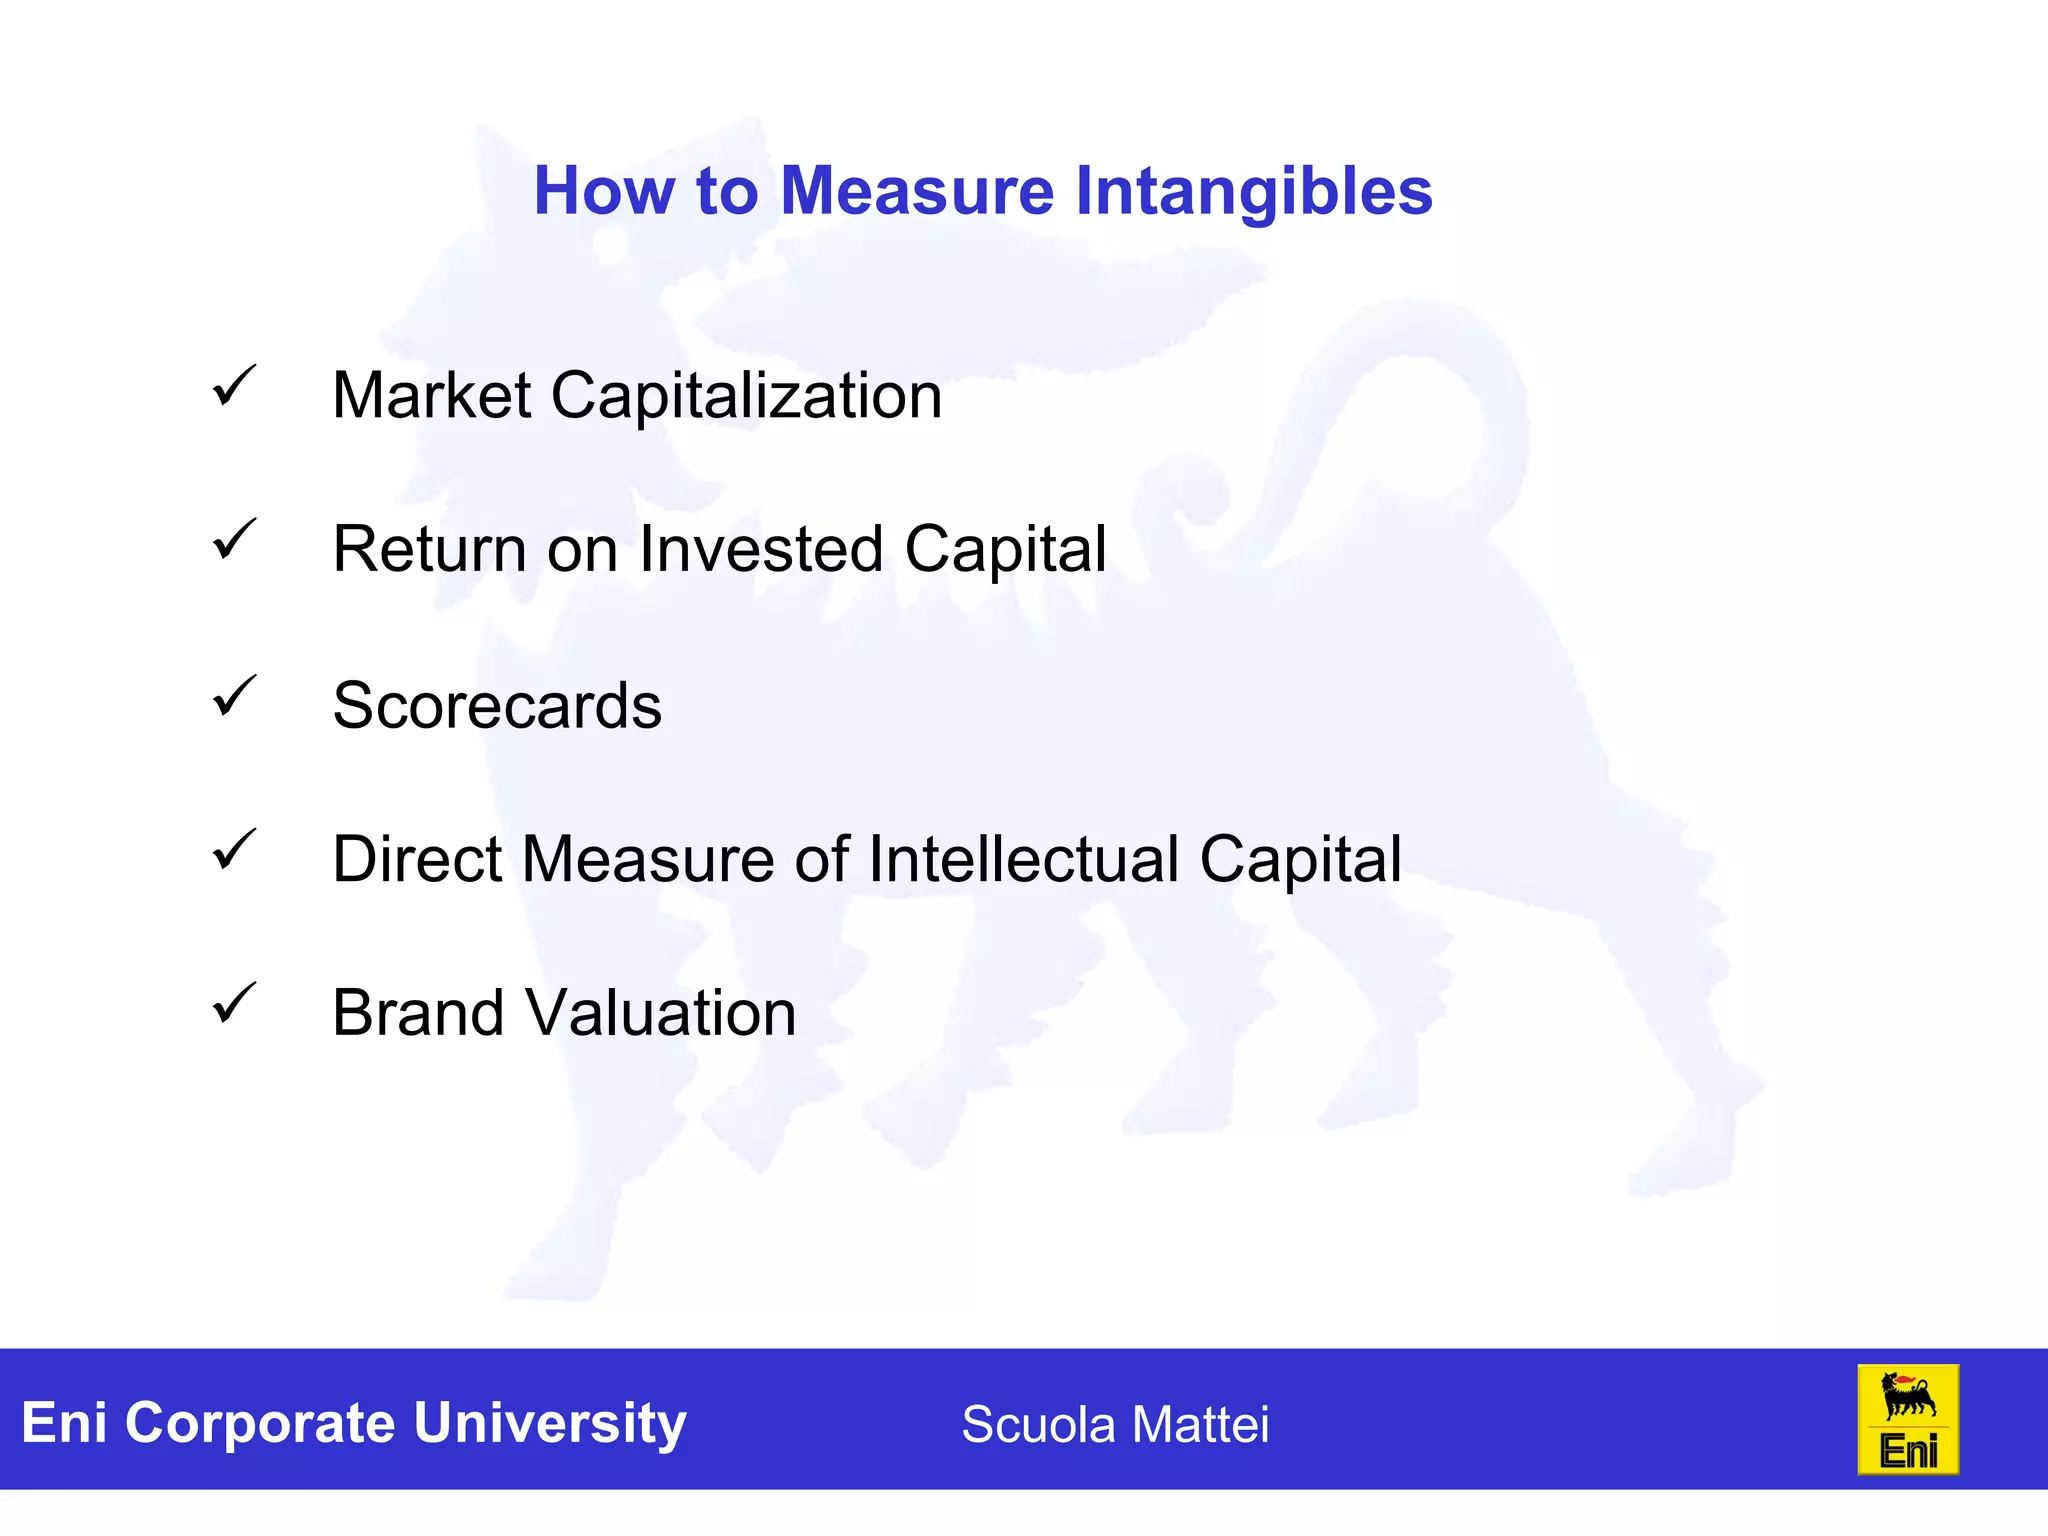
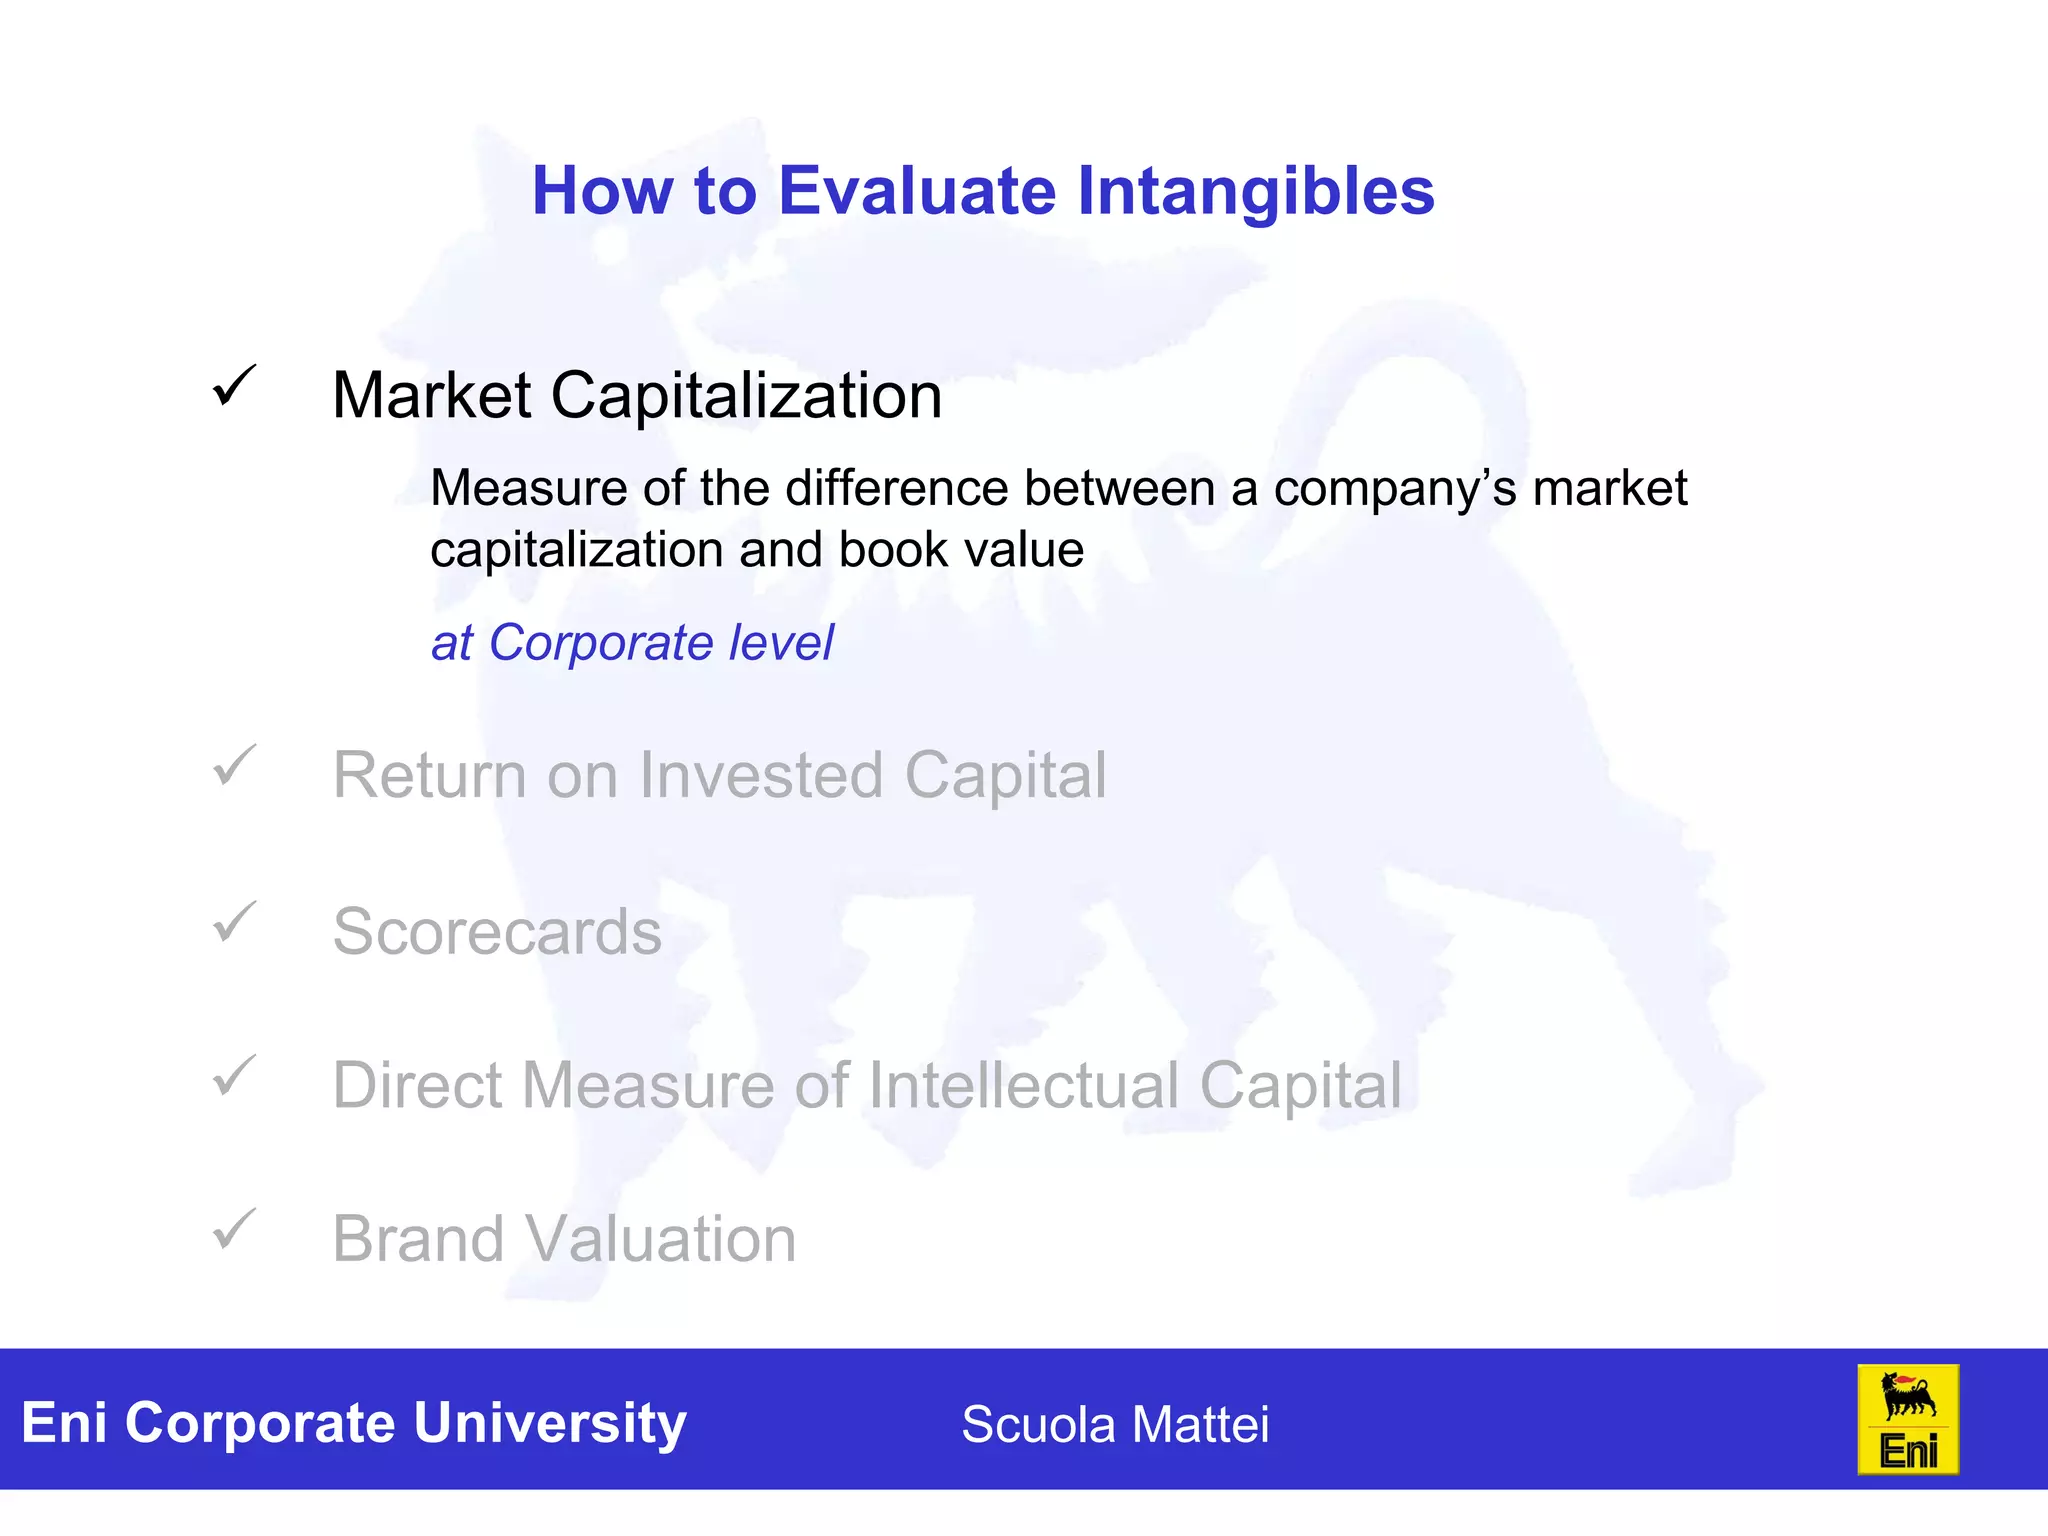
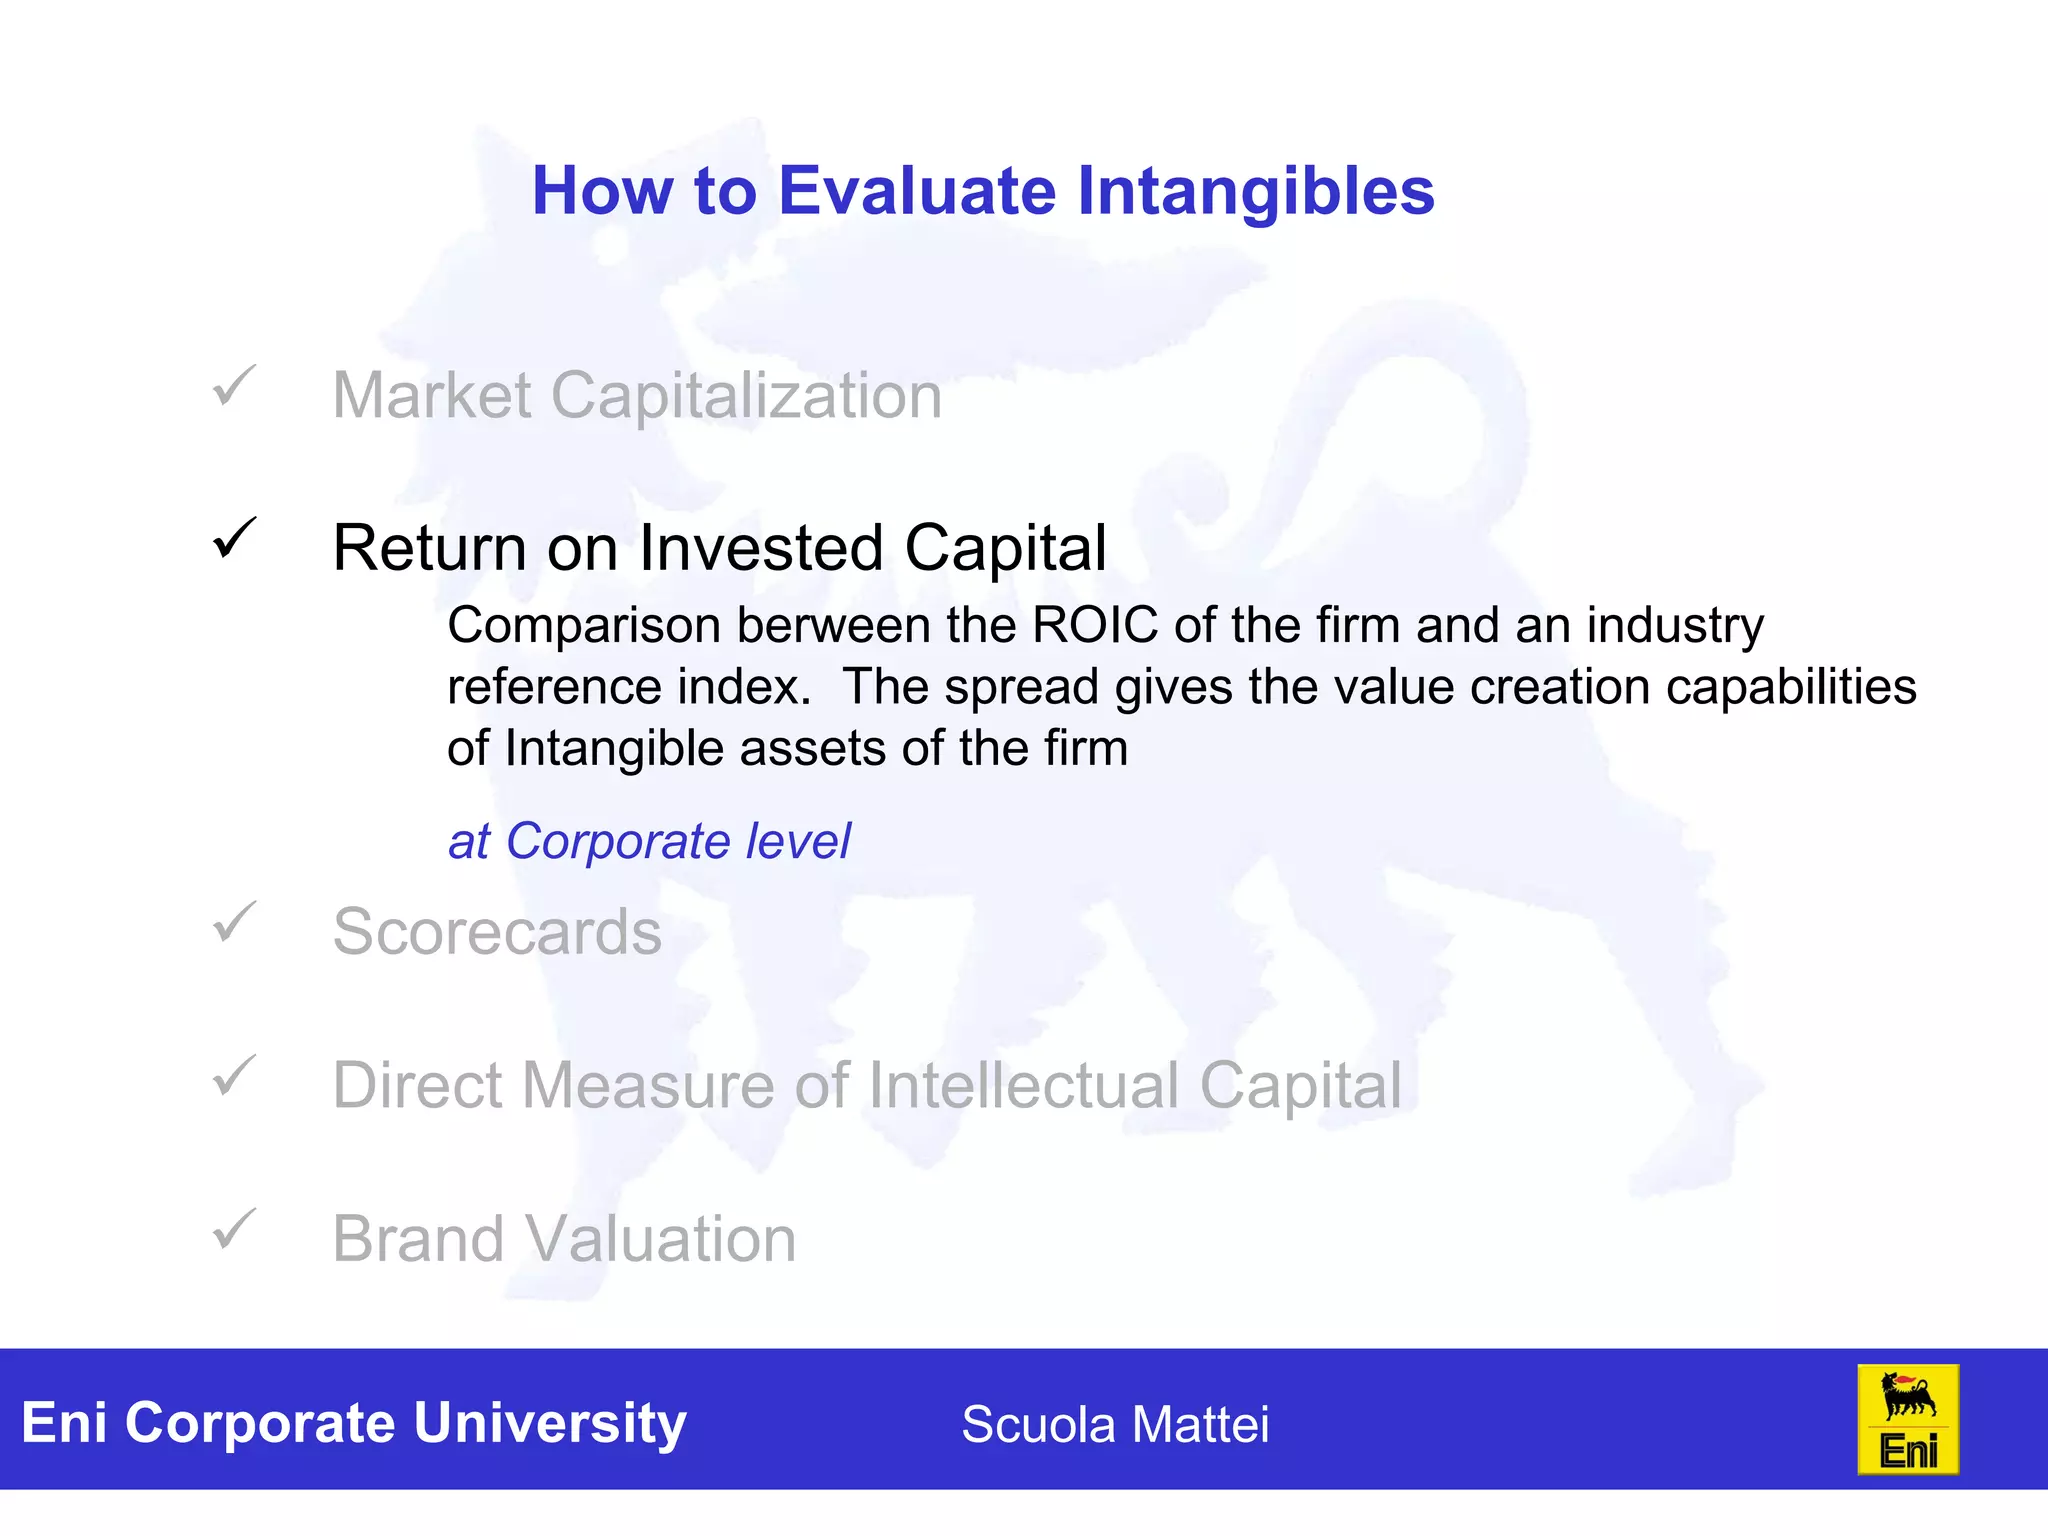
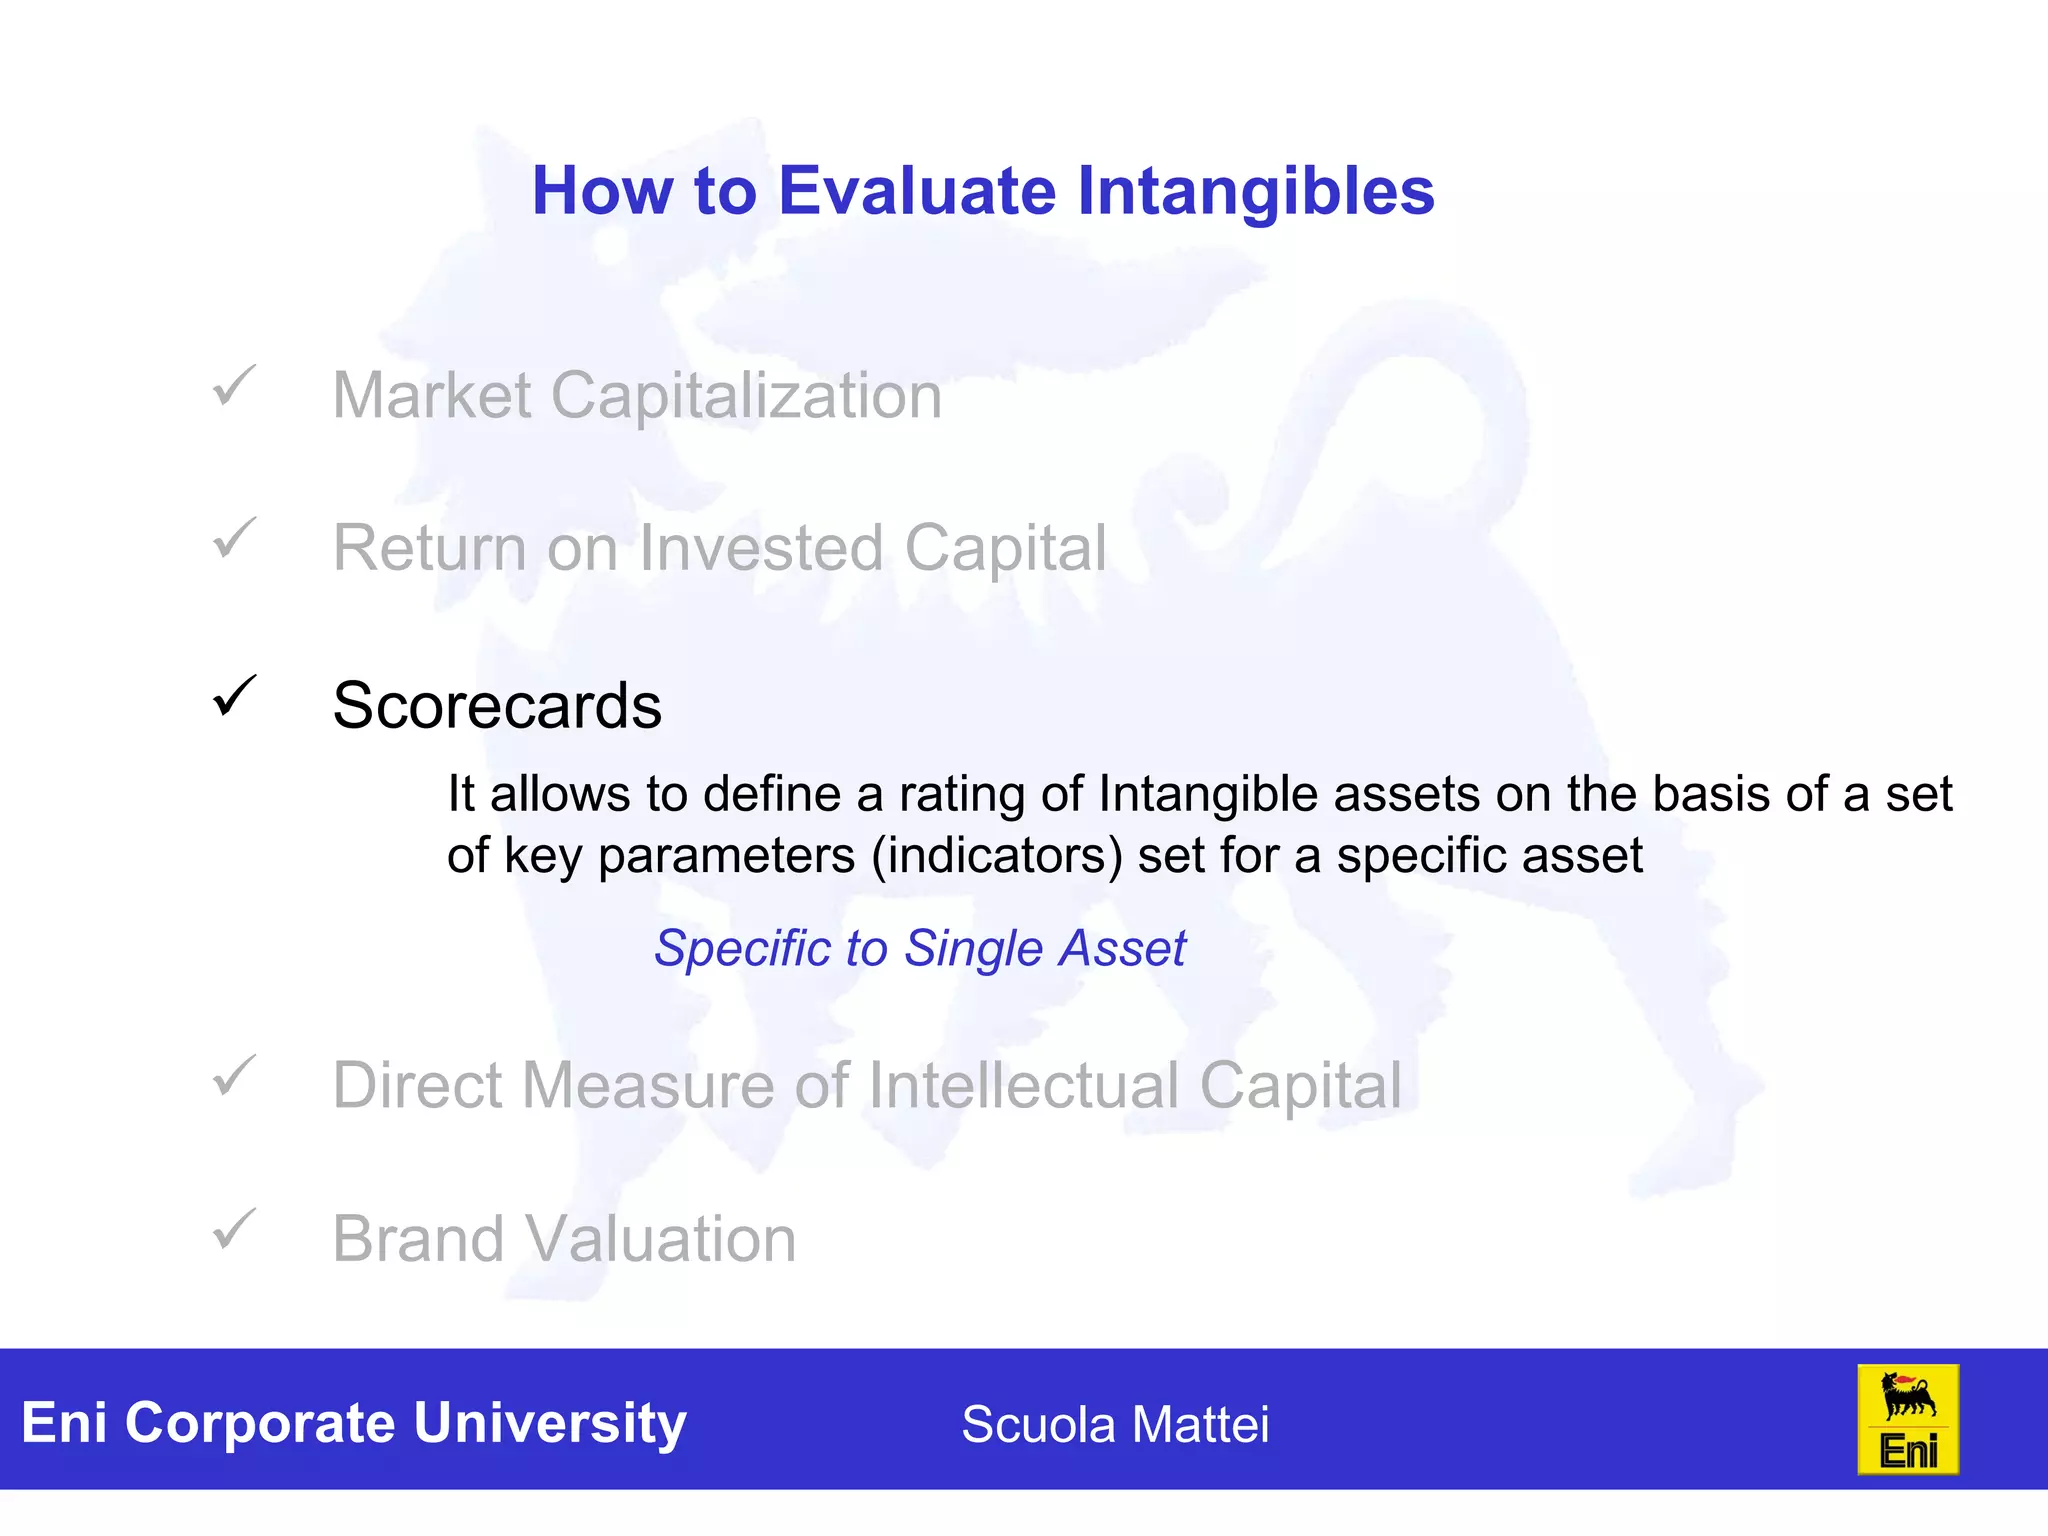
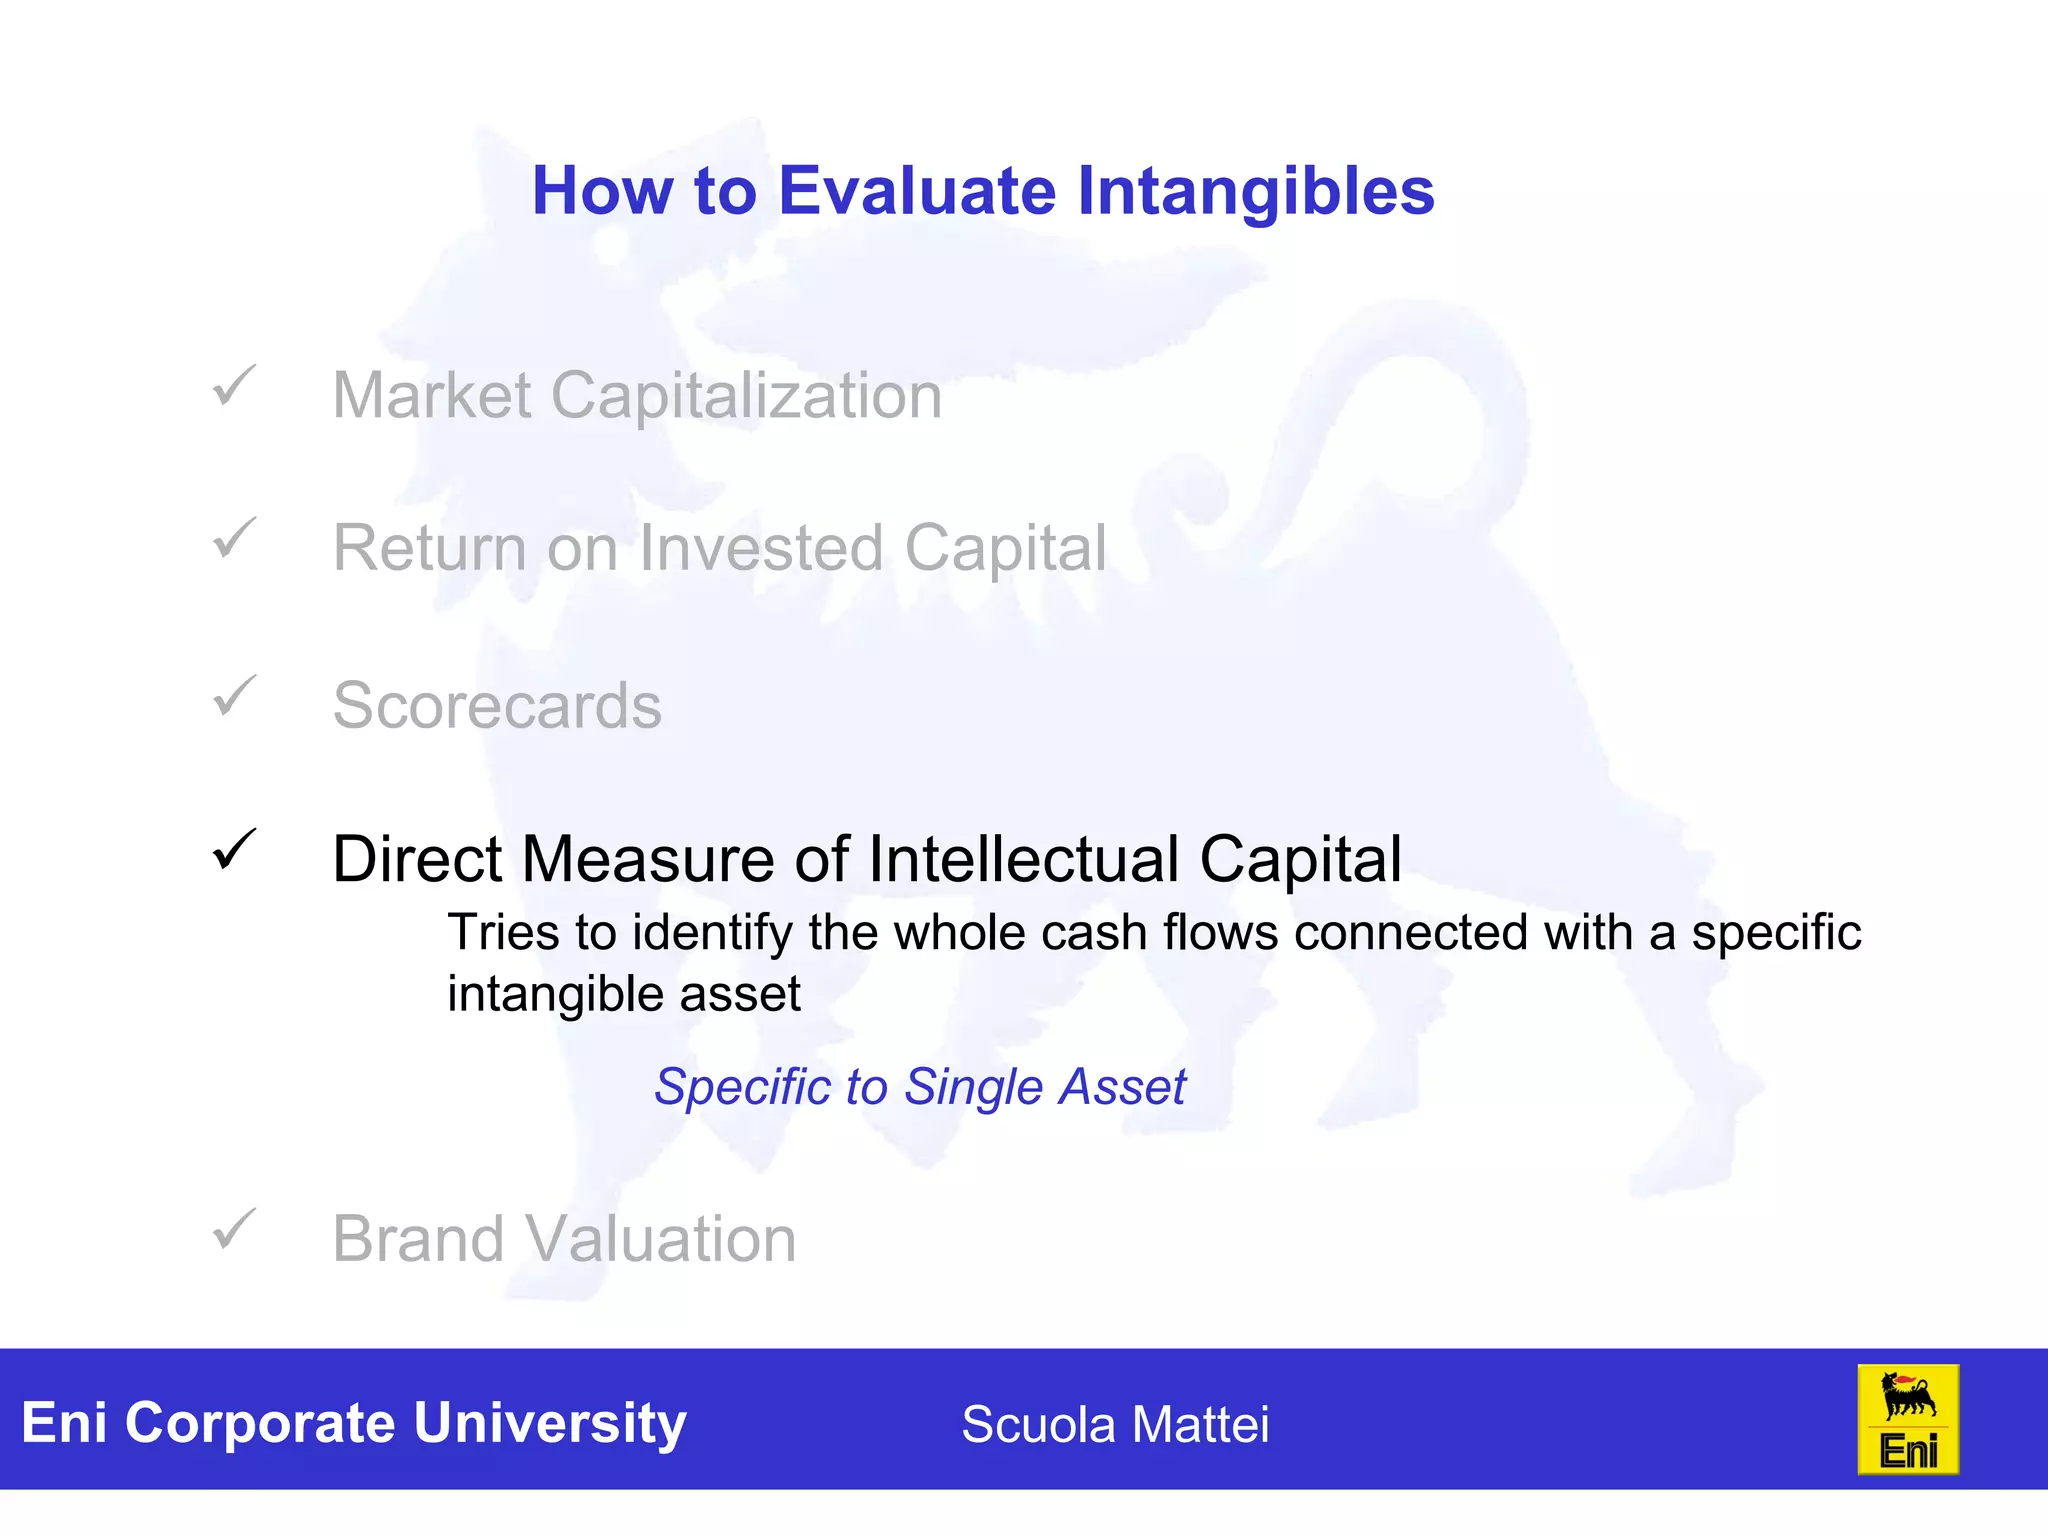
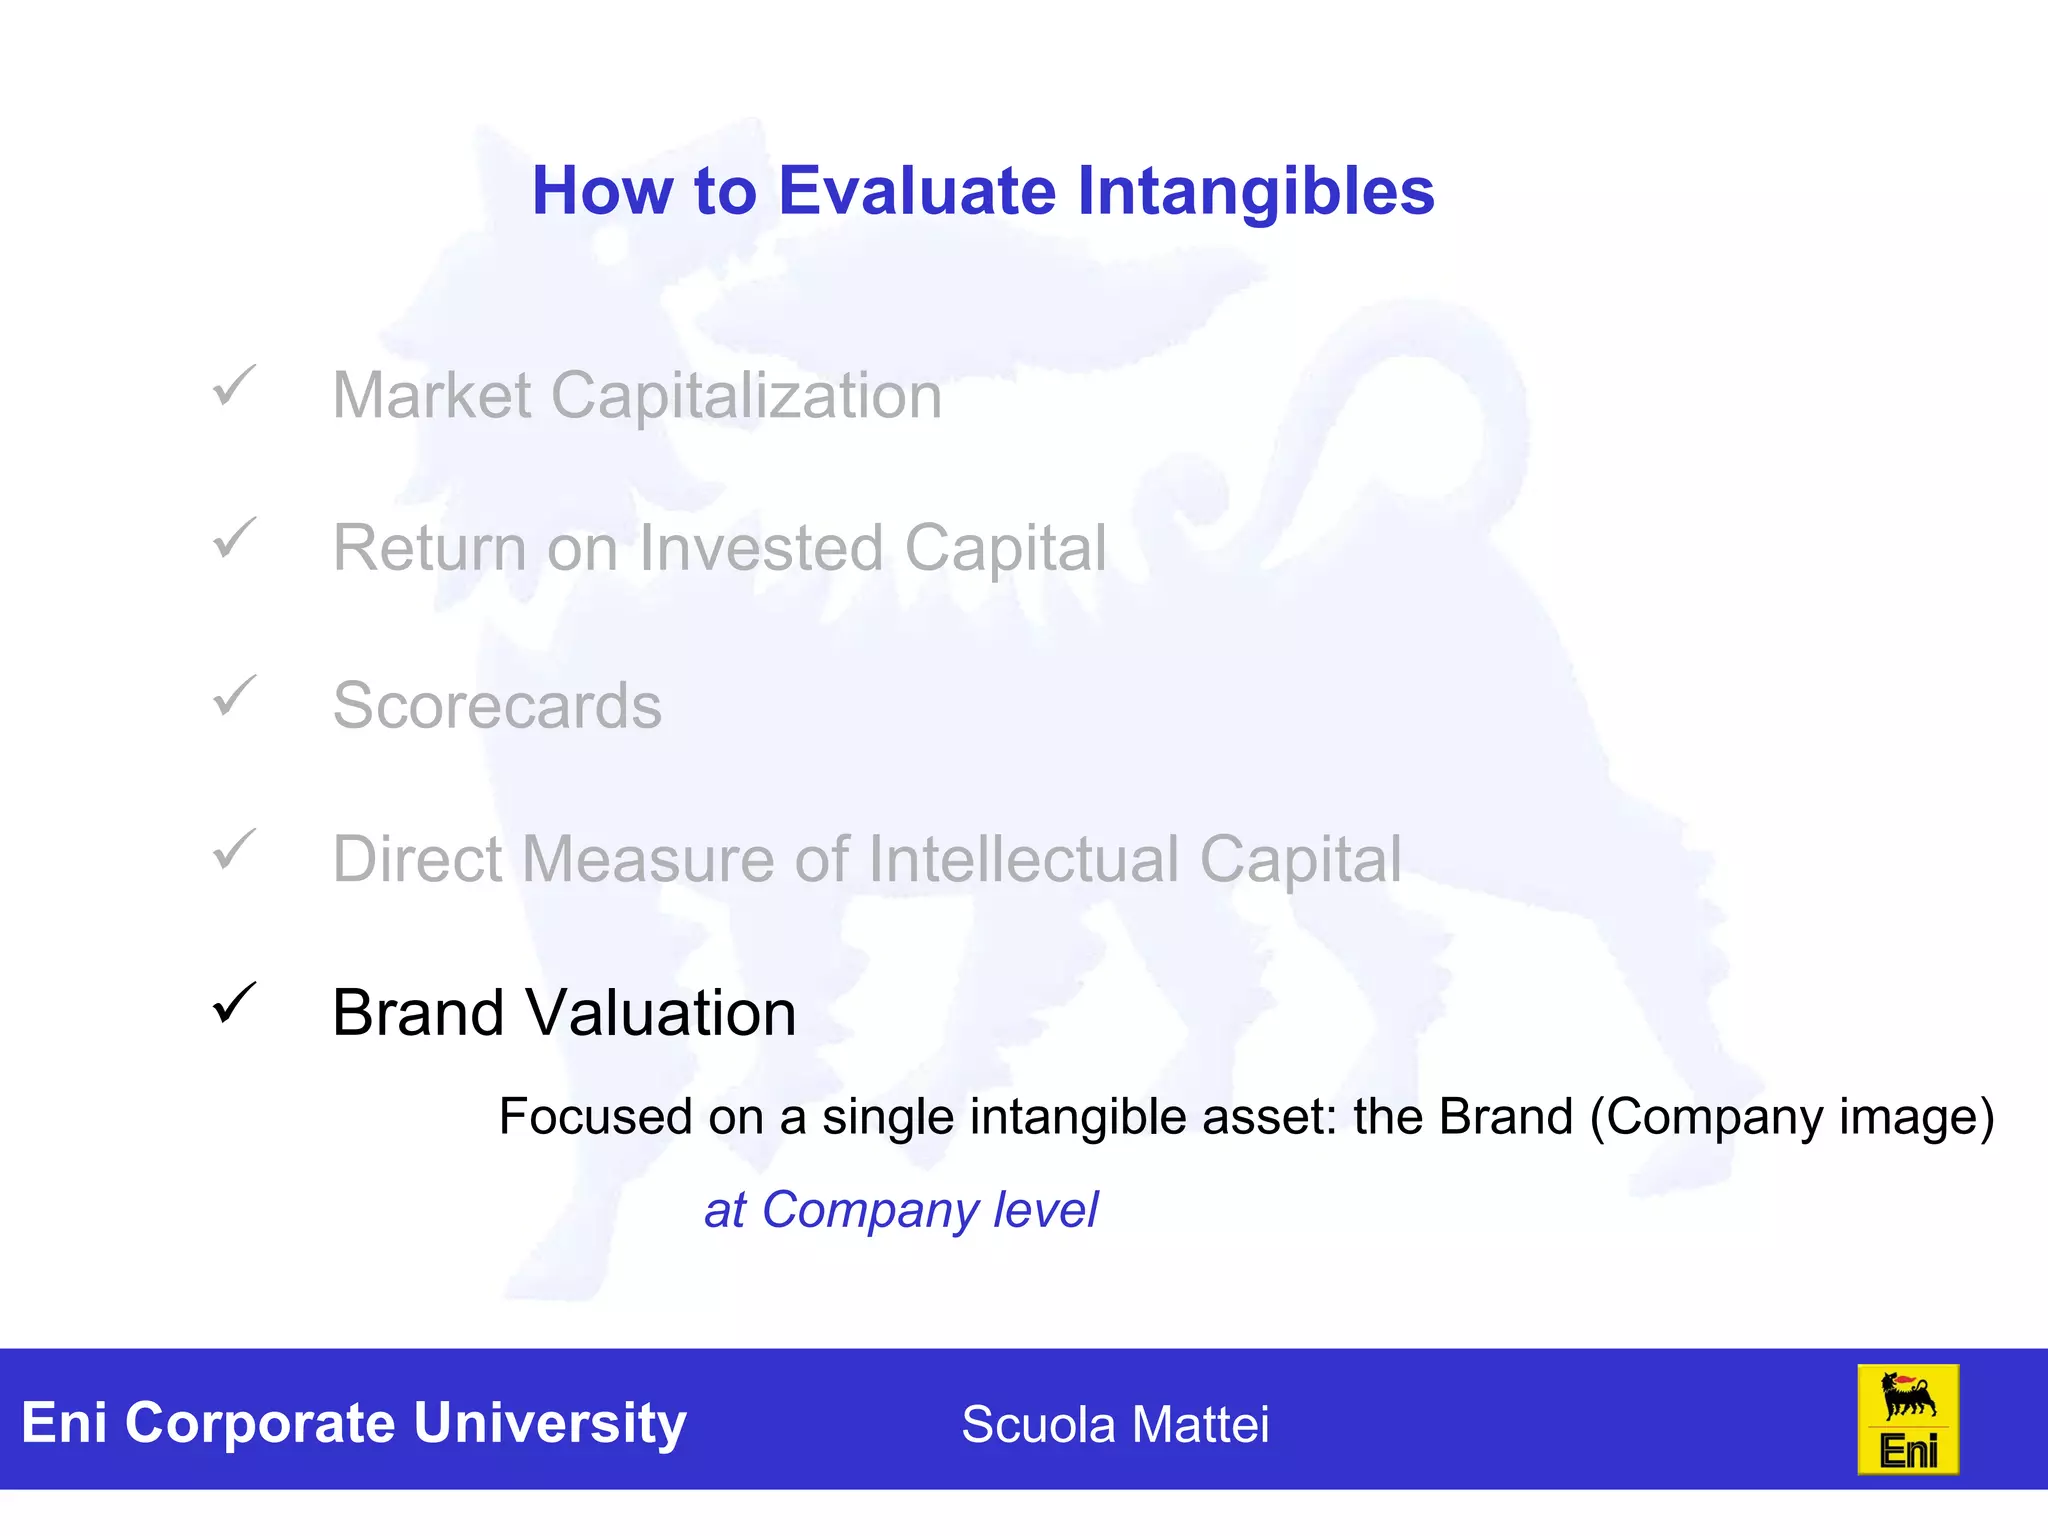
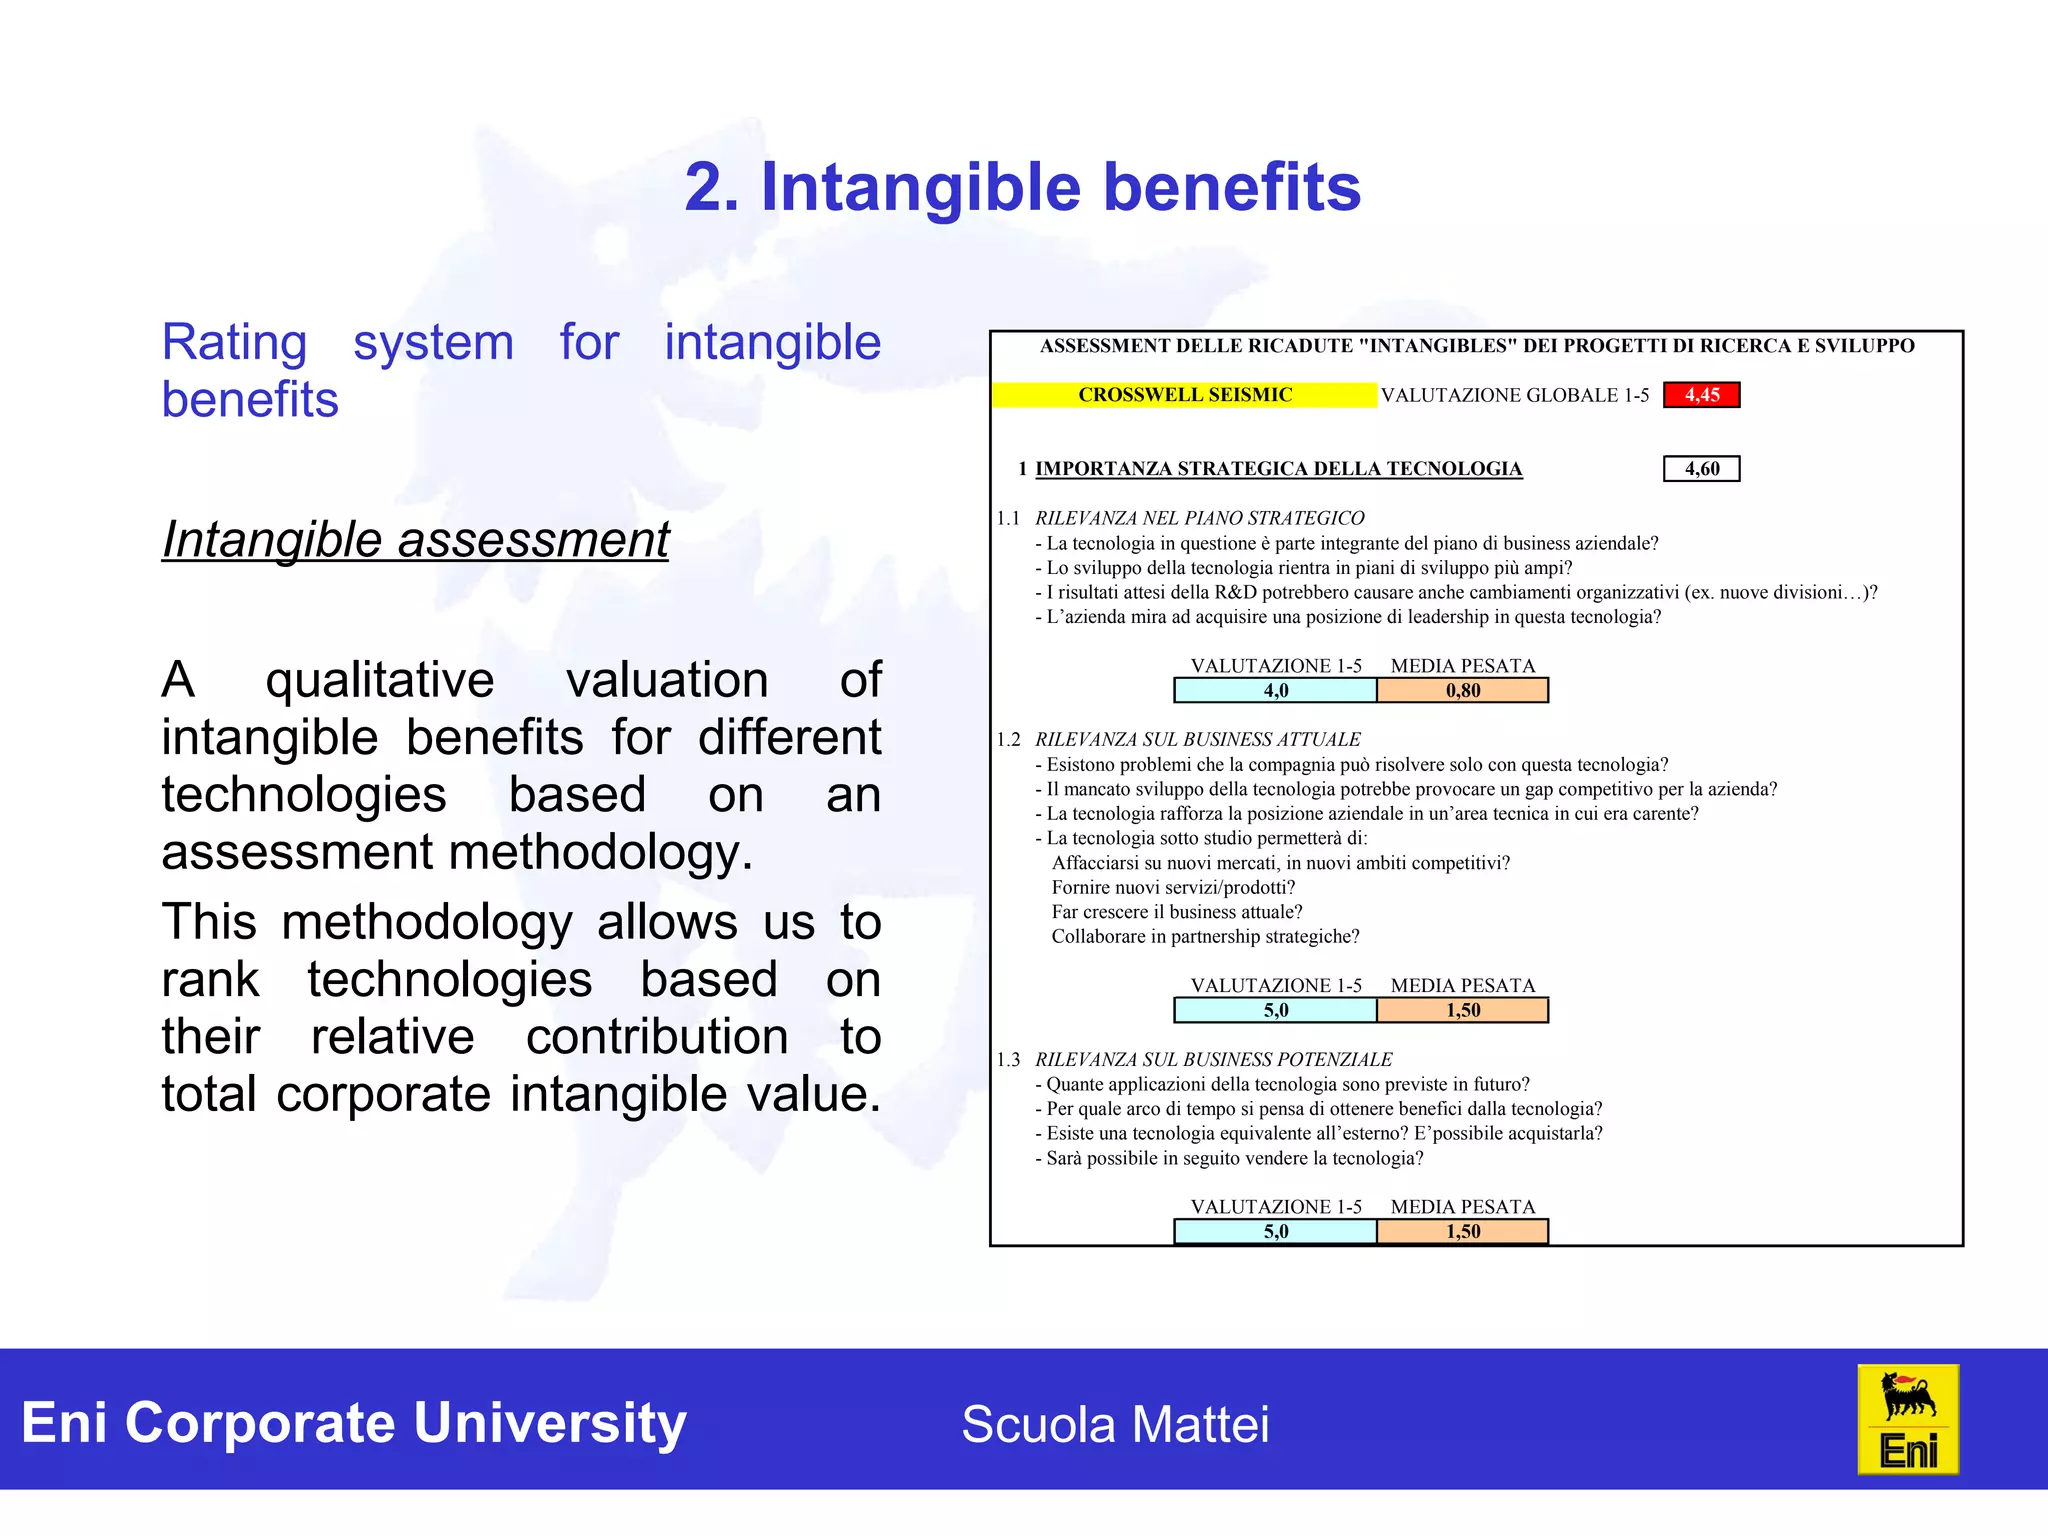
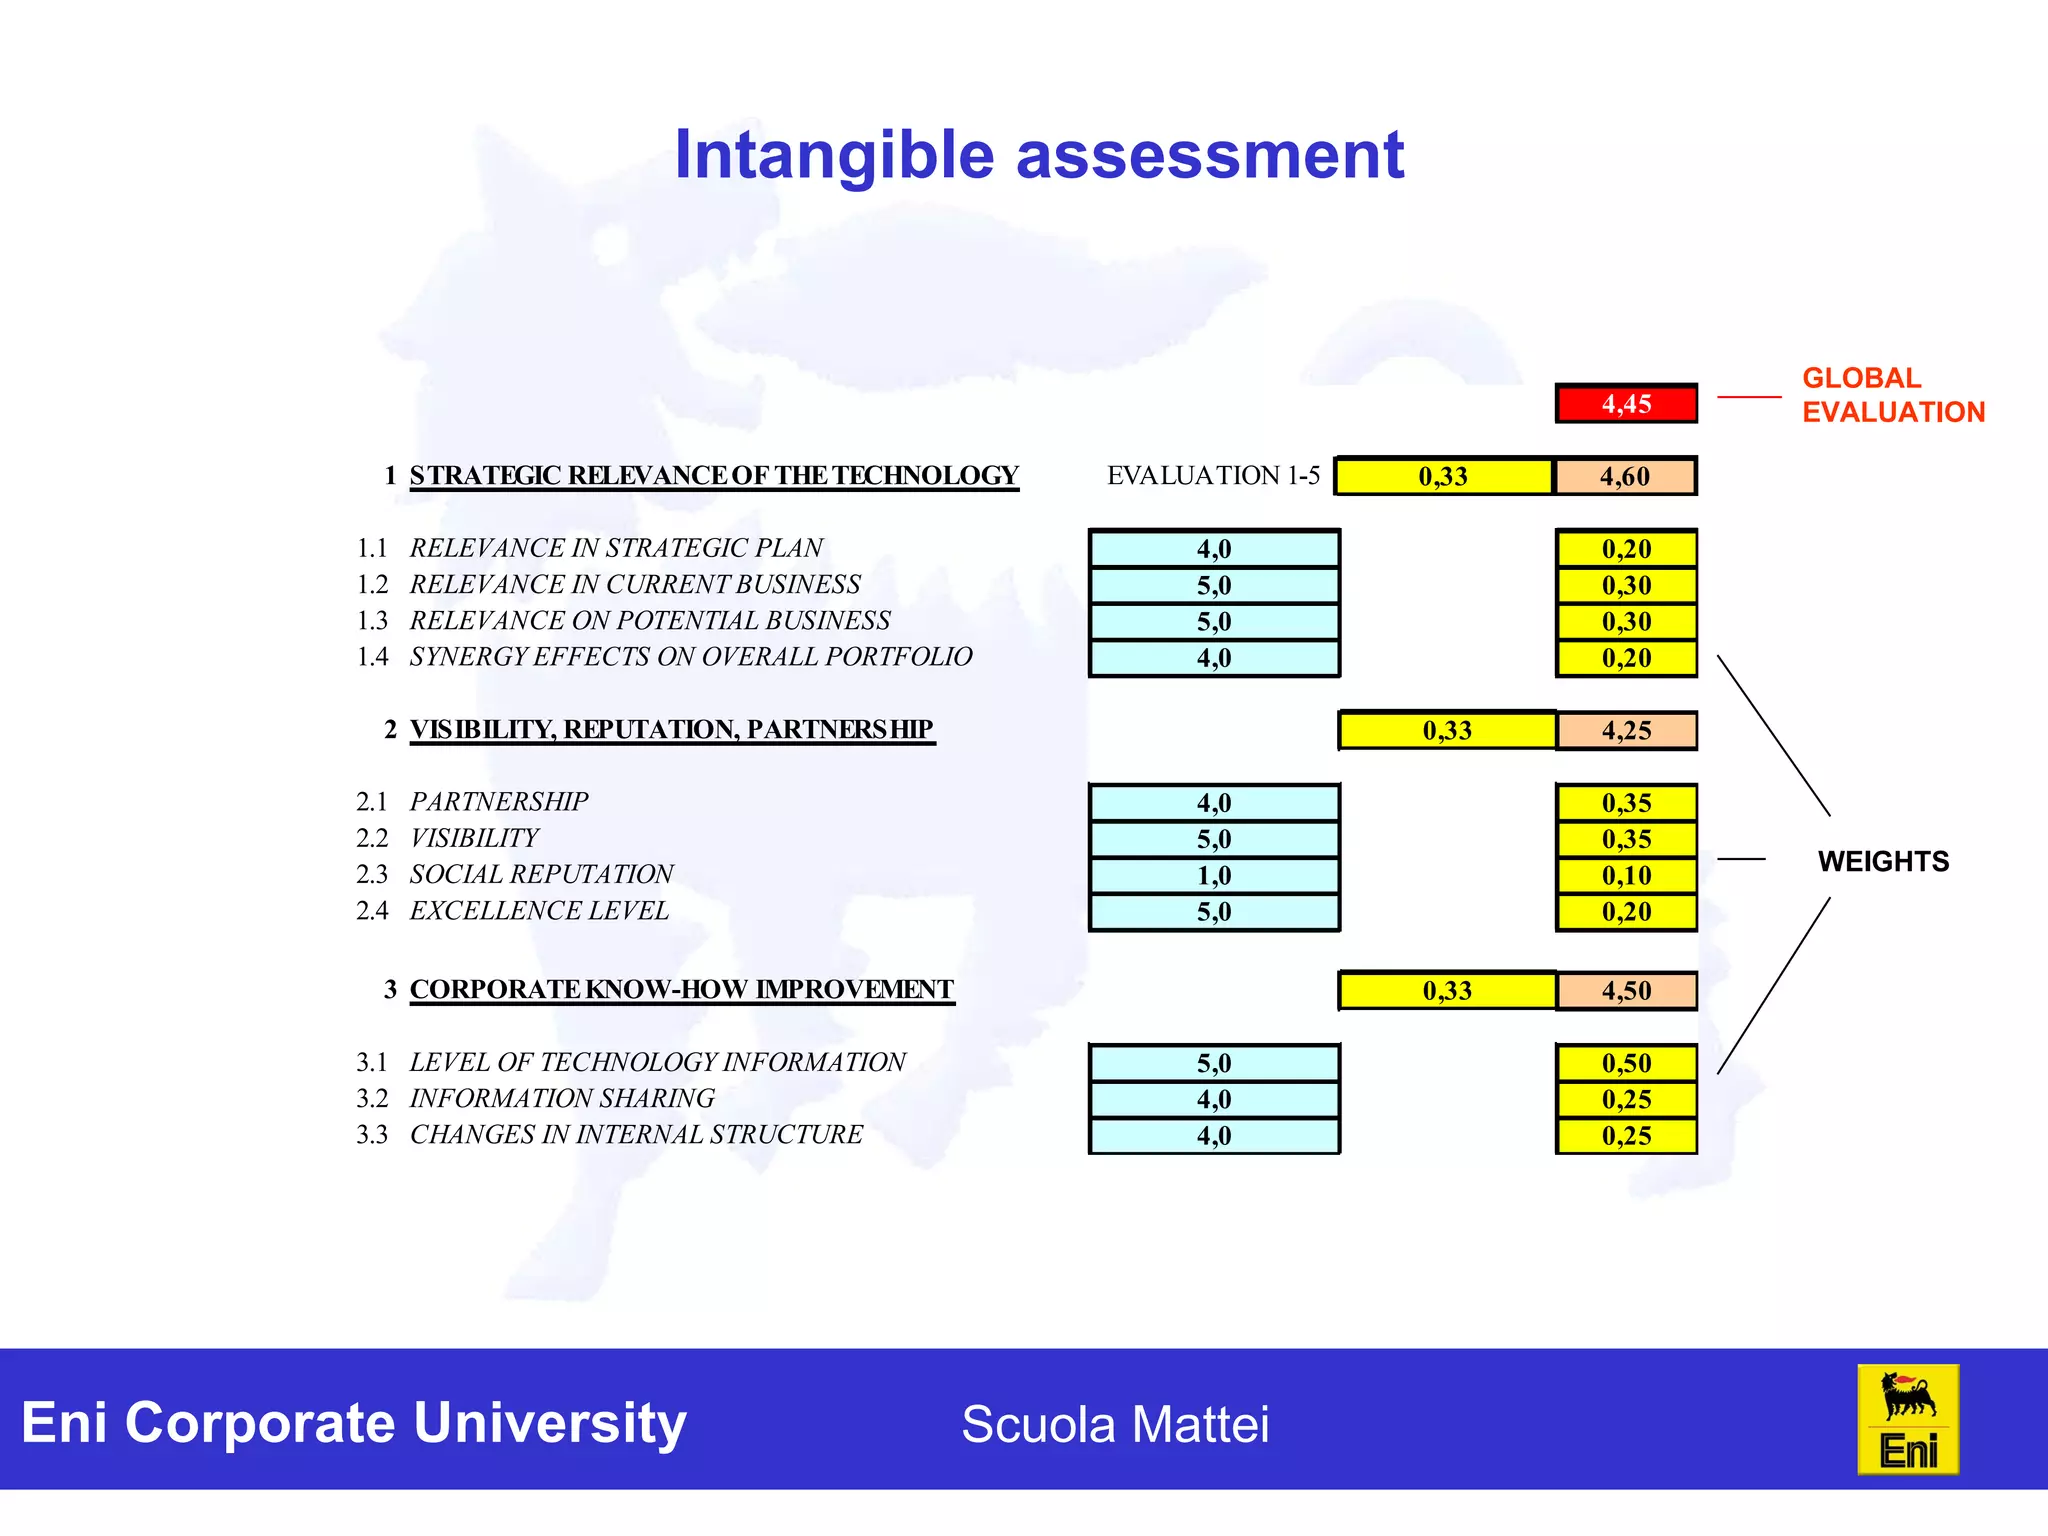
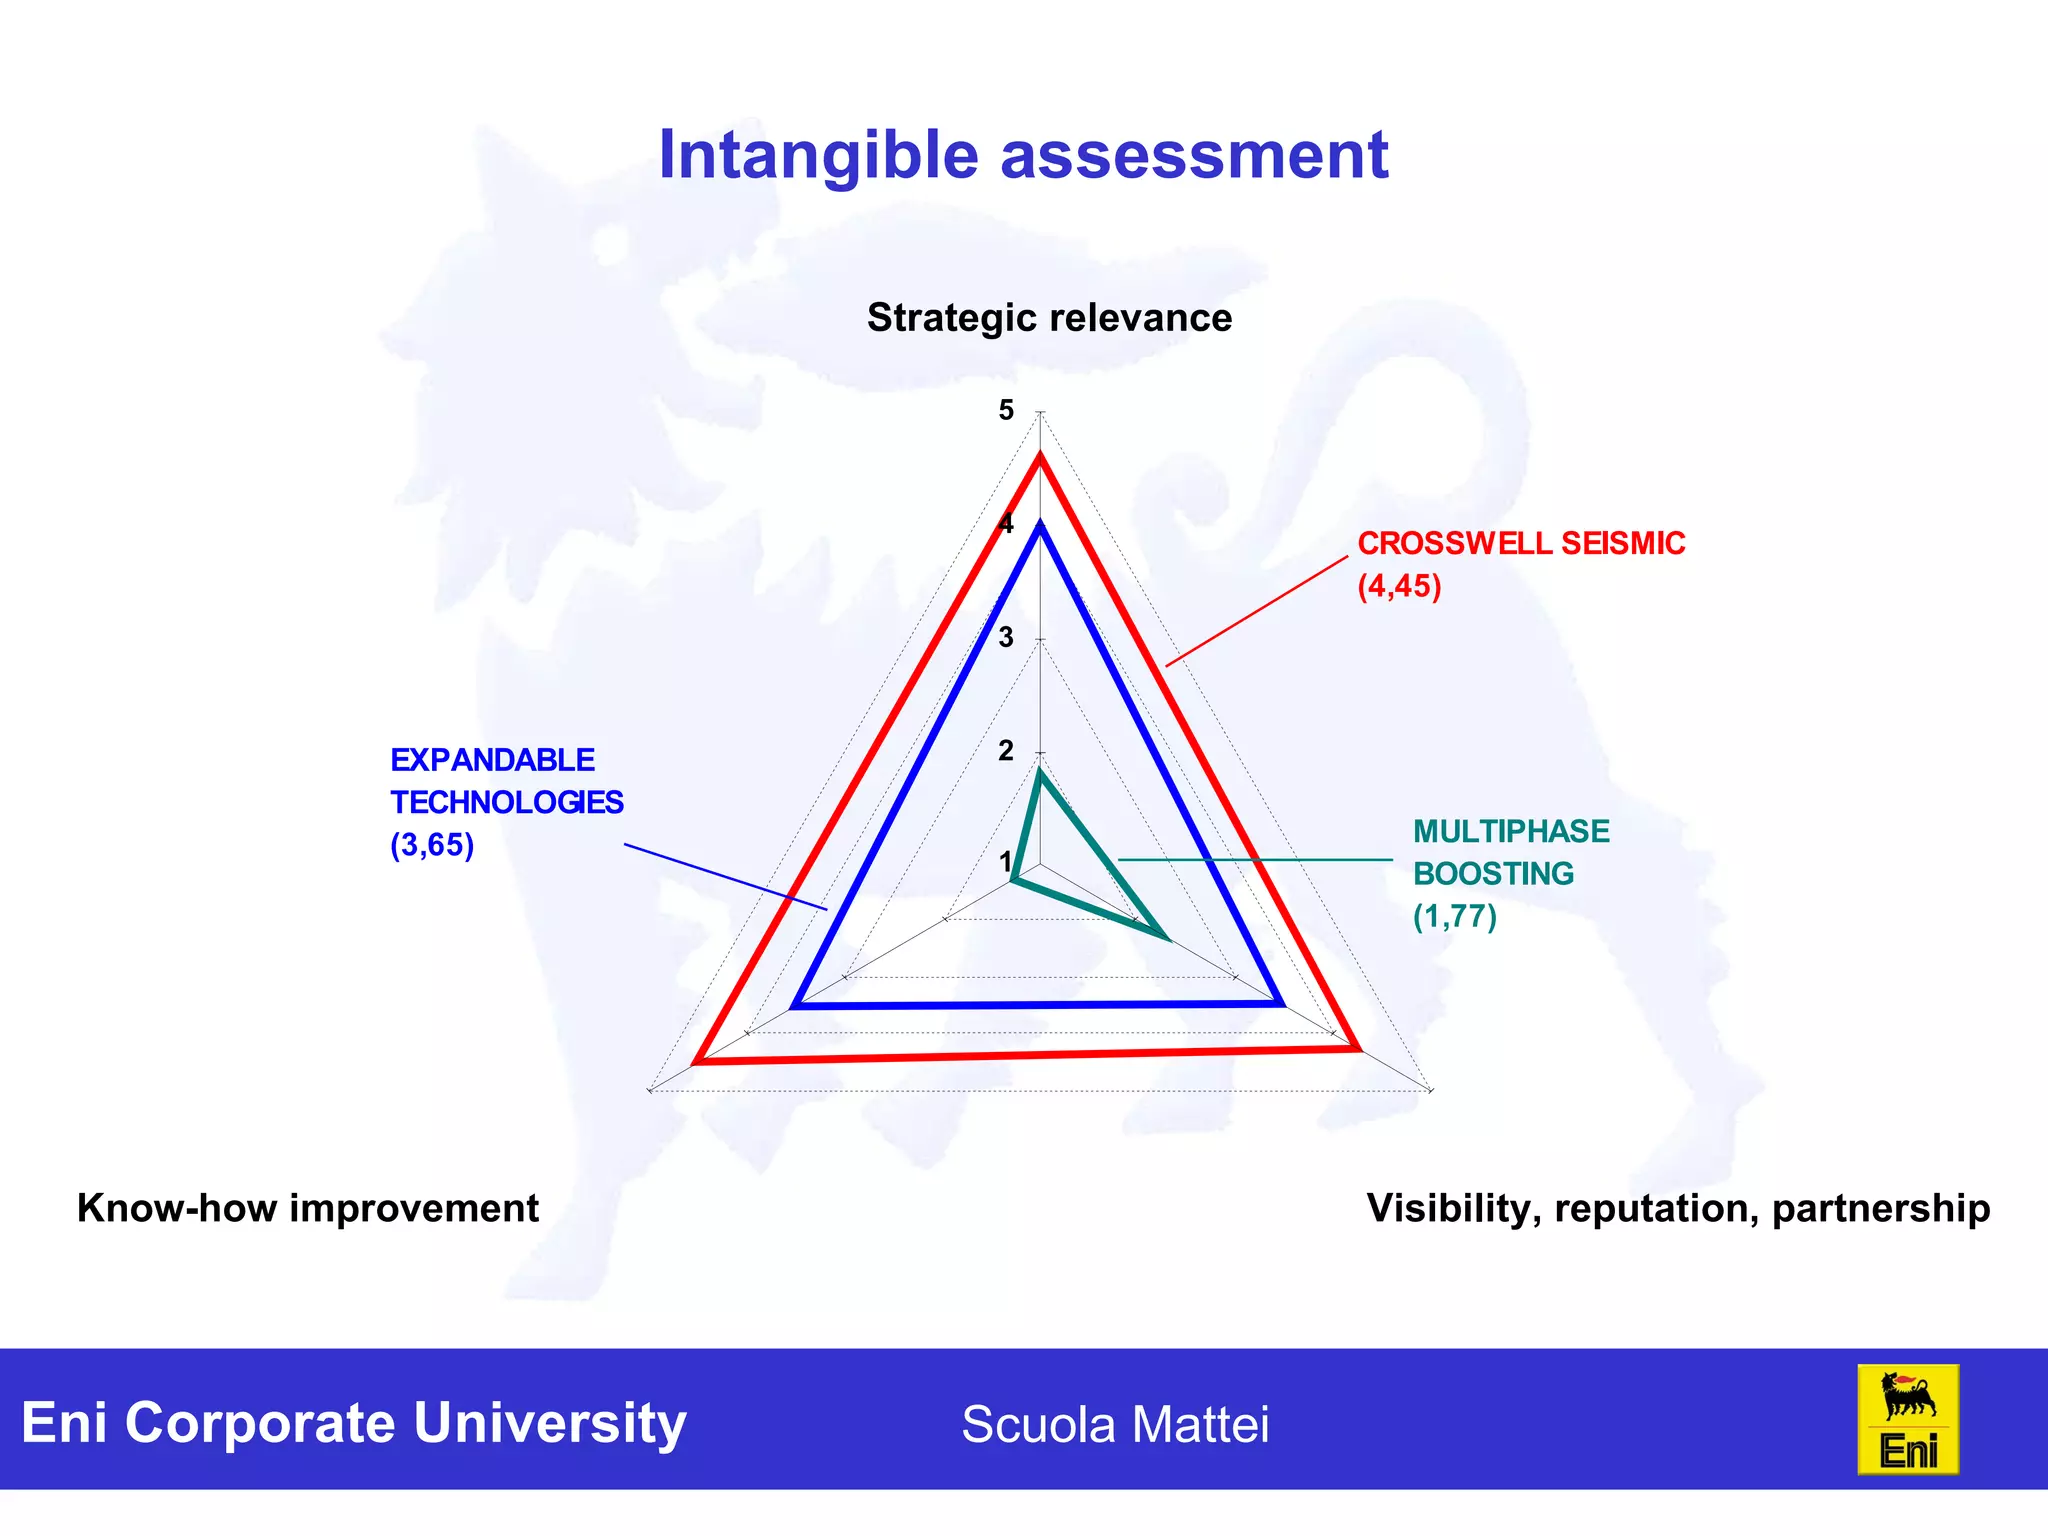
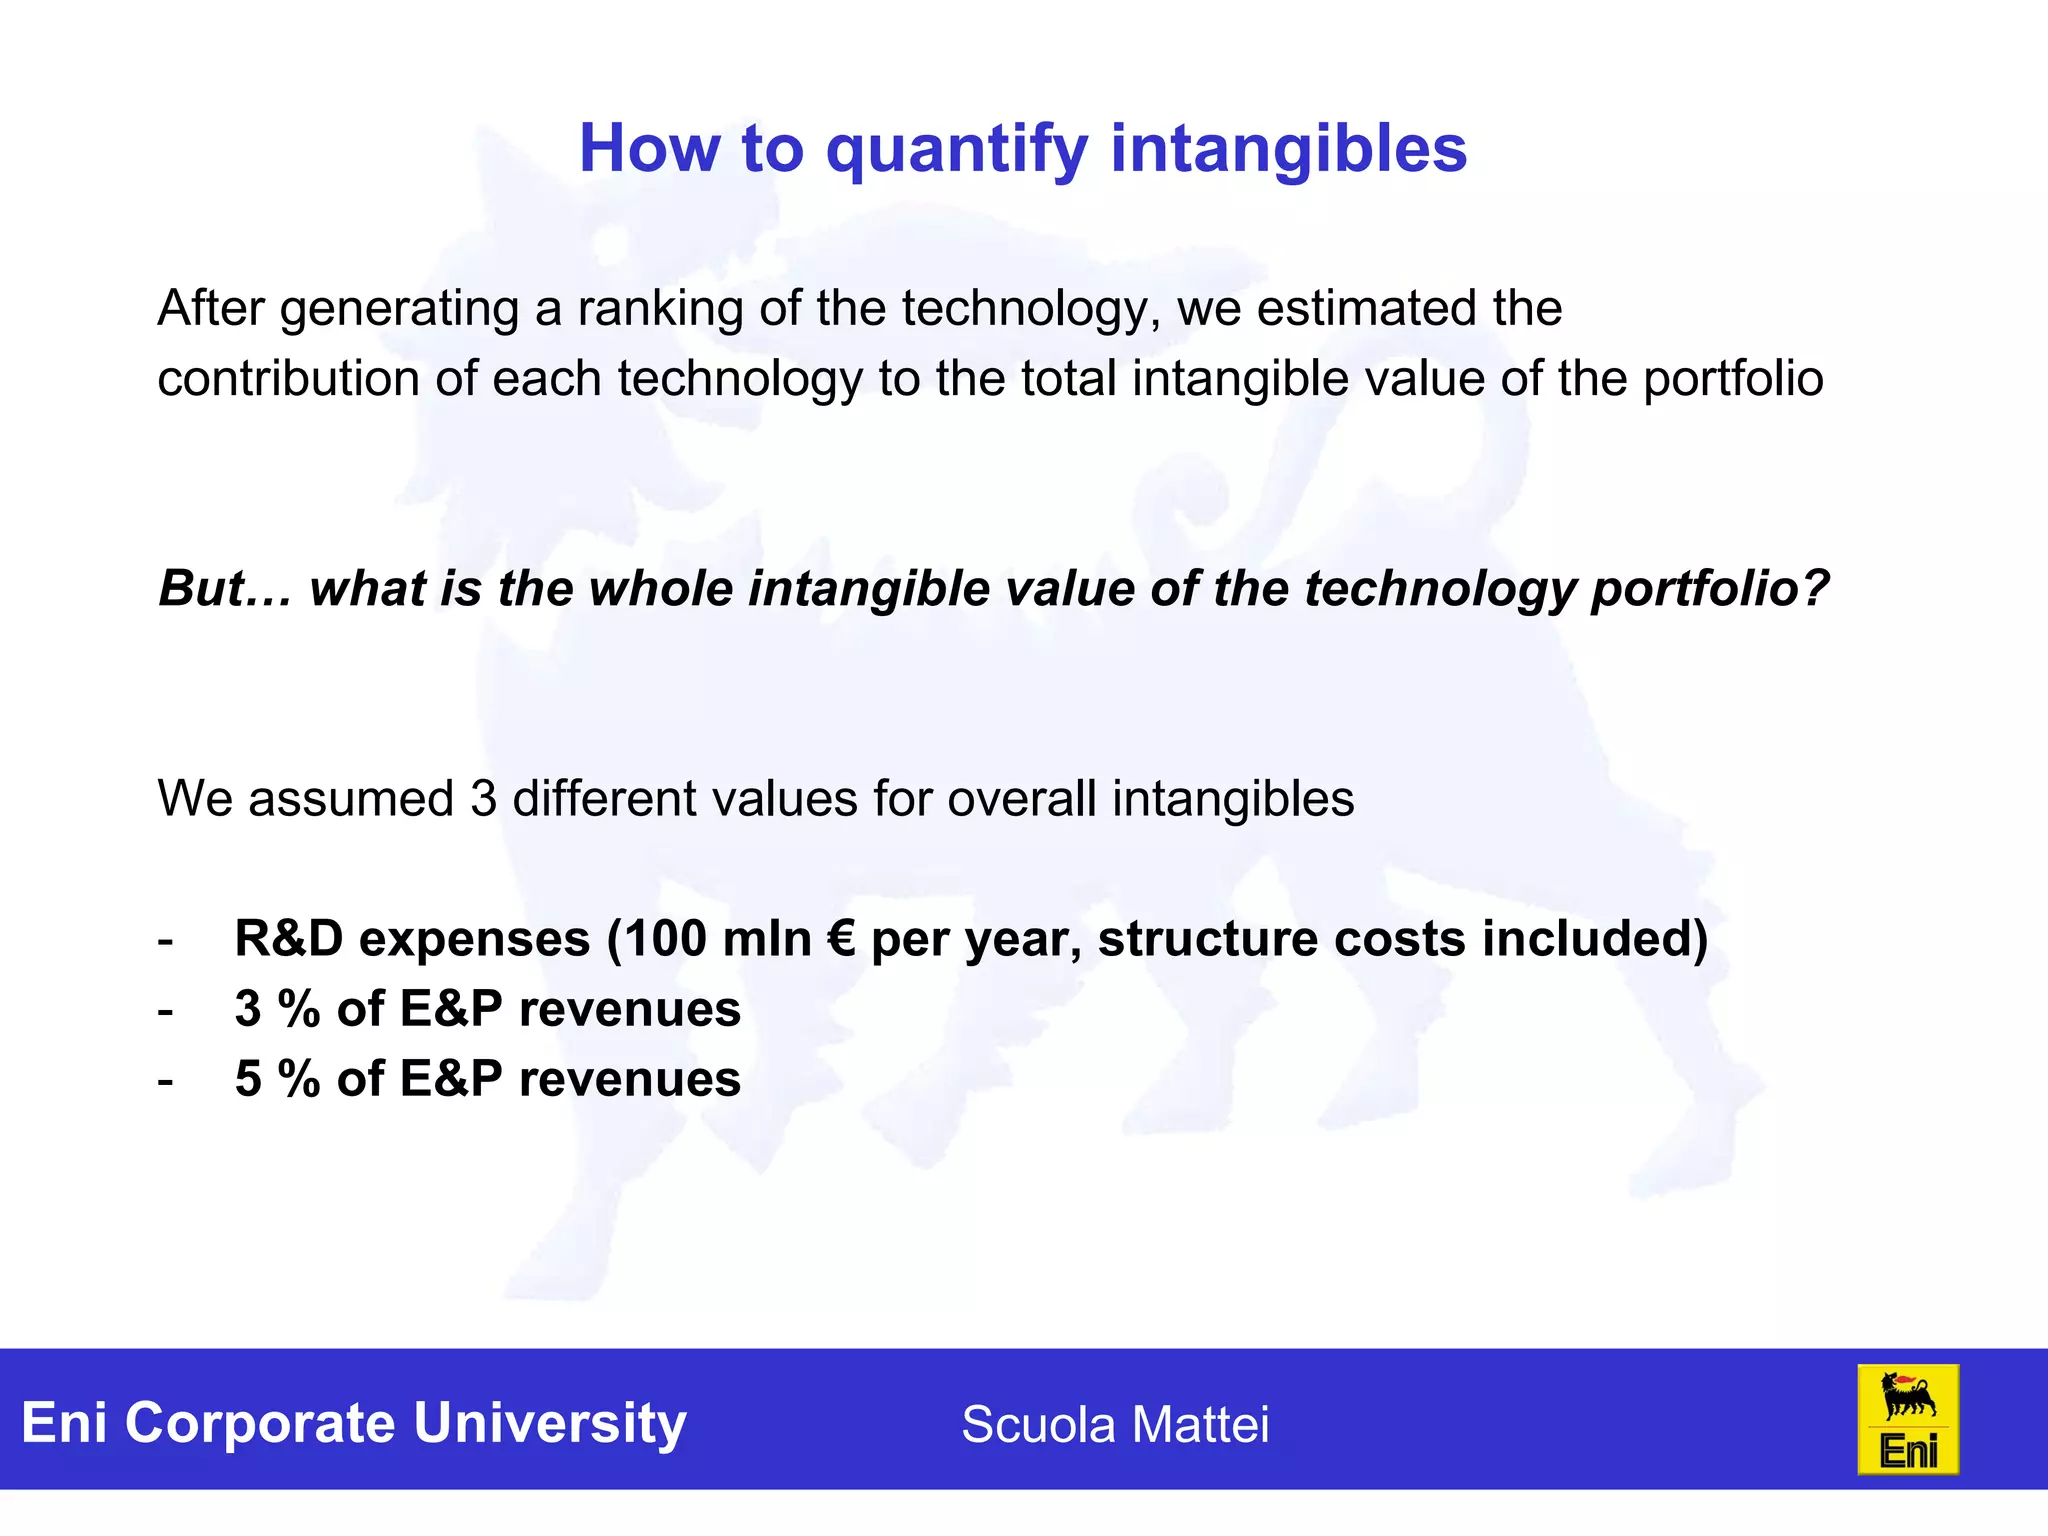
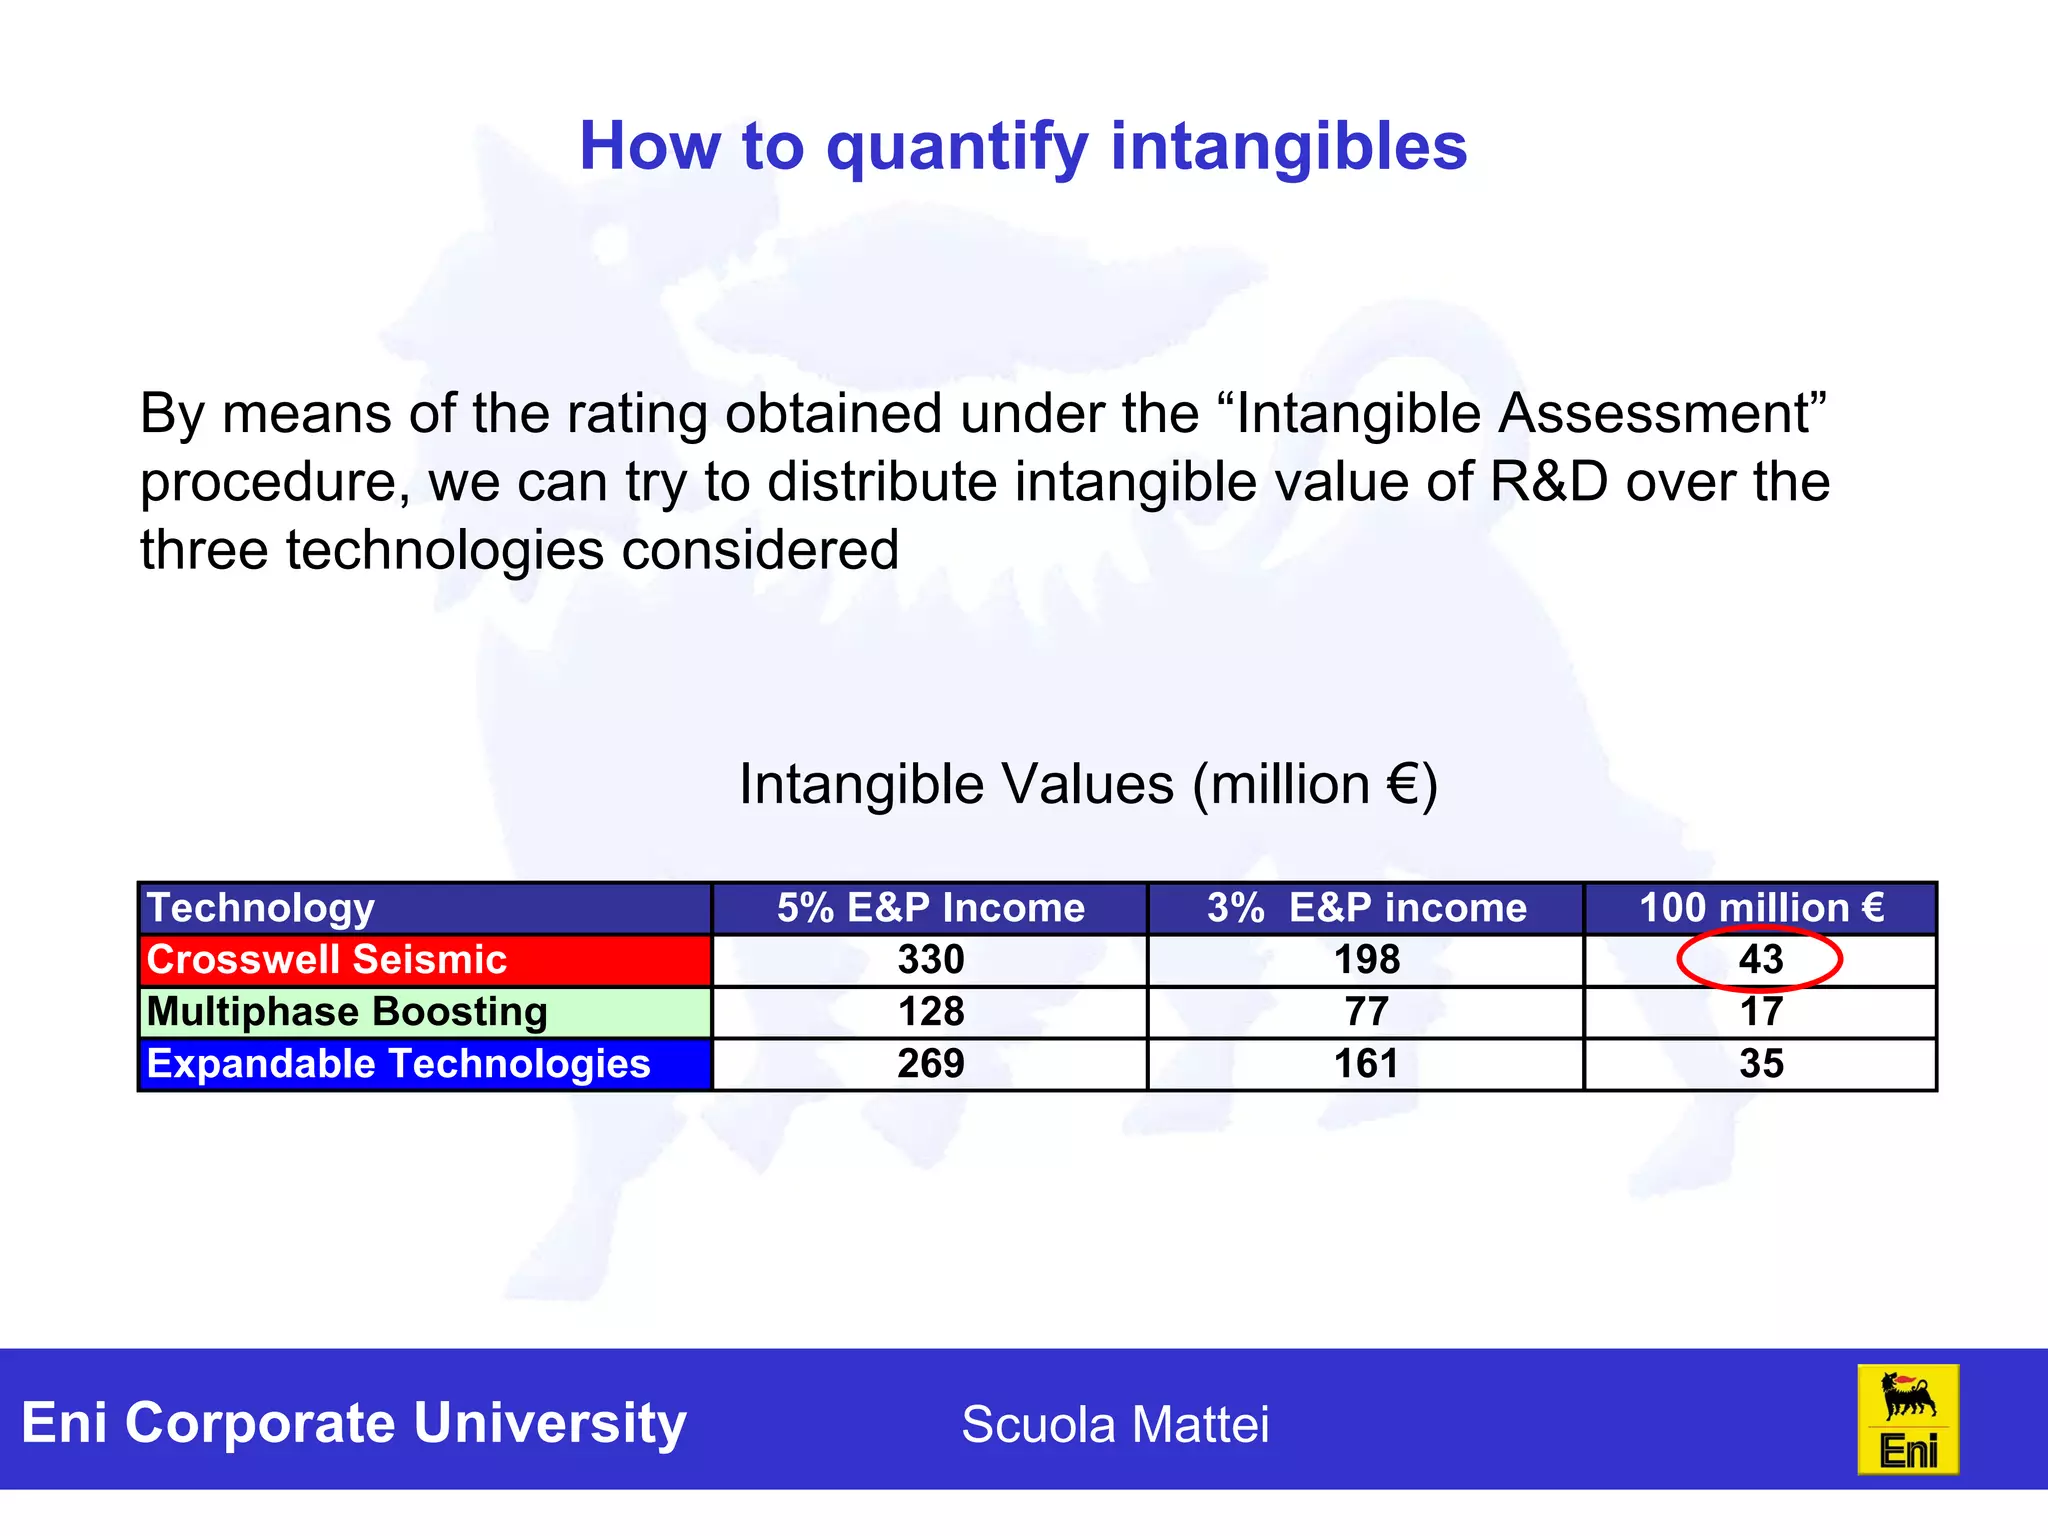
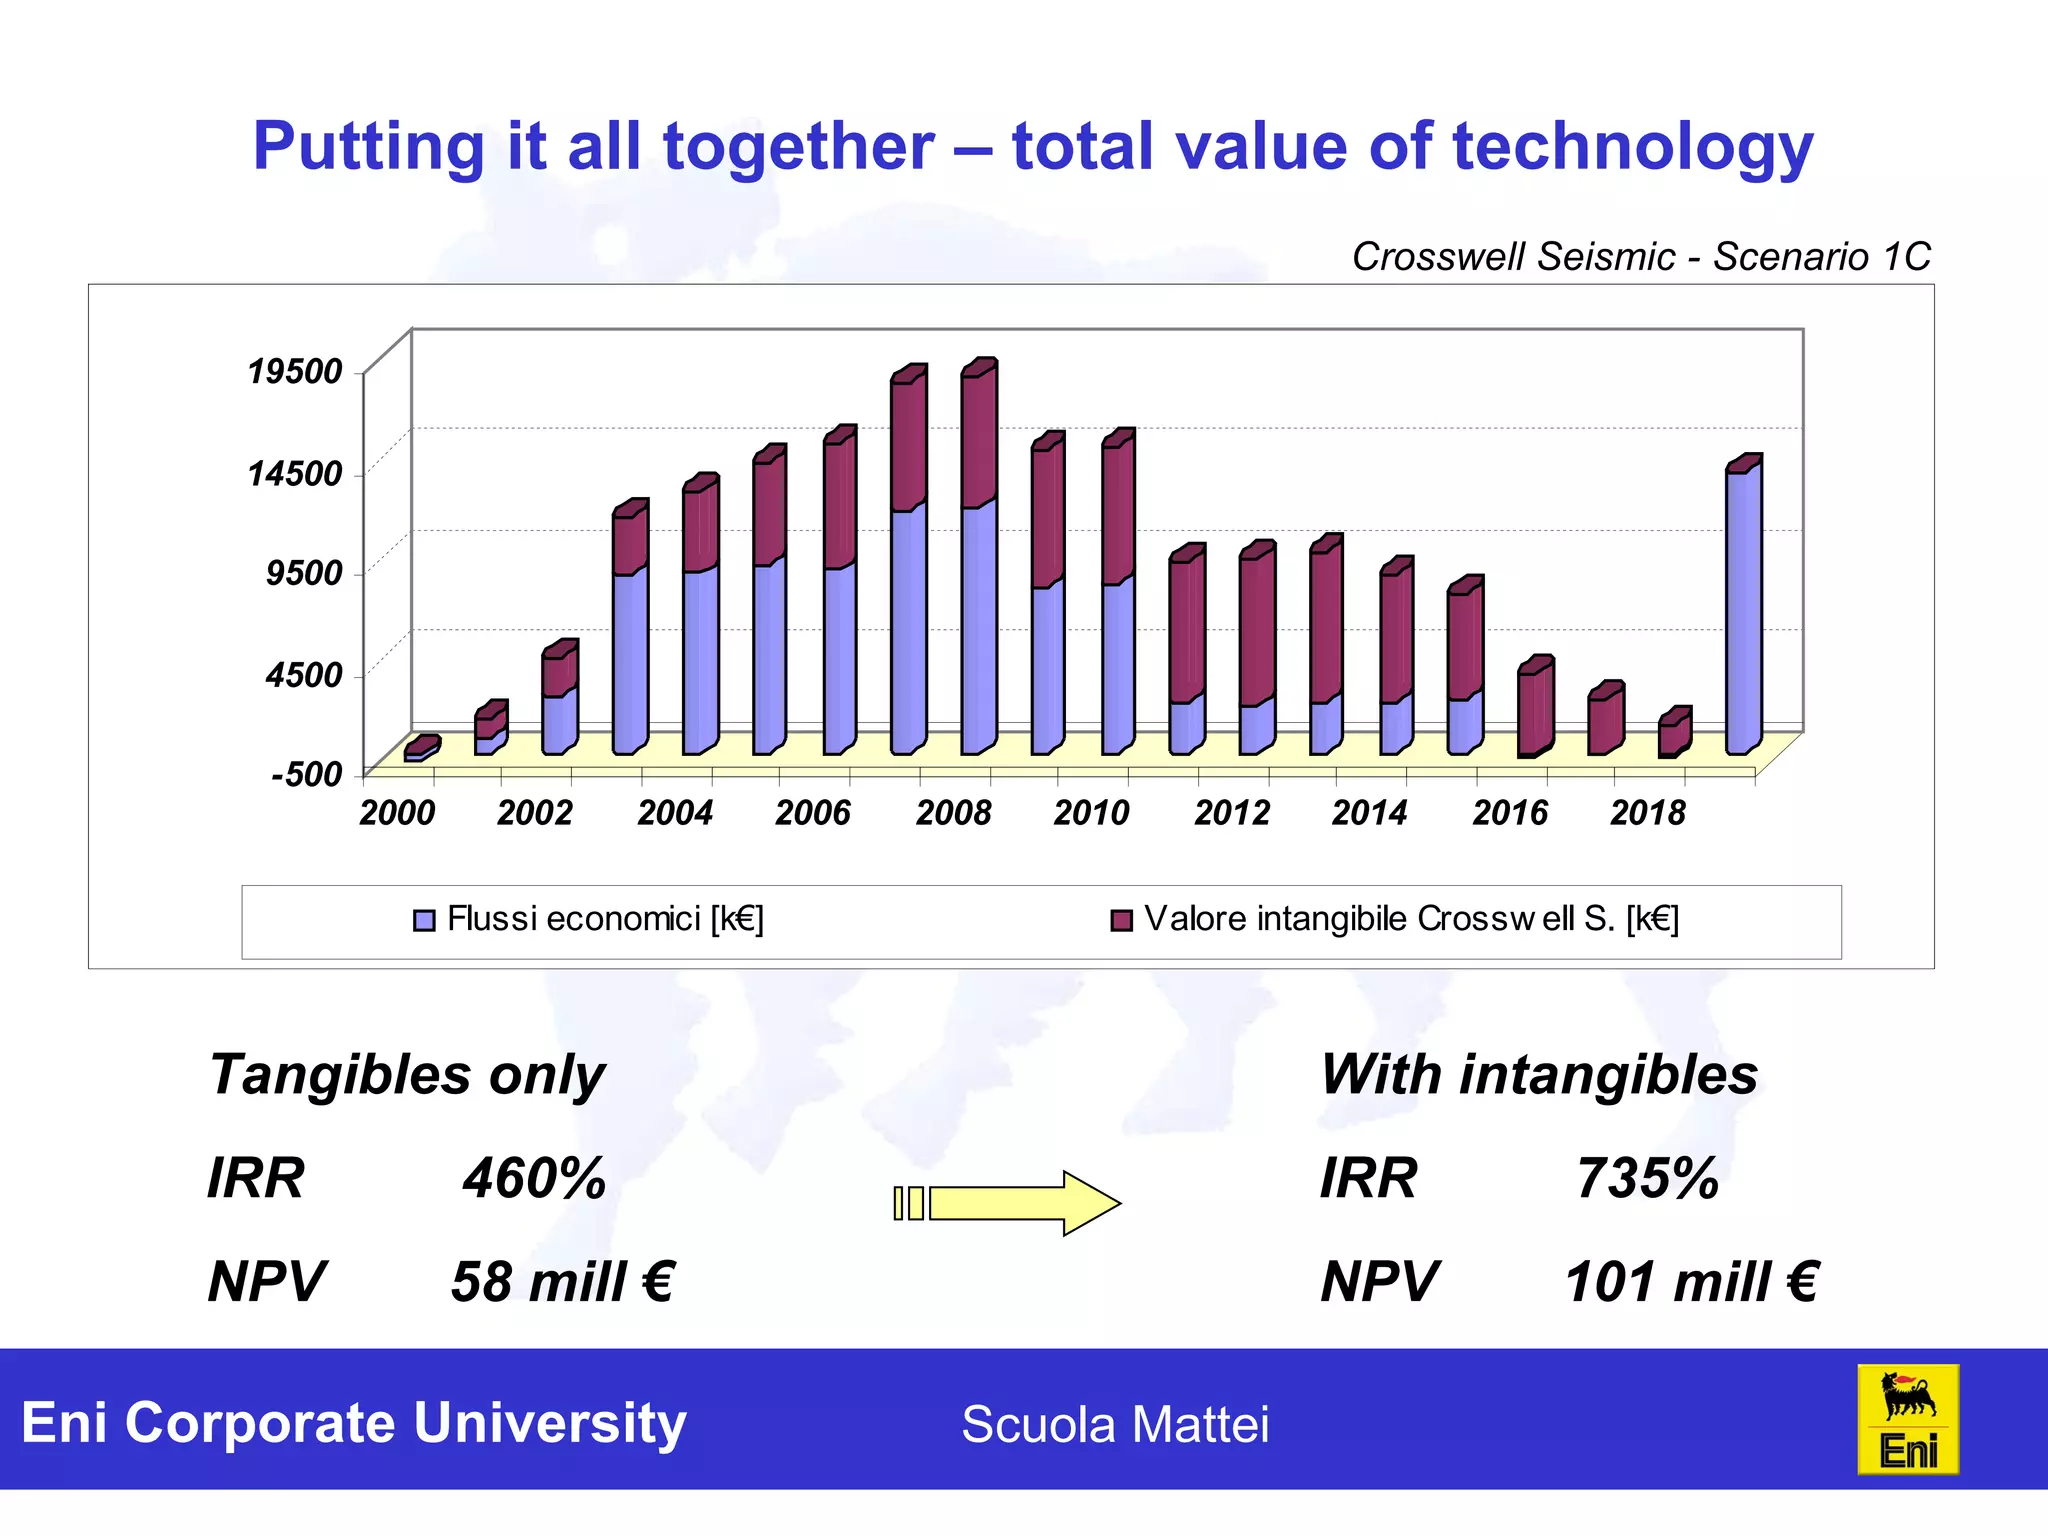
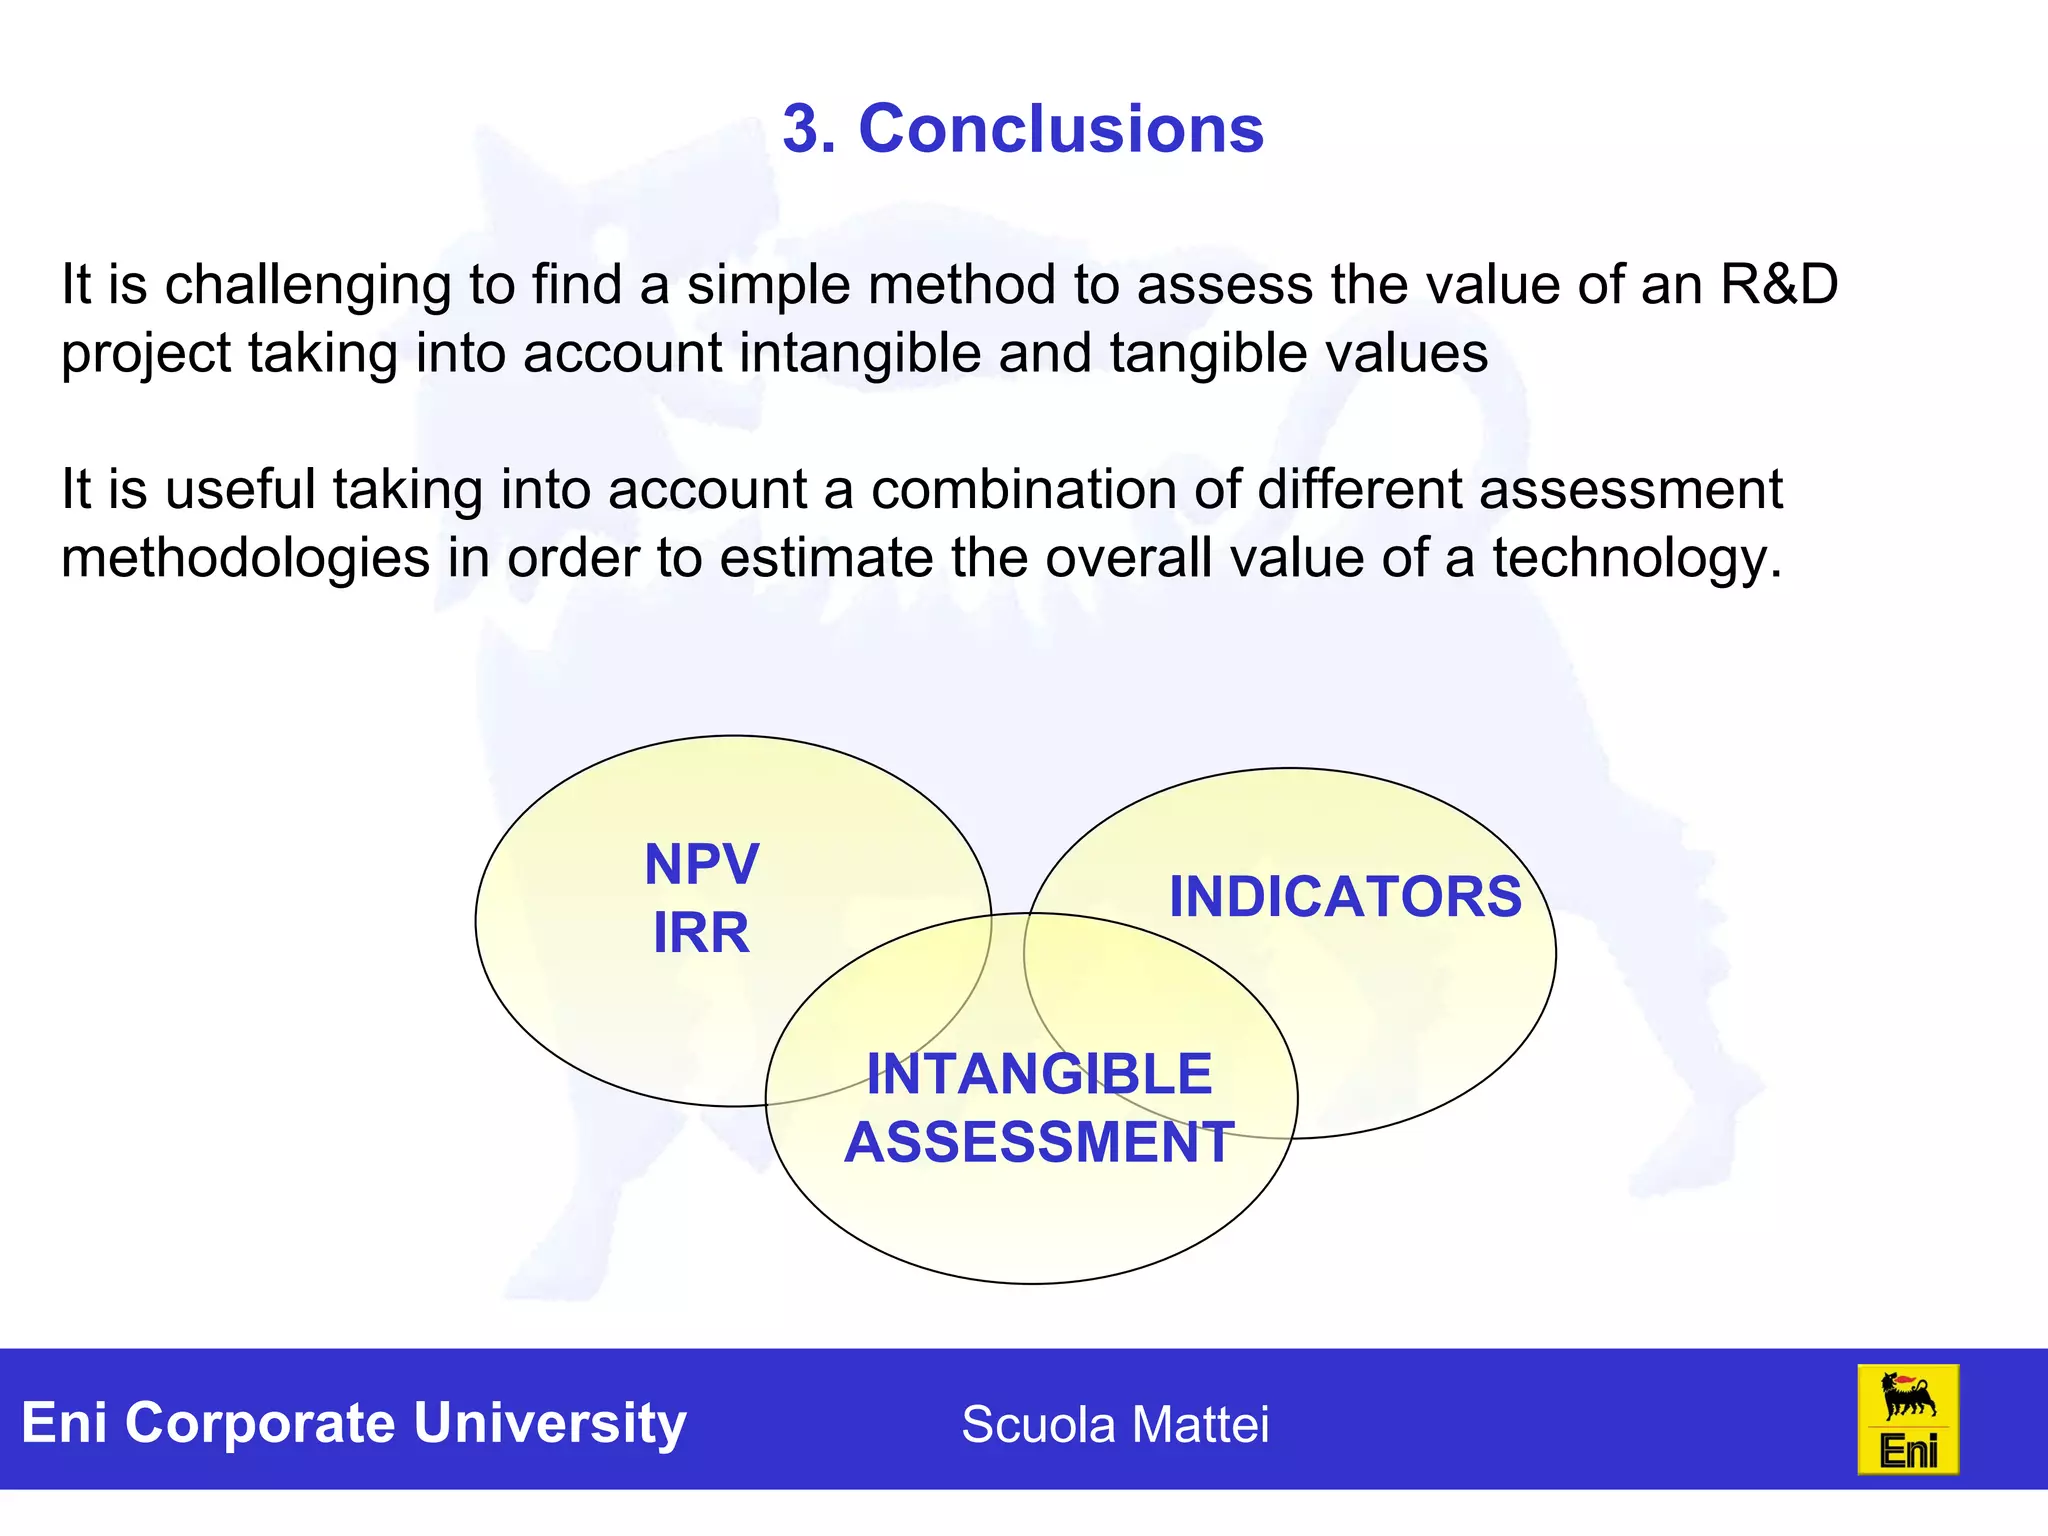
Economic Evaluation of Upstream Technology   Beyond NPV & IRR: touching on intangibles Paolo Boi Dean Cecil Bahr Lorenzo Dondi Andrea Mastropietro Edoardo Patriarca Budi Permana Kokok Prihandoko Ramin Soltani Yermek Zhakashev Massimo Antonelli Alberto F. Marsala Nicola De Blasio Giorgio Vicini Vincenzo Di Giulio
Beyond NPV & IRR Alternative indicators for tangibles Intangible benefits Conclusions
Beyond NPV & IRR Other indicators for tangibles Intangible benefits Conclusions
1. Other indicators for tangibles COST SAVING incremental NPV / R&D costs average incremental NPV per application / average application costs potential cost saving per application / R&D costs potential cost saving per application / application costs PRODUCTION INCREASE value of average incremental production per application / R&D cost value of average incremental production per application / application costs EXPECTED LIFE OF THE TECHNOLOGY R&D costs / expected life of the technology expected life of the technology / years of R&D
Other indicators for tangibles
Beyond NPV & IRR: intangible assessment Other indicators for tangibles Intangible benefits Conclusions
How to Measure Intangibles Market Capitalization Return on Invested Capital Scorecards Direct Measure of Intellectual Capital Brand Valuation
How to Evaluate Intangibles Market Capitalization Return on Invested Capital Scorecards Direct Measure of Intellectual Capital Brand Valuation Measure of the difference between a company’s market capitalization and book value  at Corporate level
How to Evaluate Intangibles Market Capitalization Return on Invested Capital Scorecards Direct Measure of Intellectual Capital Brand Valuation Comparison berween the ROIC of the firm and an industry reference index.  The spread gives the value creation capabilities of Intangible assets of the firm  at Corporate level
How to Evaluate Intangibles Market Capitalization Return on Invested Capital Direct Measure of Intellectual Capital Brand Valuation It allows to define a rating of Intangible assets on the basis of a set of key parameters (indicators) set for a specific asset Specific to S ingle Asset Scorecards
How to Evaluate Intangibles Market Capitalization Return on Invested Capital Brand Valuation Scorecards Direct Measure of Intellectual Capital Tries to identify the whole cash flows connected with a specific intangible asset  Specific to Single Asset
How to Evaluate Intangibles Market Capitalization Return on Invested Capital Scorecards Direct Measure of Intellectual Capital Brand Valuation Focused on a single intangible asset: the Brand (Company image) at Company level
Beyond NPV & IRR: intangible assessment Other indicators for tangibles Intangible benefits Conclusions
2. Intangible benefits Rating system for intangible benefits Intangible assessment A qualitative valuation of intangible benefits for different technologies based on an assessment methodology.  This methodology allows us to rank technologies based on their relative contribution to total corporate intangible value.
Intangible assessment Strategic relevance of the technology (strategy) Visibility, reputation, partnership ( external ) Corporate know-how improvement (internal) Relevance in strategic plan Relevance in current business Relevance on potential business Synergy effects on overall portfolio Partnership Visibility HSE & Social Excellence level  Level of technology innovation Information sharing Ownership - IP
Intangible assessment WEIGHTS GLOBAL EVALUATION
Intangible assessment Strategic relevance Know-how improvement Visibility, reputation, partnership
How to quantify intangibles After generating a ranking of the technology, we estimated the contribution of each technology to the total intangible value of the portfolio But… what is the whole intangible value of the technology portfolio? We assumed 3 different values for overall intangibles R&D expenses (100 mln € per year, structure costs included) 3 % of E&P revenues 5 % of E&P revenues
How to quantify intangibles By means of the rating obtained under the “Intangible Assessment”  procedure, we can try to distribute intangible value of R&D over the three technologies considered Intangible Values (million €)
Putting it all together – total value of technology With intangibles IRR  735% NPV  101 mill € Crosswell Seismic - Scenario 1C Tangibles only IRR  460% NPV  58 mill €
Beyond NPV & IRR: intangible assessment Other indicators for tangibles Intangible benefits Conclusions
3. Conclusions It is challenging to find a simple method to assess the value of an R&D project taking into account intangible and tangible values It is useful taking into account a combination of different assessment methodologies in order to estimate the overall value of a technology. NPV IRR INDICATORS INTANGIBLE ASSESSMENT
Thank you for your attention

Spe - Intangibles Impact On Bottom Line

  • 1.
    Economic Evaluation ofUpstream Technology Beyond NPV & IRR: touching on intangibles Paolo Boi Dean Cecil Bahr Lorenzo Dondi Andrea Mastropietro Edoardo Patriarca Budi Permana Kokok Prihandoko Ramin Soltani Yermek Zhakashev Massimo Antonelli Alberto F. Marsala Nicola De Blasio Giorgio Vicini Vincenzo Di Giulio
  • 2.
    Beyond NPV &IRR Alternative indicators for tangibles Intangible benefits Conclusions
  • 3.
    Beyond NPV &IRR Other indicators for tangibles Intangible benefits Conclusions
  • 4.
    1. Other indicatorsfor tangibles COST SAVING incremental NPV / R&D costs average incremental NPV per application / average application costs potential cost saving per application / R&D costs potential cost saving per application / application costs PRODUCTION INCREASE value of average incremental production per application / R&D cost value of average incremental production per application / application costs EXPECTED LIFE OF THE TECHNOLOGY R&D costs / expected life of the technology expected life of the technology / years of R&D
  • 5.
  • 6.
    Beyond NPV &IRR: intangible assessment Other indicators for tangibles Intangible benefits Conclusions
  • 7.
    How to MeasureIntangibles Market Capitalization Return on Invested Capital Scorecards Direct Measure of Intellectual Capital Brand Valuation
  • 8.
    How to EvaluateIntangibles Market Capitalization Return on Invested Capital Scorecards Direct Measure of Intellectual Capital Brand Valuation Measure of the difference between a company’s market capitalization and book value at Corporate level
  • 9.
    How to EvaluateIntangibles Market Capitalization Return on Invested Capital Scorecards Direct Measure of Intellectual Capital Brand Valuation Comparison berween the ROIC of the firm and an industry reference index. The spread gives the value creation capabilities of Intangible assets of the firm at Corporate level
  • 10.
    How to EvaluateIntangibles Market Capitalization Return on Invested Capital Direct Measure of Intellectual Capital Brand Valuation It allows to define a rating of Intangible assets on the basis of a set of key parameters (indicators) set for a specific asset Specific to S ingle Asset Scorecards
  • 11.
    How to EvaluateIntangibles Market Capitalization Return on Invested Capital Brand Valuation Scorecards Direct Measure of Intellectual Capital Tries to identify the whole cash flows connected with a specific intangible asset Specific to Single Asset
  • 12.
    How to EvaluateIntangibles Market Capitalization Return on Invested Capital Scorecards Direct Measure of Intellectual Capital Brand Valuation Focused on a single intangible asset: the Brand (Company image) at Company level
  • 13.
    Beyond NPV &IRR: intangible assessment Other indicators for tangibles Intangible benefits Conclusions
  • 14.
    2. Intangible benefitsRating system for intangible benefits Intangible assessment A qualitative valuation of intangible benefits for different technologies based on an assessment methodology. This methodology allows us to rank technologies based on their relative contribution to total corporate intangible value.
  • 15.
    Intangible assessment Strategicrelevance of the technology (strategy) Visibility, reputation, partnership ( external ) Corporate know-how improvement (internal) Relevance in strategic plan Relevance in current business Relevance on potential business Synergy effects on overall portfolio Partnership Visibility HSE & Social Excellence level Level of technology innovation Information sharing Ownership - IP
  • 16.
  • 17.
    Intangible assessment Strategicrelevance Know-how improvement Visibility, reputation, partnership
  • 18.
    How to quantifyintangibles After generating a ranking of the technology, we estimated the contribution of each technology to the total intangible value of the portfolio But… what is the whole intangible value of the technology portfolio? We assumed 3 different values for overall intangibles R&D expenses (100 mln € per year, structure costs included) 3 % of E&P revenues 5 % of E&P revenues
  • 19.
    How to quantifyintangibles By means of the rating obtained under the “Intangible Assessment” procedure, we can try to distribute intangible value of R&D over the three technologies considered Intangible Values (million €)
  • 20.
    Putting it alltogether – total value of technology With intangibles IRR 735% NPV 101 mill € Crosswell Seismic - Scenario 1C Tangibles only IRR 460% NPV 58 mill €
  • 21.
    Beyond NPV &IRR: intangible assessment Other indicators for tangibles Intangible benefits Conclusions
  • 22.
    3. Conclusions Itis challenging to find a simple method to assess the value of an R&D project taking into account intangible and tangible values It is useful taking into account a combination of different assessment methodologies in order to estimate the overall value of a technology. NPV IRR INDICATORS INTANGIBLE ASSESSMENT
  • 23.
    Thank you foryour attention

Editor's Notes

  • #2 A key component in the economic development of conventional and emerging oil and gas resources is the ability to map the distribution of reservoir rocks and fluids in the subsurface. The availability, resolution and quality of this information have bearing on production planning and optimization, as well as on the accurate assessment (or re-assessment) of reserves. The challenge for cost effective management of subsurface resources is to be able to represent the reservoir volume with adequate realism for its production performance to be confidently predicted. To build a realistic model of the reservoir volume requires a quantitative description of the flow path geometry and spatial distribution of the critical reservoir parameters (porosity, permeability, saturation and pressure) within the reservoir. The precision, resolution and confidence with which this information is known determines how well the production performance of a reservoir can be predicted, and ultimately, therefore, how well its economic performance can be forecast.