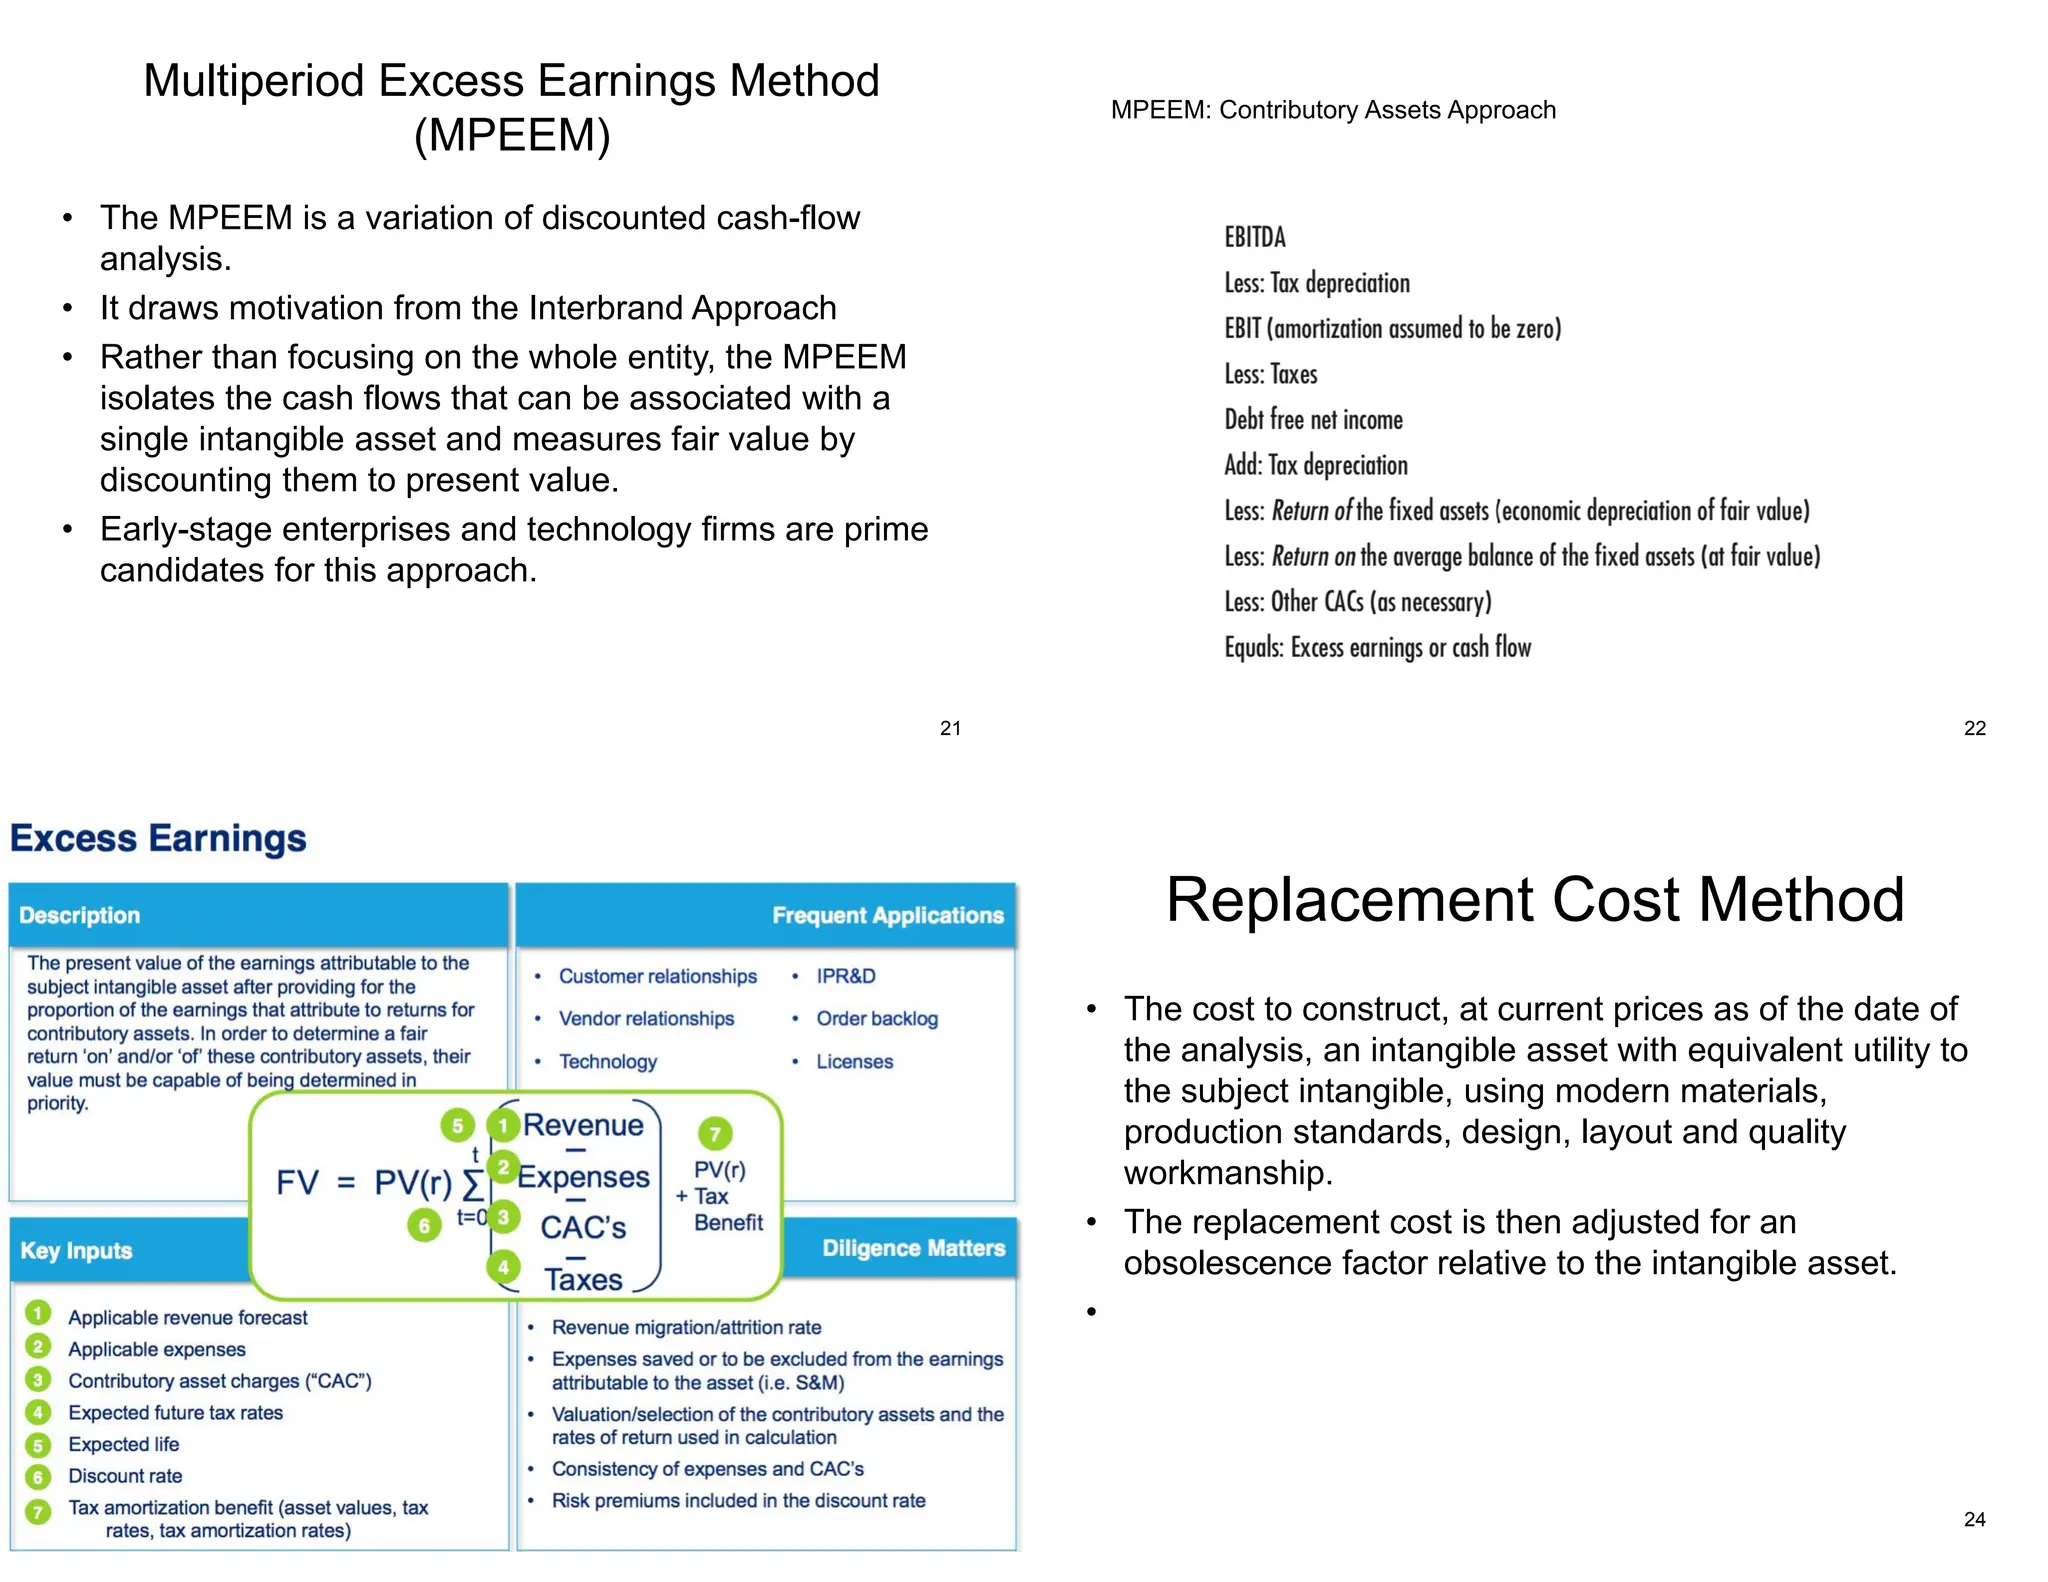
Business Valuation
DDM and Asset Approach
Dividend and valuation
• There are two types of investors:
– Living off dividend income
– Postposing current income for future growth
• For the first category, the present dividend yield,
frequency, and payout is important.
• The second category (those who prioritize dividend
growth over a stock's current dividend yield) may flock to
companies that have a lower dividend yield today, but
that have more potential to raise their dividend at a high
pace for many years. This ability to raise dividends at a
steep pace for a long period of time usually rests on two
pillars, a low dividend payout ratio, and a strong earnings
per share growth outlook.
2
3
Apple paid dividend first time in 2012. Apple’s share price was $34.28 on
June 01, 2017. It ended at $130.46 on June 01, 2021. Share price growth
outpaced dividend increases 4
Dividend as a source of value:
Fiscal Dividend Basic EPS Payout Annual Return Dividend Yield
2021 17 42.37 40.12% 93.93% 1.27%
2020 17.5 36.34 48.16% -1.18% 2.53%
2019 21.5 33.66 63.87% 28.34% 3.07%
2018 43.5 71.28 61.03% 34.38% 7.98%
2017 25.75 60.16 42.80% -22.22% 6.35%
2016 24.25 55.26 43.88% 27.45% 4.65%
2015 59.5 105.91 56.18% 24.75% 14.55%
2014 63 178.39 35.32% 44.80% 19.22%
2013 42 158.76 26.46% -8.24% 18.55%
2012 47 147.51 31.86% -14.20% 19.05%
2011 60 112.26 53.45% 7.84% 20.87%
2010 25 101.1 24.73% 83.75% 9.38%
2009 23.5 101.71 23.10% -12.01% 16.20%
2008 33.5 78.15 42.87% -13.96% 20.32%
2007 11.5 66.05 17.41% -34.42% 6.00%
2006 44.5 87.72 50.73% 238.62% 15.23%
2005 11.5 70.21 16.38% 49.88% 13.33%
2004 129.5 186.6 69.40% 86.28% 224.90%
2003 14.5 144.68 10.02% -23.87% 46.91%
2002 12.5 122.12 10.24% 30.79%
5
Infosys:
Listed
in
1993.
First
time
paid
dividen
d in
FY2002
6
Asset Approach: premises of value
• Sale as a going concern:
– Value-in-use
• Fair market value of assets and liabilities
• Sale on a liquidation premise:
– Liquidation value (value-in-exchange)
• Orderly liquidation.
• Forced liquidation
• Treatment of non-recurring/ non-operating
assets and liabilities in case of valuation of
controlling/ minority interest.
7
Asset Approach: When Used?
• May be important in capital intensive
industries or in acquisitions where valuable
non-operating assets can be stripped after
the purchase of the company to recover part
of acquisition cost.
• Where there are no (or very little) intangibles.
• This approach is inappropriate in case of
acquisition/sale of minority interests.
Asset-based valuation
• Replacement cost or liquidation value
approaches ignore the future potential of a
company.
• Therefore, use them only in situations where
ongoing operations are in jeopardy.
• Liquidation value is often far different from the
value of the company as a going concern.
• Do not use liquidation approach unless
liquidation is likely at the end of the forecast
period.
8
Asset-based valuation
• The replacement cost approach sets the value
equal to the expected cost to replace the
company’s assets. This approach has at least
two drawbacks:
– Not all tangible assets are replaceable. The replacement
cost of just the company’s tangible assets may greatly
understate the value of the company
– Not all the company’s assets will ever be replaced.
Replacement cost of an existing asset may be so high
that replacing it is not economical. Hence, replacement
cost may exceed the value of the business as an
ongoing entity.
9
Valuation of Intangible Assets
10
Why Intangibles?
• Intangible assets are becoming increasingly important to
the growth, profitability, and value of companies.
• Beyond allowances for goodwill, some branding and IP,
intangible assets are not accurately or fully measured
and incorporated into company financial statements.
• Poor or incomplete measurement of these assets leads
to understated company profitability and valuations.
• As the broader economy becomes increasingly driven by
data and other difficult to measure properties, focusing
on the value of intangible assets will become more
critical to long-term investment success.
11
Features of Intangible Assets
• Data is the new intangible asset. McDonald’s has
recipes and cooking processes that have been
invaluable to that company’s success, but you won’t find
either on its balance sheet
• Features
– Scalability (The platforms, systems, and processes created by
technology firms are certainly scalable.)
– Sunk Costs (if they turn out to be a dud, then they can represent
massive sunk costs that turn into massive losses)
– Synergies (Synergies occur when intangible assets are
complementary to other assets. For example, Amazon’s Alexa software
is much more valuable when paired with their Echo hardware.)
– Spillovers (occur when intangible assets leak out of the exclusive
use by the company that created them, allowing other companies to
profit from the first company’s investment.) 12
Intangibles: Not Insignificant
Company Goodwill(%) Intangibles(%) Assets($bn) Goodwill(%) Intangibles(%) Assets($bn)
Microsoft 14.7 2.7 286.5 13.7 3.1 258.8
Alphabet 5.7 0.7 275.9 7.7 0.9 232.8
Facebook 14 0.7 133.3 18.8 1.3 97.3
Merck & co. 23 16.7 84.4 22 15.9 82.6
2019 2018
13
Source: 10K
14
Valuation Models
• Relief from Royalty Method
• Interbrand approach
• Multiperiod excess earnings method
(MPEEM)
• Replacement Cost Method
• Real Options Method
15
Relief from Royalty Method
(RRM)
• The rationale behind the RRM is fairly intuitive:
Owning an intangible asset means the
underlying entity doesn't have to pay for the
privilege of deploying that asset.
• The RRM is often used to value domain names,
trademarks, licensed computer software, and in-
progress R&D that can be tied to a specific
revenue stream and where data on royalty and
license fees from other market transactions are
available.
16
RRM Methodology
• Methodology:
– Project financial information for the overall enterprise, including
revenue, growth rates, and tax rates and estimates.
– Determine the underlining base for the calculation of royalty (%
of turnover , number of units etc.)
– Estimate a suitable royalty rate for the intangible asset based on
an analysis of royalty rates from publicly available information for
similar domain names and of the industry in question. Determine
a growth rate, expected life and discount rate for the brand
– Apply the royalty rate to the estimated revenue stream.
– Estimating a discount rate for the after-tax royalty savings and
discount to present value.
17 18
19
Interbrand Approach
• Interbrand takes the forecast profit and deducts a capital charge in order to
determine the economic profit (EVA).
• Interbrand then attempts to determine the brand's earnings by using the
"brand index".
• The "brand index" is based on seven factors
• 1. Market (10%) – Whether the market is stable, growing and has strong barriers to
entry
• 2. Stability (15%) – Brands that have been established for a long time that constantly
command customer loyalty (volatility of net profit margin over the years)
• 3. Leadership (25%) – A brand that leads the sector that it competes in (market share, net
profit margin, market cap, revenue growth etc.)
• 4. Trend (10%) – Gives an indication where the brand is moving (correlation with return of
assets)
• 5. Support (10%) – The support that the brand has received (additional investment made in
the brand)
• 6. Internationalization/Geography (25%) – The strength of the brand in the international
arena (export as % of total revenue)
• 7. Protection (5%) – The ability of the company to protect the brand (threat against
acquisition, financial distress- interest coverage ratio)
20
Multiperiod Excess Earnings Method
(MPEEM)
• The MPEEM is a variation of discounted cash-flow
analysis.
• It draws motivation from the Interbrand Approach
• Rather than focusing on the whole entity, the MPEEM
isolates the cash flows that can be associated with a
single intangible asset and measures fair value by
discounting them to present value.
• Early-stage enterprises and technology firms are prime
candidates for this approach.
21 22
MPEEM: Contributory Assets Approach
23
Replacement Cost Method
• The cost to construct, at current prices as of the date of
the analysis, an intangible asset with equivalent utility to
the subject intangible, using modern materials,
production standards, design, layout and quality
workmanship.
• The replacement cost is then adjusted for an
obsolescence factor relative to the intangible asset.
•
24
25
This valuation exercise considers the tax impact of the asset's amortization,
which is most relevant if the intangible asset is considered within the
framework of the valuation of an overall enterprise. For stand-alone asset
valuation, a pre-tax number is more appropriate.

2.pdf

  • 1.
    Business Valuation DDM andAsset Approach Dividend and valuation • There are two types of investors: – Living off dividend income – Postposing current income for future growth • For the first category, the present dividend yield, frequency, and payout is important. • The second category (those who prioritize dividend growth over a stock's current dividend yield) may flock to companies that have a lower dividend yield today, but that have more potential to raise their dividend at a high pace for many years. This ability to raise dividends at a steep pace for a long period of time usually rests on two pillars, a low dividend payout ratio, and a strong earnings per share growth outlook. 2 3 Apple paid dividend first time in 2012. Apple’s share price was $34.28 on June 01, 2017. It ended at $130.46 on June 01, 2021. Share price growth outpaced dividend increases 4
  • 2.
    Dividend as asource of value: Fiscal Dividend Basic EPS Payout Annual Return Dividend Yield 2021 17 42.37 40.12% 93.93% 1.27% 2020 17.5 36.34 48.16% -1.18% 2.53% 2019 21.5 33.66 63.87% 28.34% 3.07% 2018 43.5 71.28 61.03% 34.38% 7.98% 2017 25.75 60.16 42.80% -22.22% 6.35% 2016 24.25 55.26 43.88% 27.45% 4.65% 2015 59.5 105.91 56.18% 24.75% 14.55% 2014 63 178.39 35.32% 44.80% 19.22% 2013 42 158.76 26.46% -8.24% 18.55% 2012 47 147.51 31.86% -14.20% 19.05% 2011 60 112.26 53.45% 7.84% 20.87% 2010 25 101.1 24.73% 83.75% 9.38% 2009 23.5 101.71 23.10% -12.01% 16.20% 2008 33.5 78.15 42.87% -13.96% 20.32% 2007 11.5 66.05 17.41% -34.42% 6.00% 2006 44.5 87.72 50.73% 238.62% 15.23% 2005 11.5 70.21 16.38% 49.88% 13.33% 2004 129.5 186.6 69.40% 86.28% 224.90% 2003 14.5 144.68 10.02% -23.87% 46.91% 2002 12.5 122.12 10.24% 30.79% 5 Infosys: Listed in 1993. First time paid dividen d in FY2002 6 Asset Approach: premises of value • Sale as a going concern: – Value-in-use • Fair market value of assets and liabilities • Sale on a liquidation premise: – Liquidation value (value-in-exchange) • Orderly liquidation. • Forced liquidation • Treatment of non-recurring/ non-operating assets and liabilities in case of valuation of controlling/ minority interest. 7 Asset Approach: When Used? • May be important in capital intensive industries or in acquisitions where valuable non-operating assets can be stripped after the purchase of the company to recover part of acquisition cost. • Where there are no (or very little) intangibles. • This approach is inappropriate in case of acquisition/sale of minority interests. Asset-based valuation • Replacement cost or liquidation value approaches ignore the future potential of a company. • Therefore, use them only in situations where ongoing operations are in jeopardy. • Liquidation value is often far different from the value of the company as a going concern. • Do not use liquidation approach unless liquidation is likely at the end of the forecast period. 8
  • 3.
    Asset-based valuation • Thereplacement cost approach sets the value equal to the expected cost to replace the company’s assets. This approach has at least two drawbacks: – Not all tangible assets are replaceable. The replacement cost of just the company’s tangible assets may greatly understate the value of the company – Not all the company’s assets will ever be replaced. Replacement cost of an existing asset may be so high that replacing it is not economical. Hence, replacement cost may exceed the value of the business as an ongoing entity. 9 Valuation of Intangible Assets 10 Why Intangibles? • Intangible assets are becoming increasingly important to the growth, profitability, and value of companies. • Beyond allowances for goodwill, some branding and IP, intangible assets are not accurately or fully measured and incorporated into company financial statements. • Poor or incomplete measurement of these assets leads to understated company profitability and valuations. • As the broader economy becomes increasingly driven by data and other difficult to measure properties, focusing on the value of intangible assets will become more critical to long-term investment success. 11 Features of Intangible Assets • Data is the new intangible asset. McDonald’s has recipes and cooking processes that have been invaluable to that company’s success, but you won’t find either on its balance sheet • Features – Scalability (The platforms, systems, and processes created by technology firms are certainly scalable.) – Sunk Costs (if they turn out to be a dud, then they can represent massive sunk costs that turn into massive losses) – Synergies (Synergies occur when intangible assets are complementary to other assets. For example, Amazon’s Alexa software is much more valuable when paired with their Echo hardware.) – Spillovers (occur when intangible assets leak out of the exclusive use by the company that created them, allowing other companies to profit from the first company’s investment.) 12
  • 4.
    Intangibles: Not Insignificant CompanyGoodwill(%) Intangibles(%) Assets($bn) Goodwill(%) Intangibles(%) Assets($bn) Microsoft 14.7 2.7 286.5 13.7 3.1 258.8 Alphabet 5.7 0.7 275.9 7.7 0.9 232.8 Facebook 14 0.7 133.3 18.8 1.3 97.3 Merck & co. 23 16.7 84.4 22 15.9 82.6 2019 2018 13 Source: 10K 14 Valuation Models • Relief from Royalty Method • Interbrand approach • Multiperiod excess earnings method (MPEEM) • Replacement Cost Method • Real Options Method 15 Relief from Royalty Method (RRM) • The rationale behind the RRM is fairly intuitive: Owning an intangible asset means the underlying entity doesn't have to pay for the privilege of deploying that asset. • The RRM is often used to value domain names, trademarks, licensed computer software, and in- progress R&D that can be tied to a specific revenue stream and where data on royalty and license fees from other market transactions are available. 16
  • 5.
    RRM Methodology • Methodology: –Project financial information for the overall enterprise, including revenue, growth rates, and tax rates and estimates. – Determine the underlining base for the calculation of royalty (% of turnover , number of units etc.) – Estimate a suitable royalty rate for the intangible asset based on an analysis of royalty rates from publicly available information for similar domain names and of the industry in question. Determine a growth rate, expected life and discount rate for the brand – Apply the royalty rate to the estimated revenue stream. – Estimating a discount rate for the after-tax royalty savings and discount to present value. 17 18 19 Interbrand Approach • Interbrand takes the forecast profit and deducts a capital charge in order to determine the economic profit (EVA). • Interbrand then attempts to determine the brand's earnings by using the "brand index". • The "brand index" is based on seven factors • 1. Market (10%) – Whether the market is stable, growing and has strong barriers to entry • 2. Stability (15%) – Brands that have been established for a long time that constantly command customer loyalty (volatility of net profit margin over the years) • 3. Leadership (25%) – A brand that leads the sector that it competes in (market share, net profit margin, market cap, revenue growth etc.) • 4. Trend (10%) – Gives an indication where the brand is moving (correlation with return of assets) • 5. Support (10%) – The support that the brand has received (additional investment made in the brand) • 6. Internationalization/Geography (25%) – The strength of the brand in the international arena (export as % of total revenue) • 7. Protection (5%) – The ability of the company to protect the brand (threat against acquisition, financial distress- interest coverage ratio) 20
  • 6.
    Multiperiod Excess EarningsMethod (MPEEM) • The MPEEM is a variation of discounted cash-flow analysis. • It draws motivation from the Interbrand Approach • Rather than focusing on the whole entity, the MPEEM isolates the cash flows that can be associated with a single intangible asset and measures fair value by discounting them to present value. • Early-stage enterprises and technology firms are prime candidates for this approach. 21 22 MPEEM: Contributory Assets Approach 23 Replacement Cost Method • The cost to construct, at current prices as of the date of the analysis, an intangible asset with equivalent utility to the subject intangible, using modern materials, production standards, design, layout and quality workmanship. • The replacement cost is then adjusted for an obsolescence factor relative to the intangible asset. • 24
  • 7.
    25 This valuation exerciseconsiders the tax impact of the asset's amortization, which is most relevant if the intangible asset is considered within the framework of the valuation of an overall enterprise. For stand-alone asset valuation, a pre-tax number is more appropriate.