Downloaded 119 times
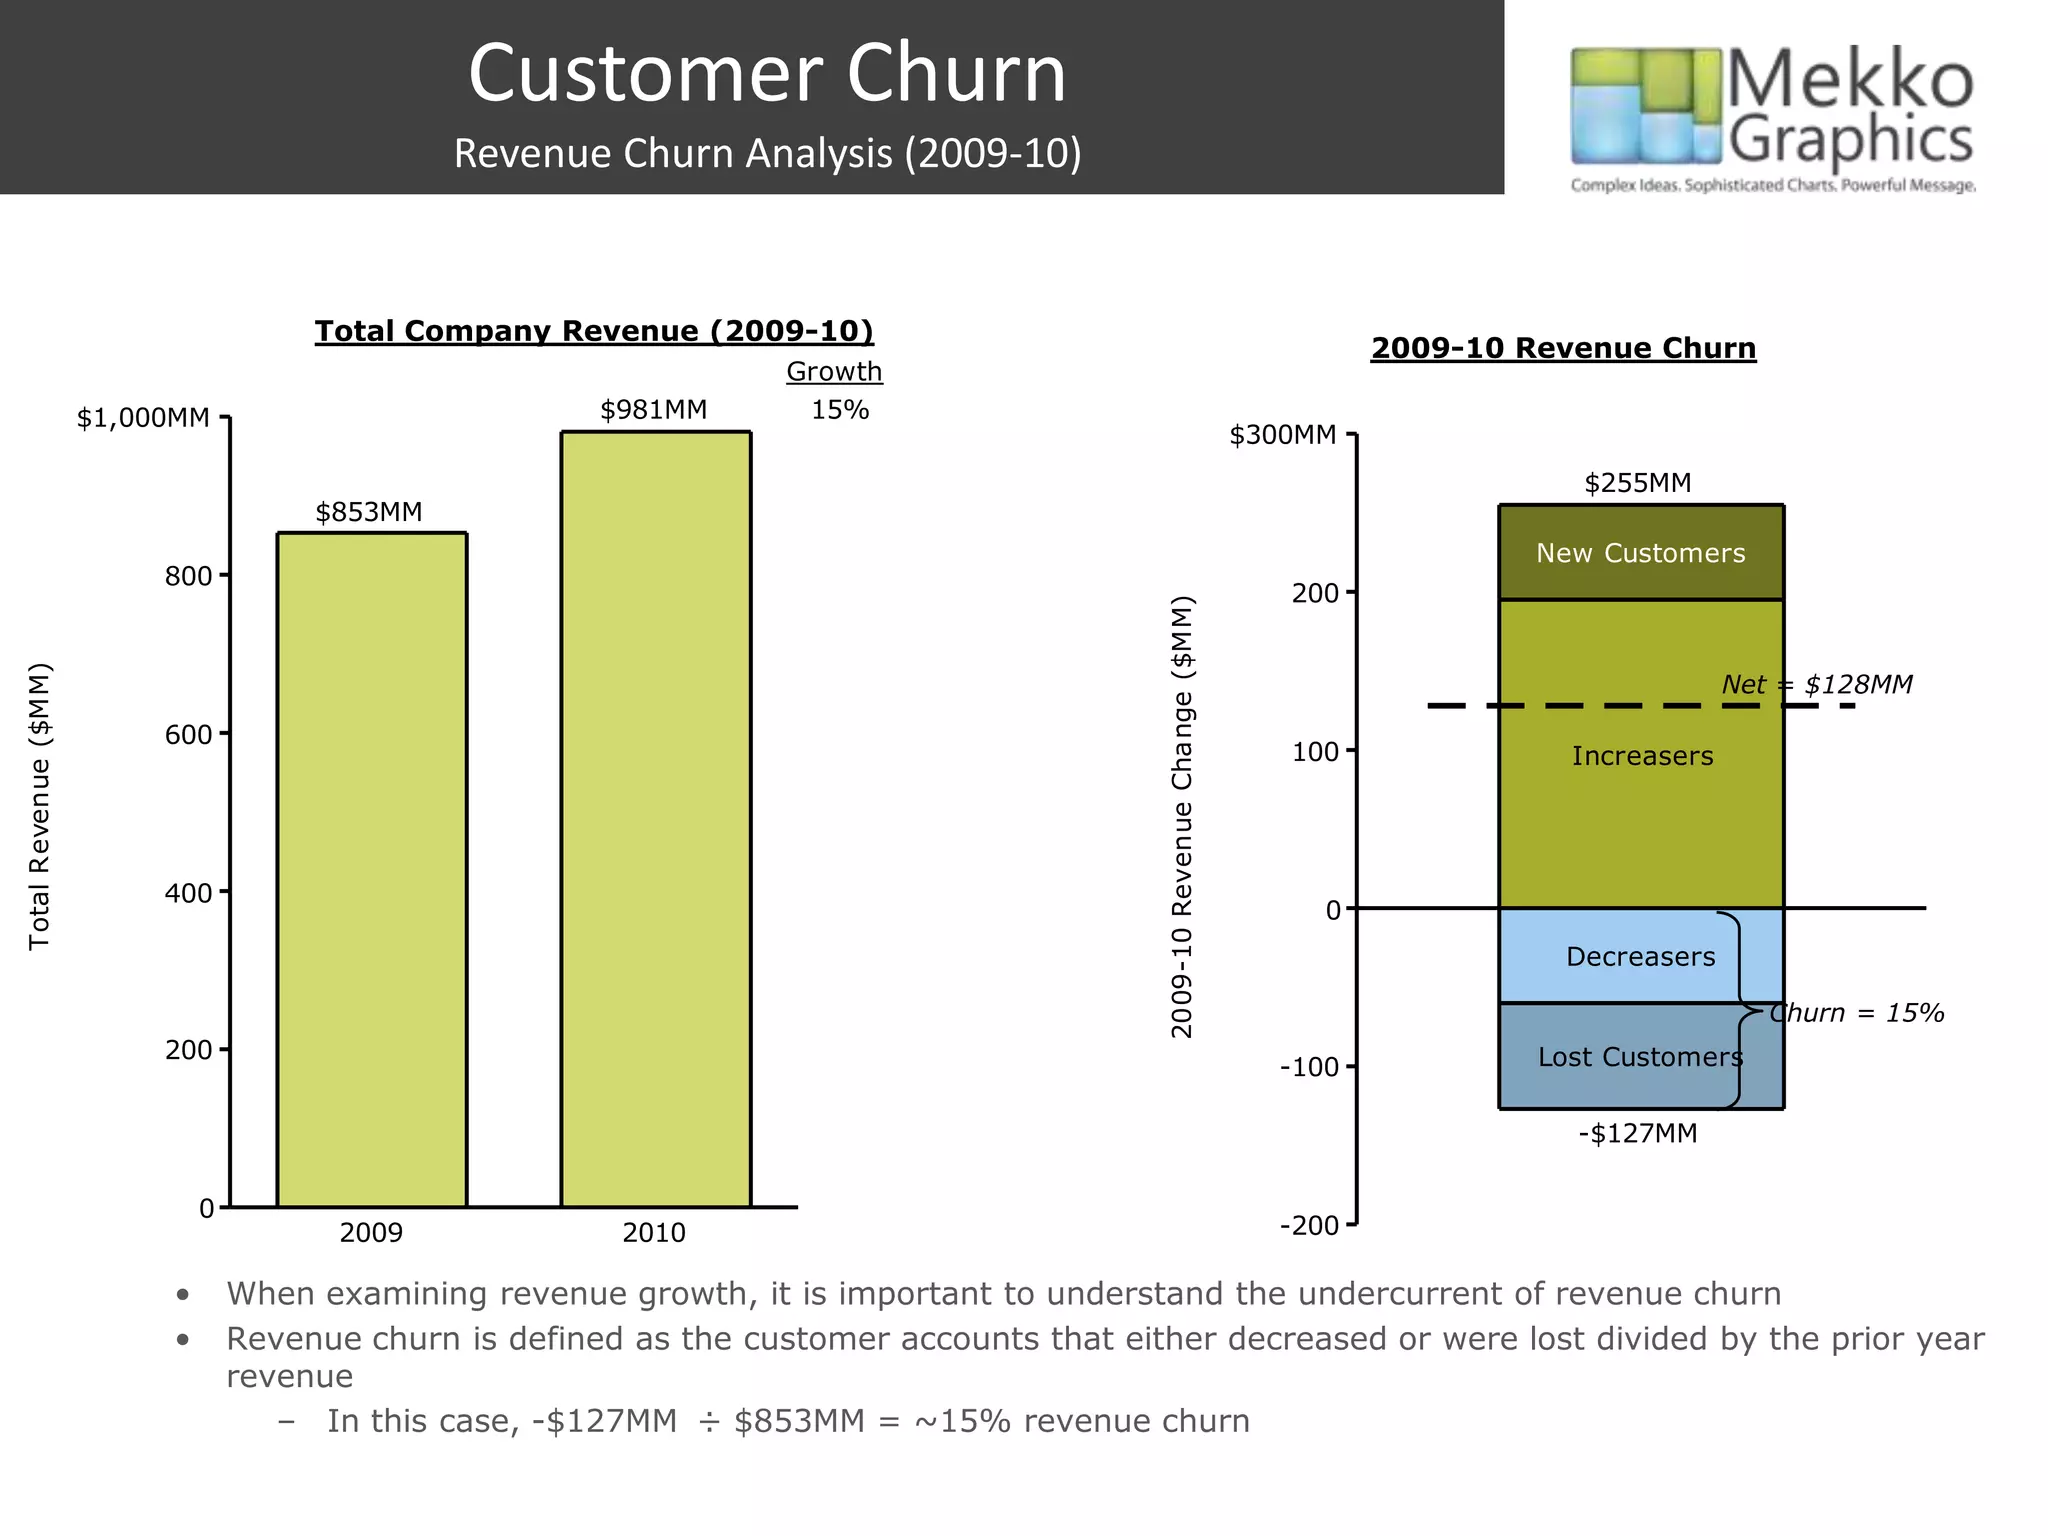
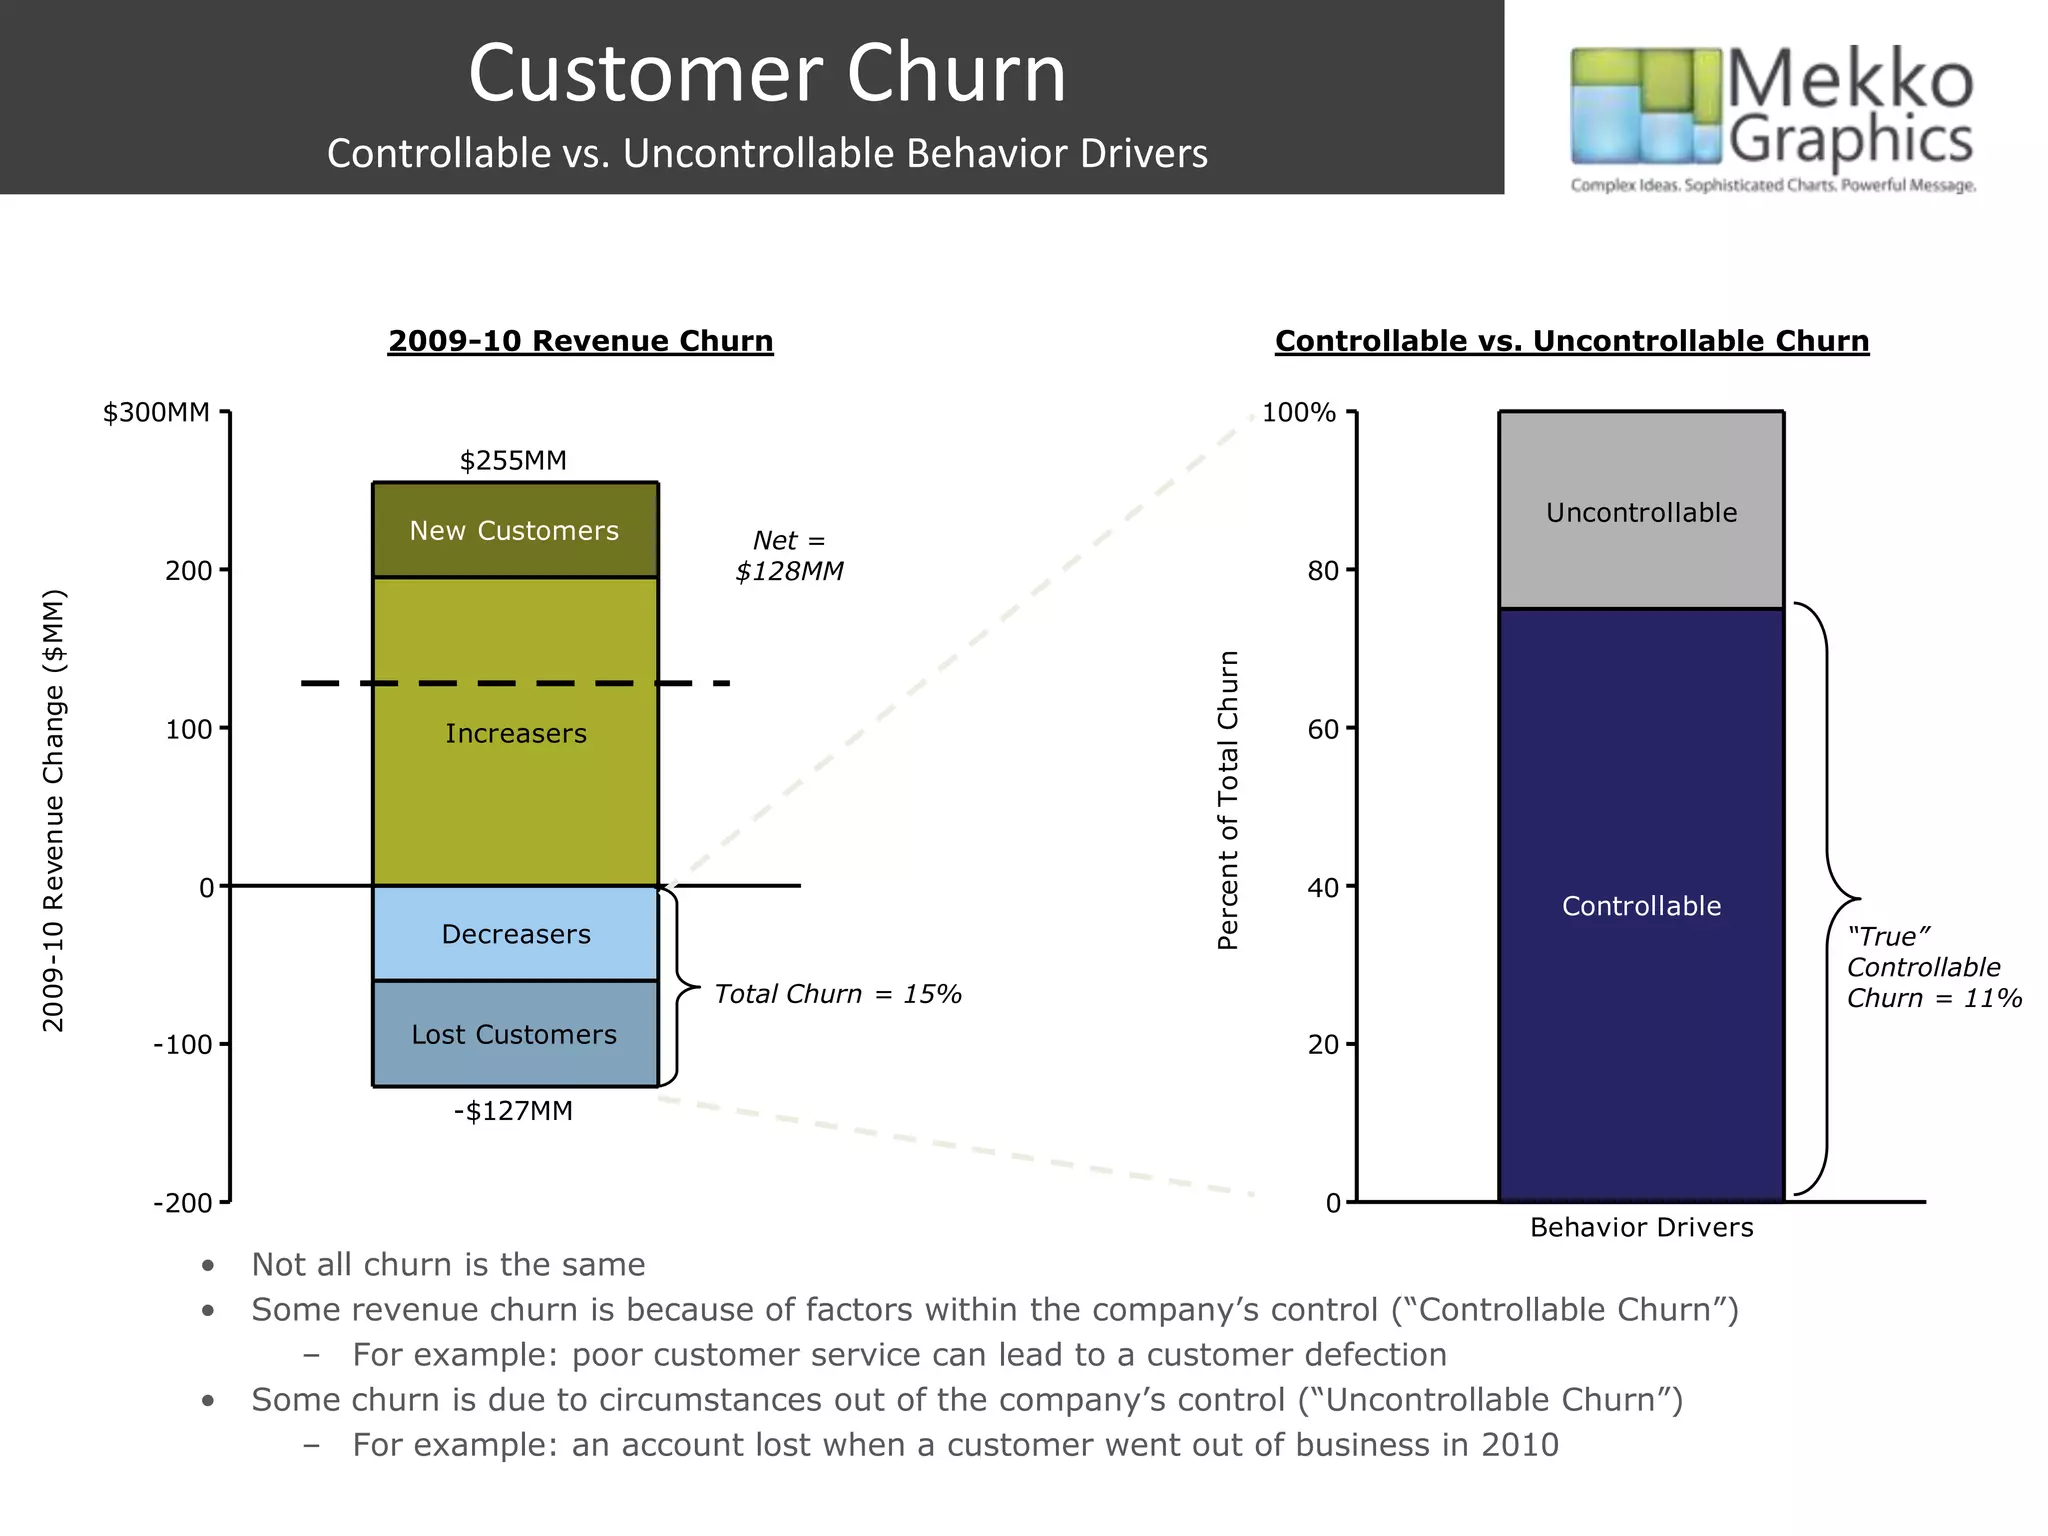
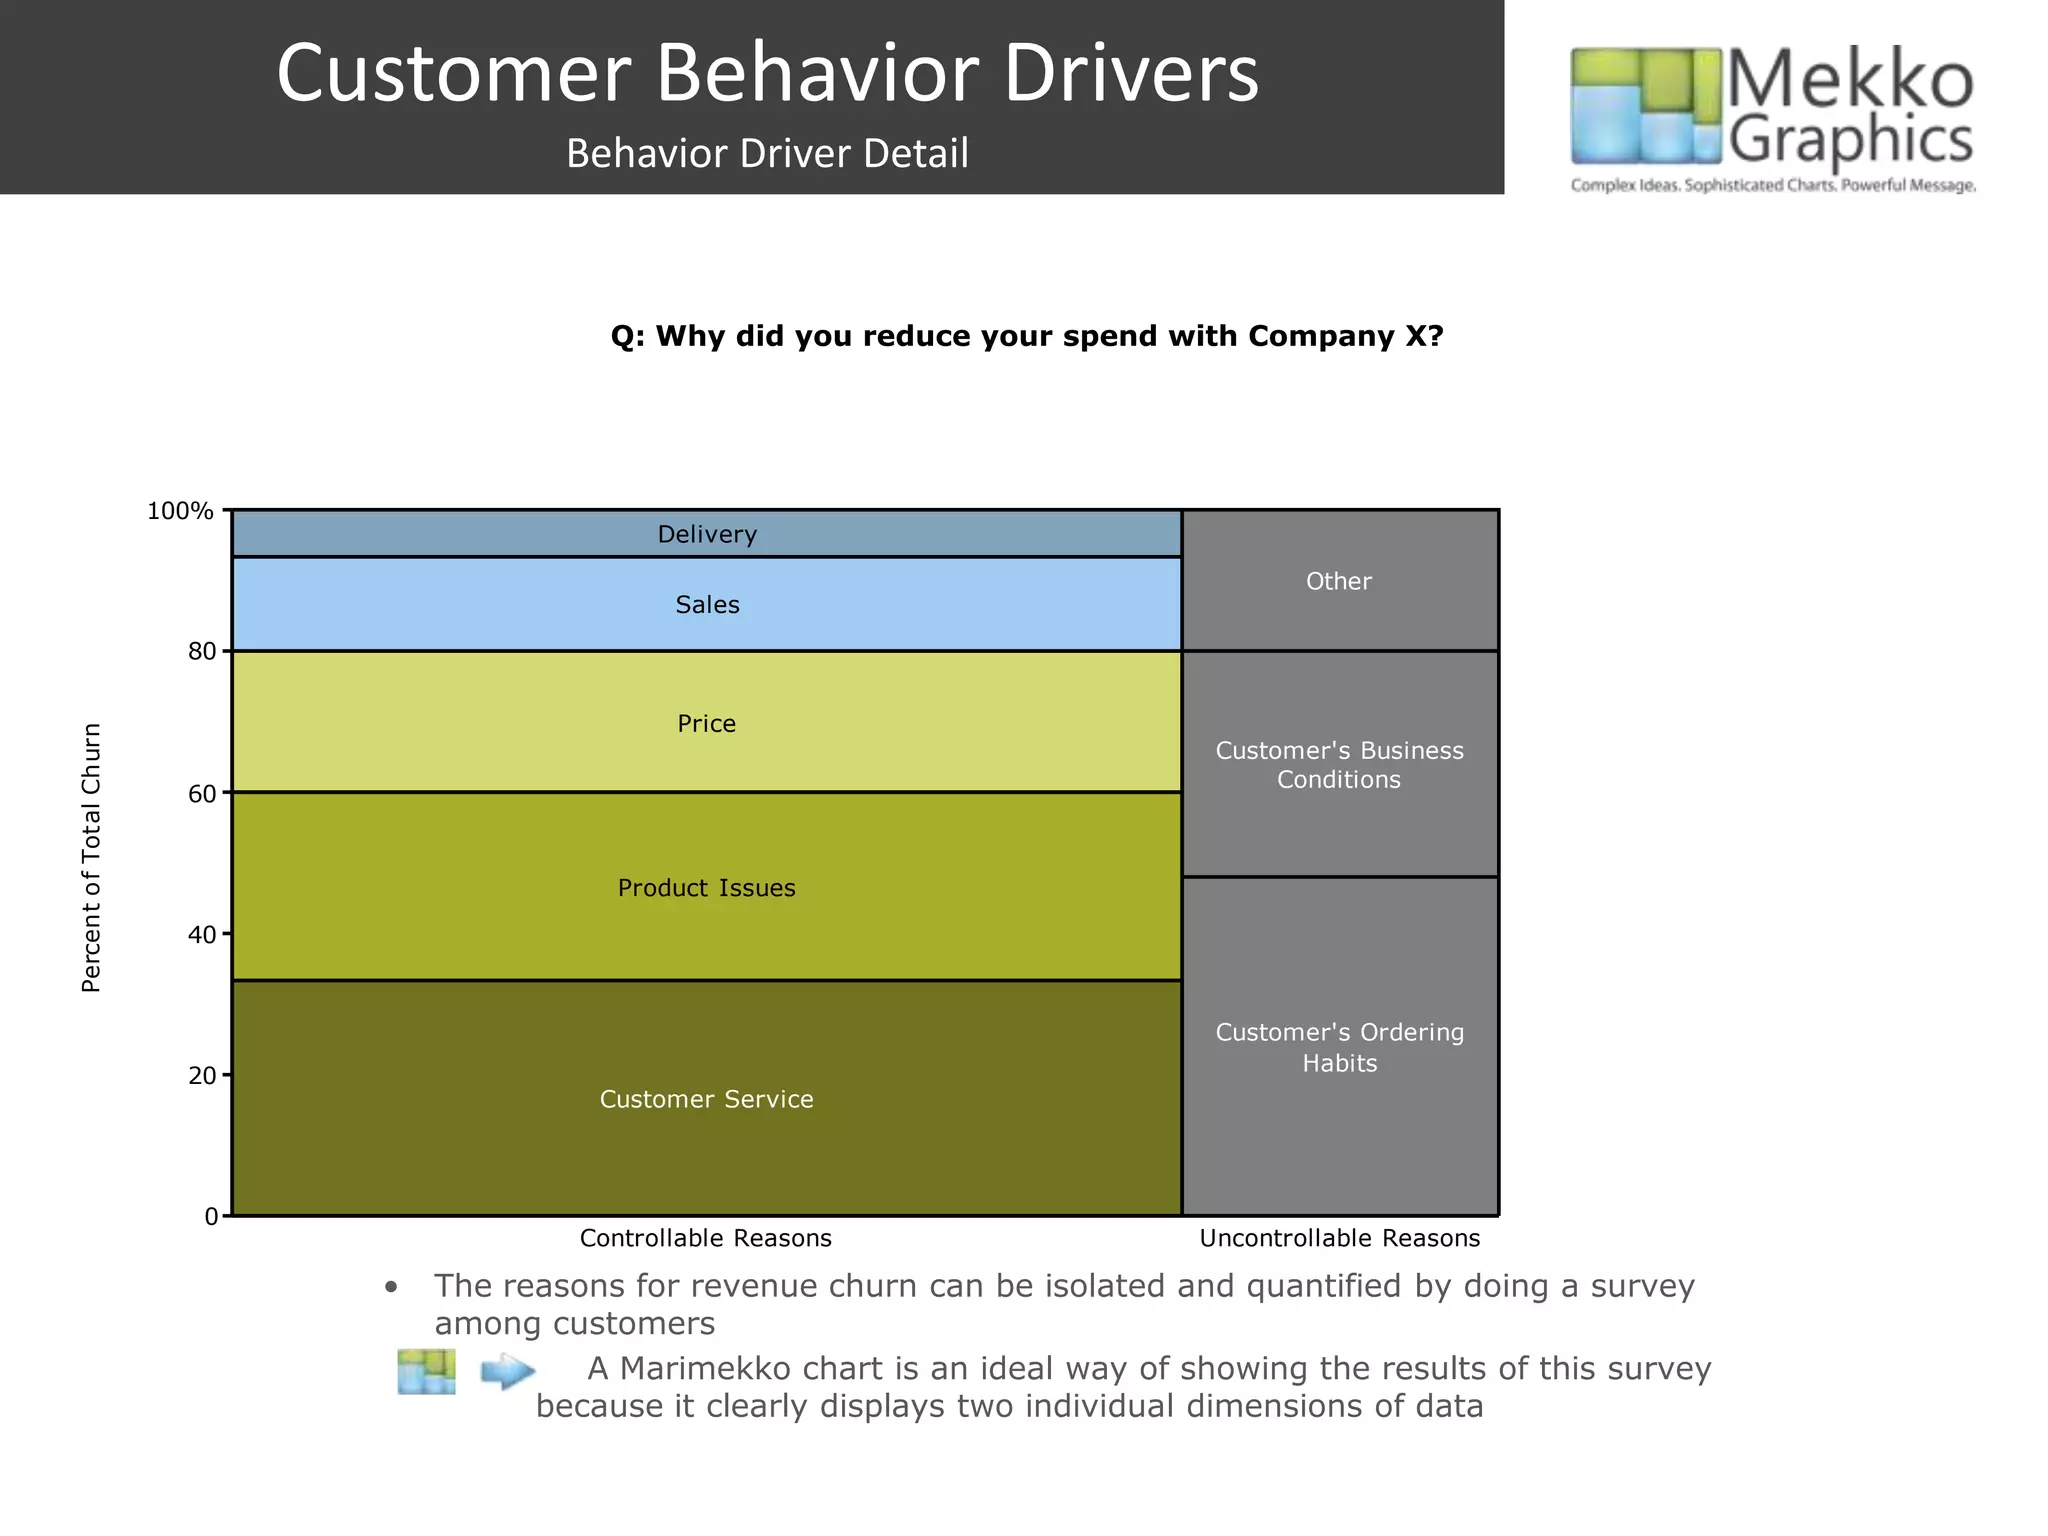
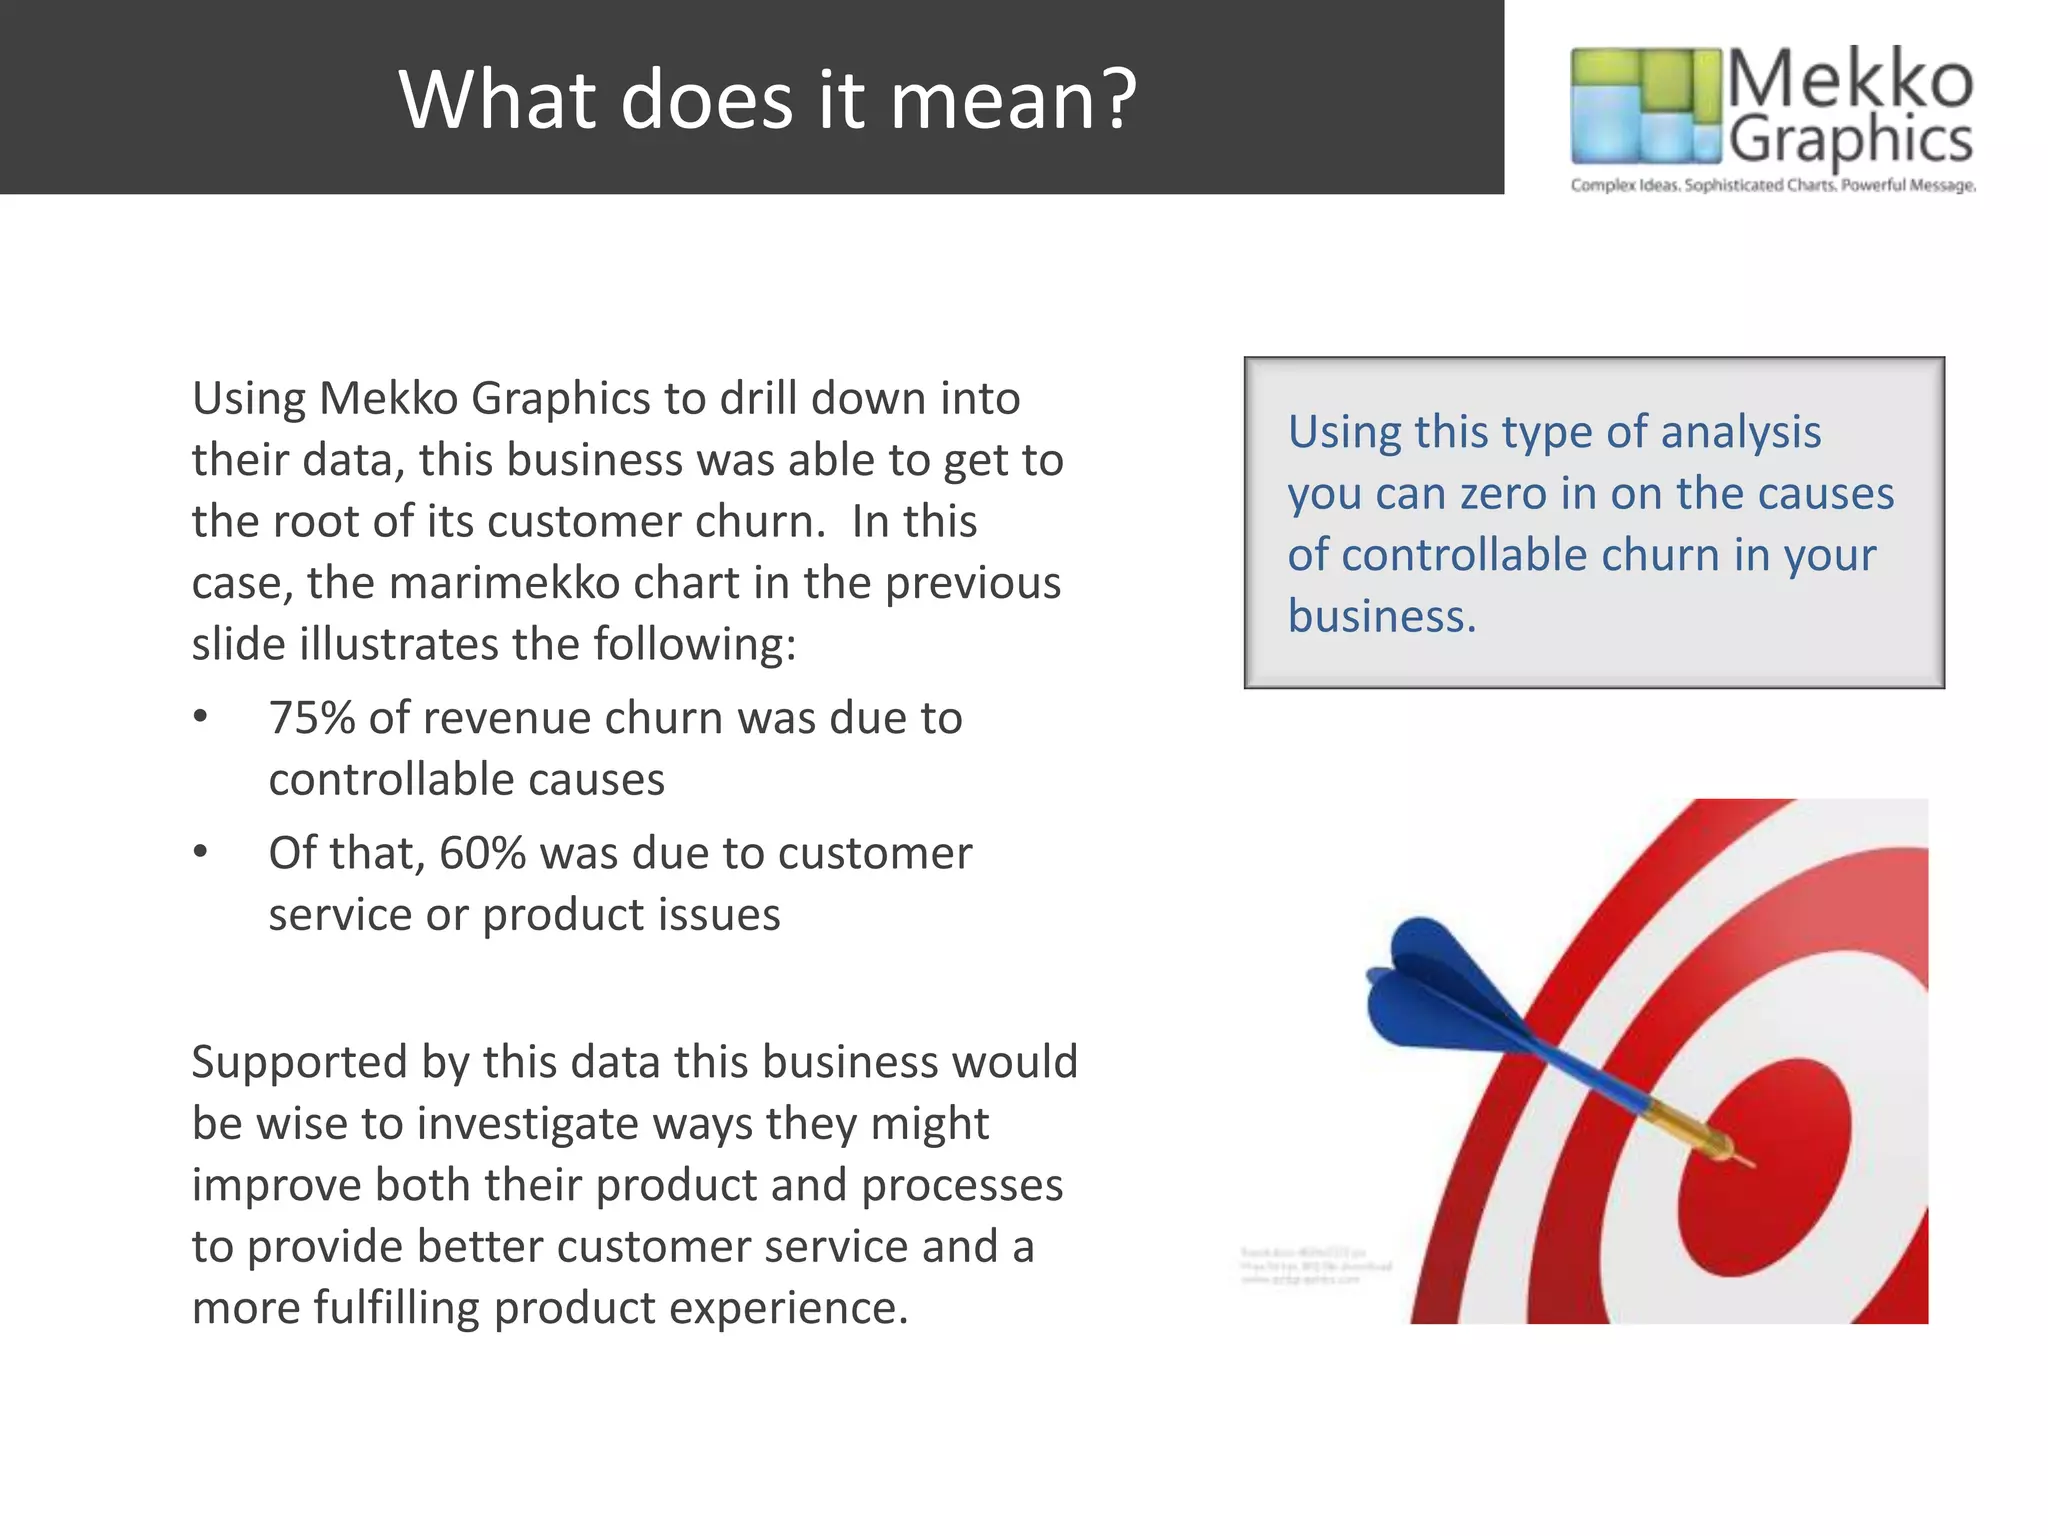
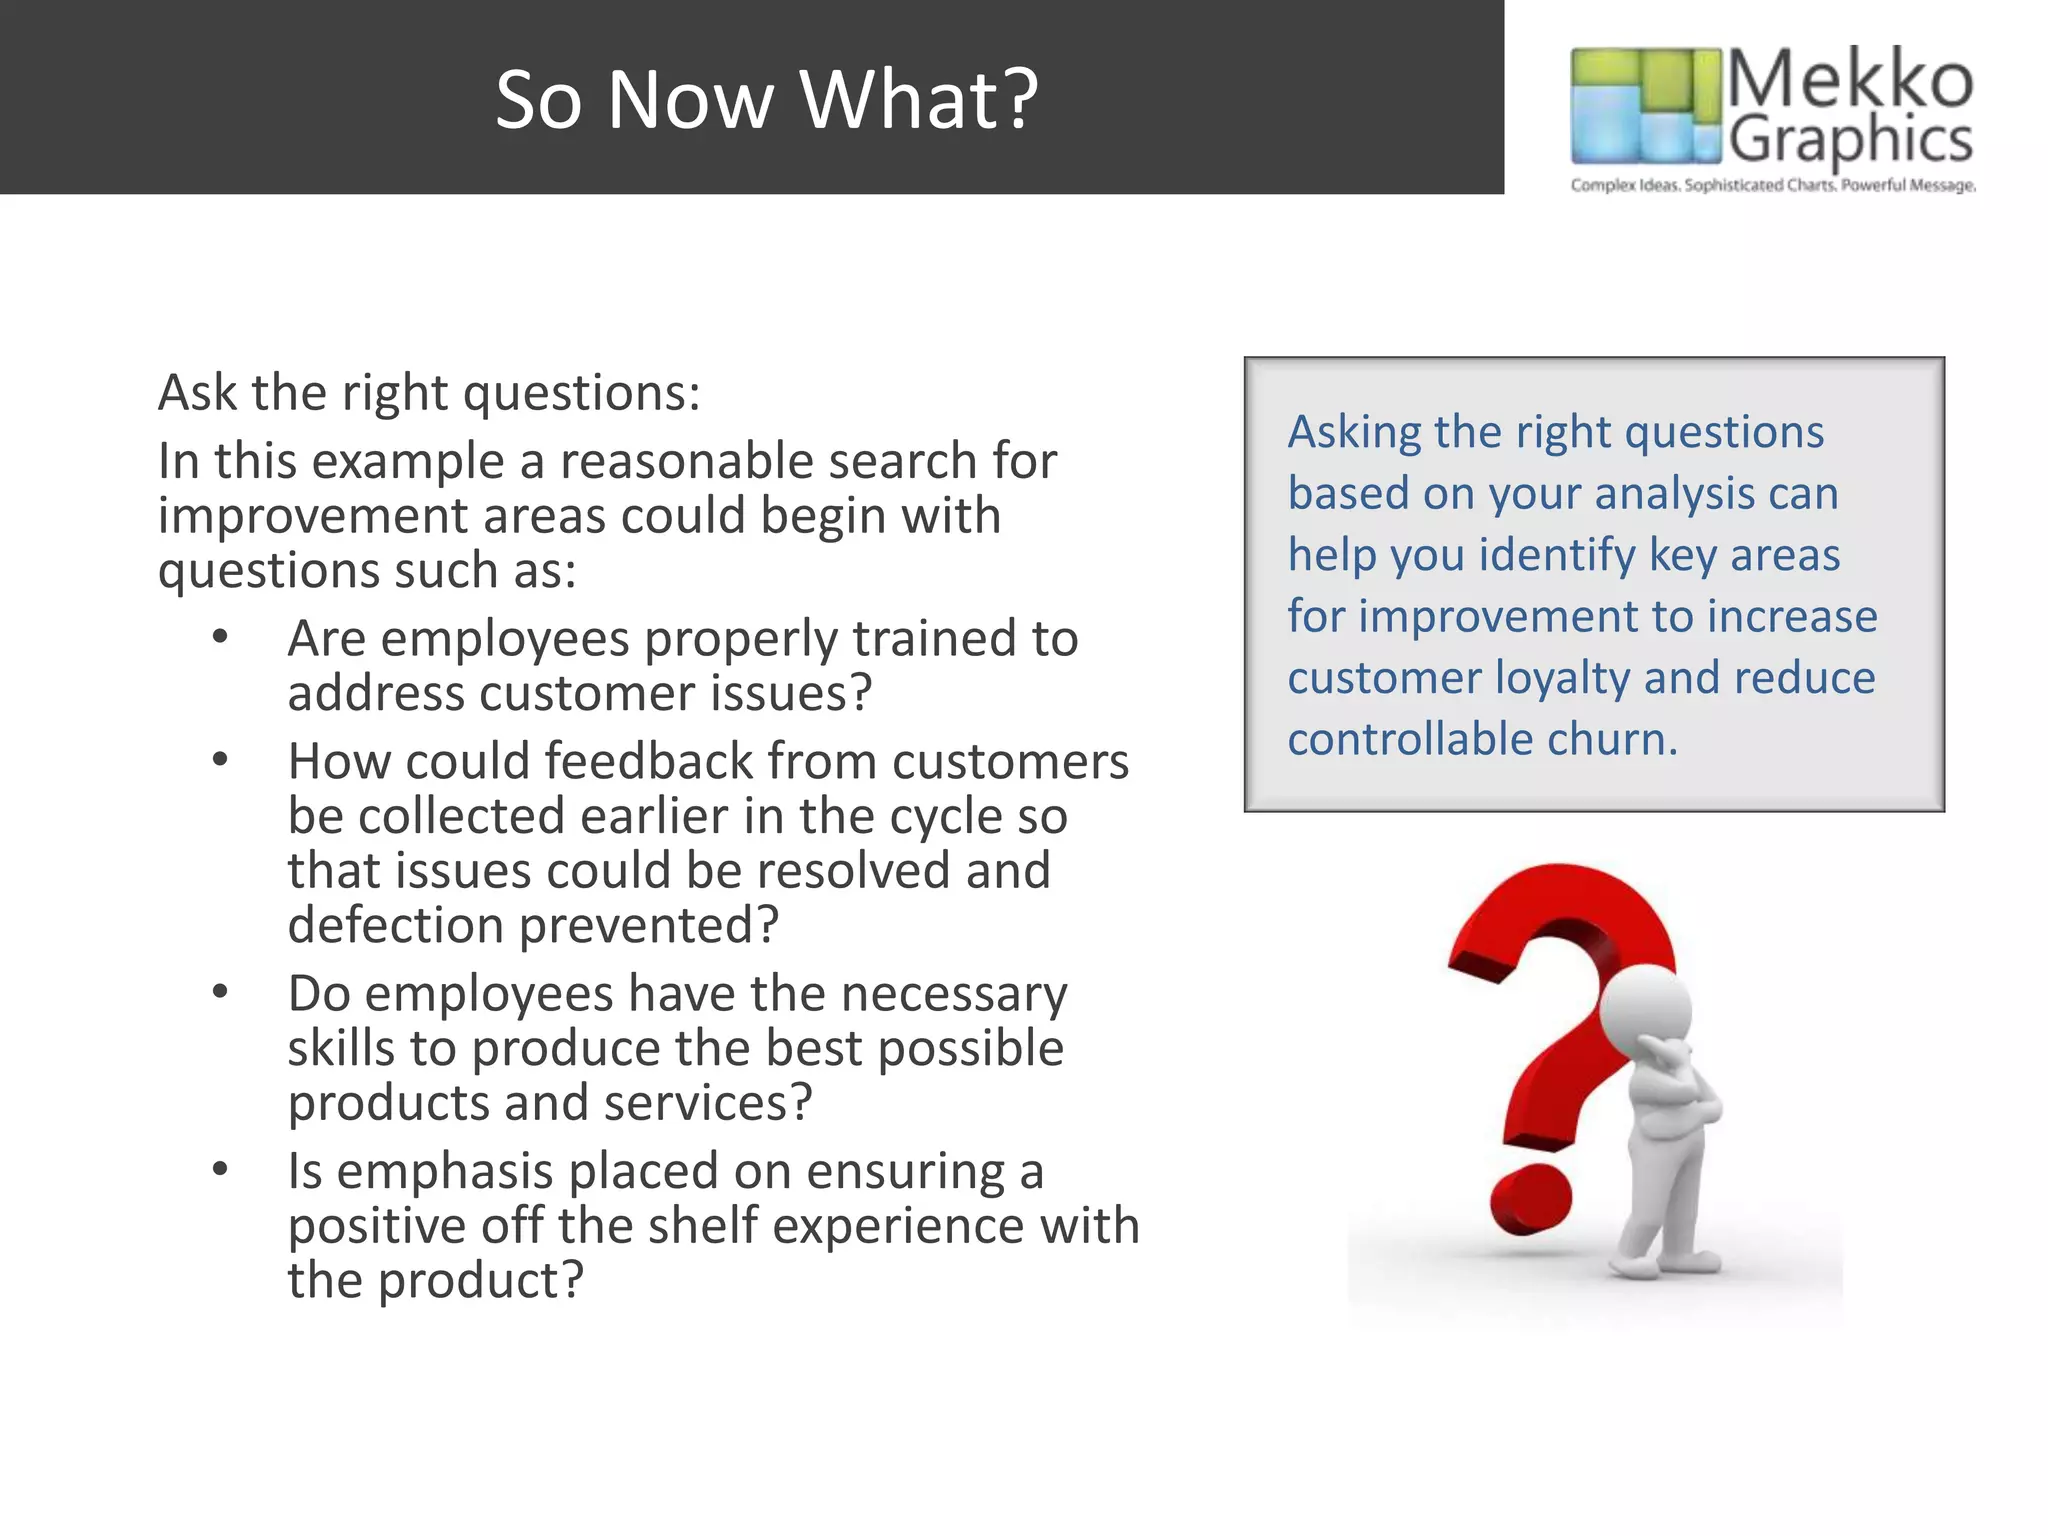

The document discusses the importance of understanding customer churn to improve loyalty and reduce the need for constantly acquiring new customers. It presents an analysis of revenue churn, identifying controllable factors such as customer service issues that lead to customer defection, and suggests using mekko graphics for better visualization. By asking key questions related to employee training and customer feedback, businesses can pinpoint areas for improvement and enhance the customer experience.