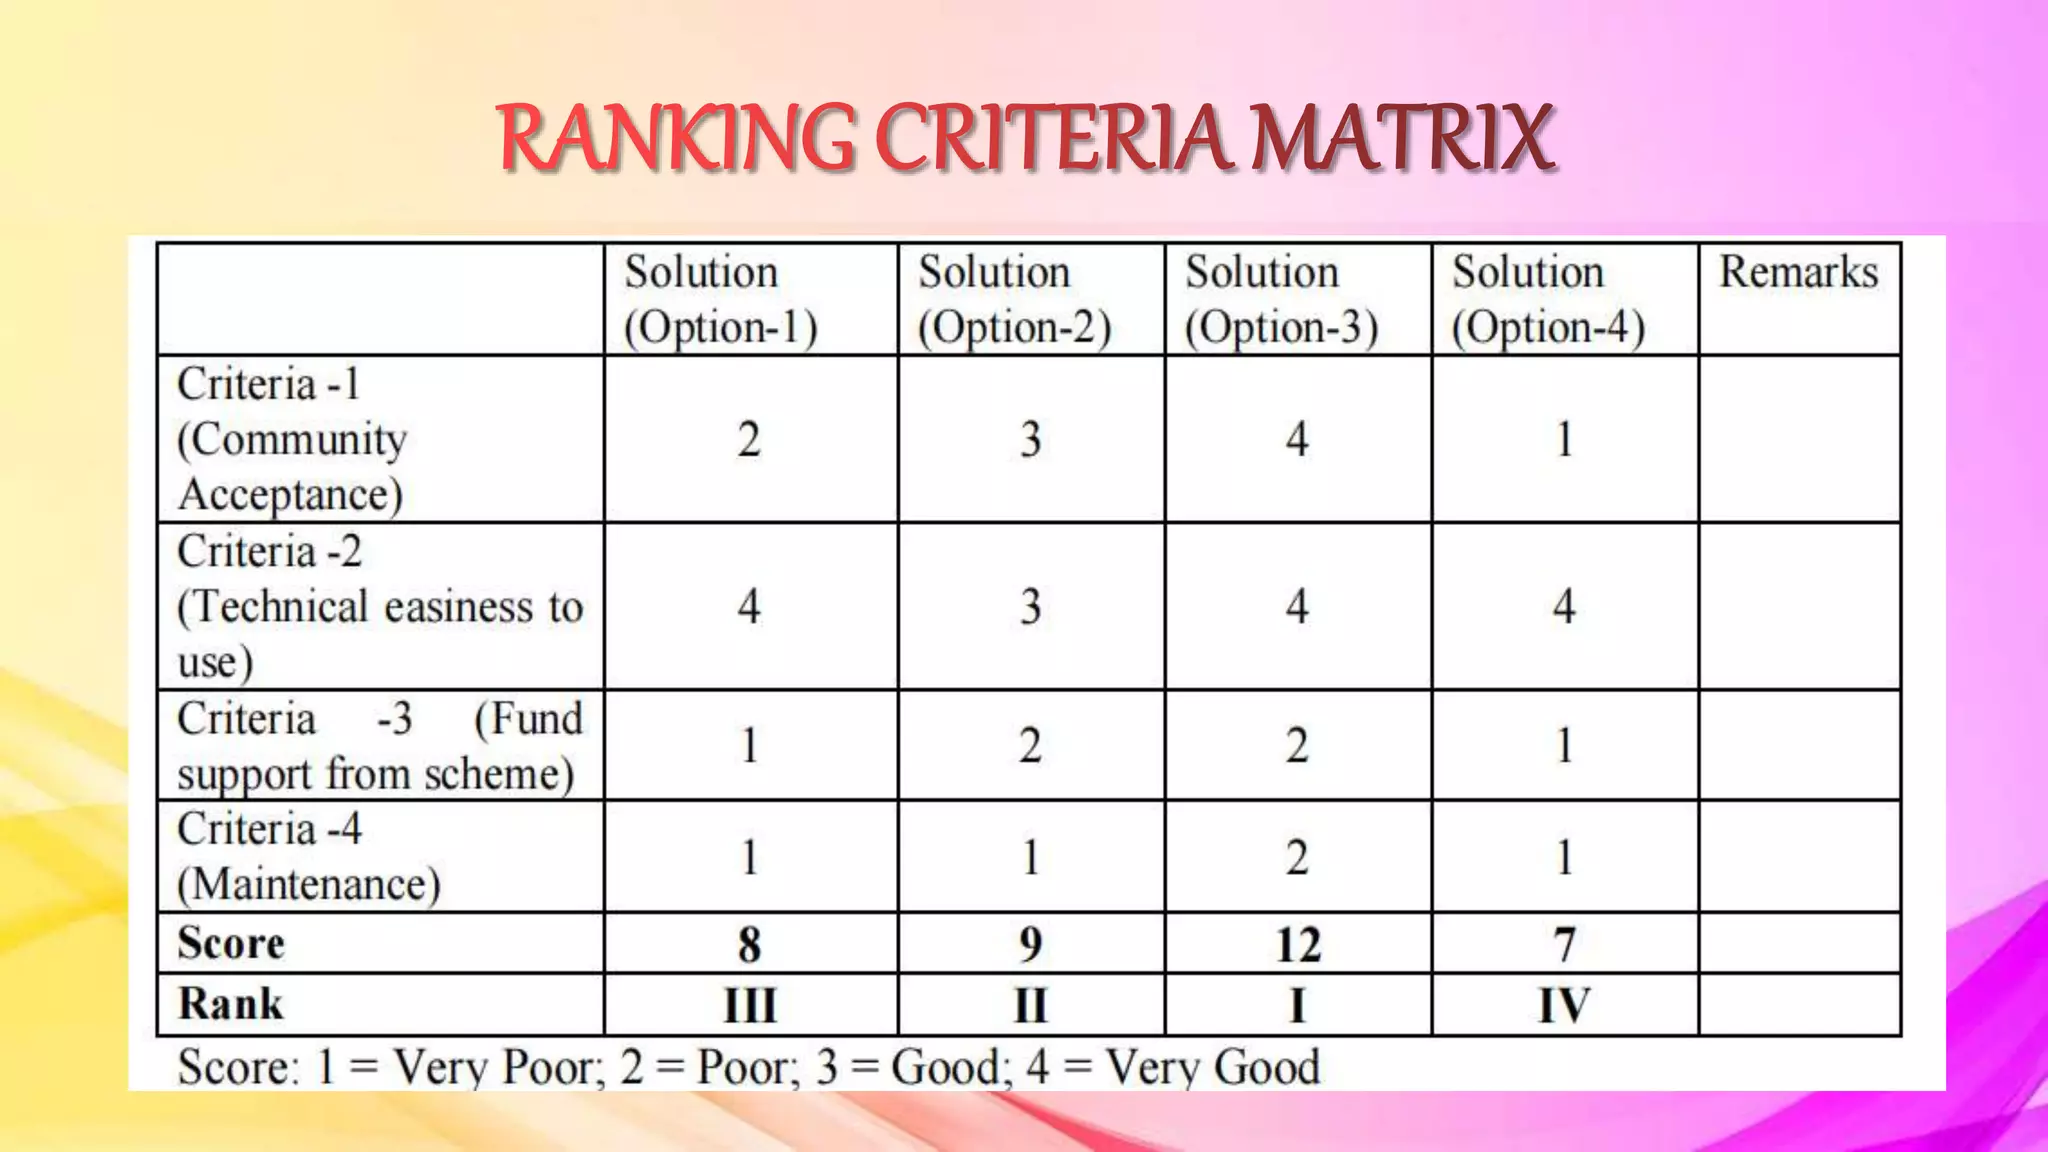
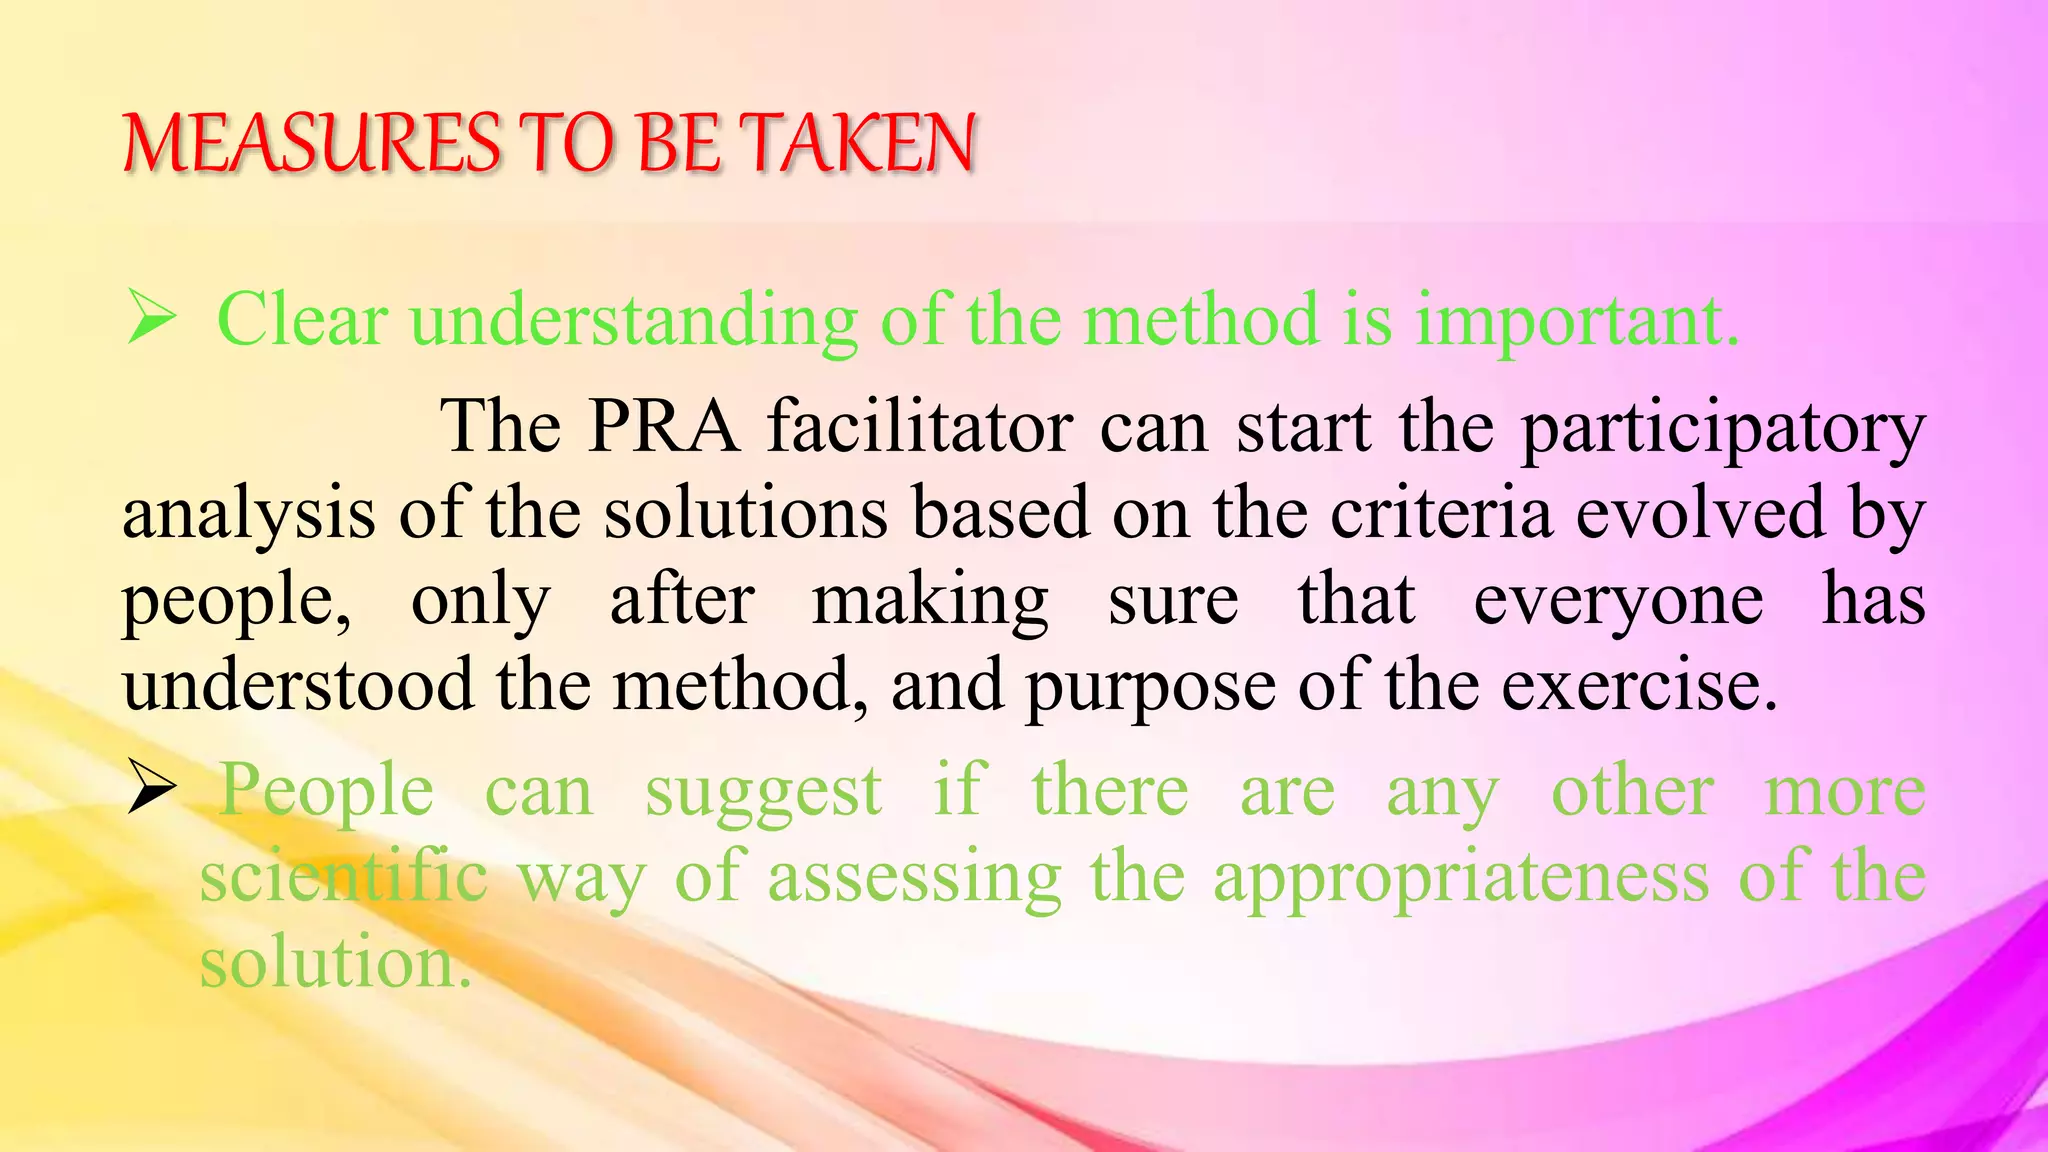
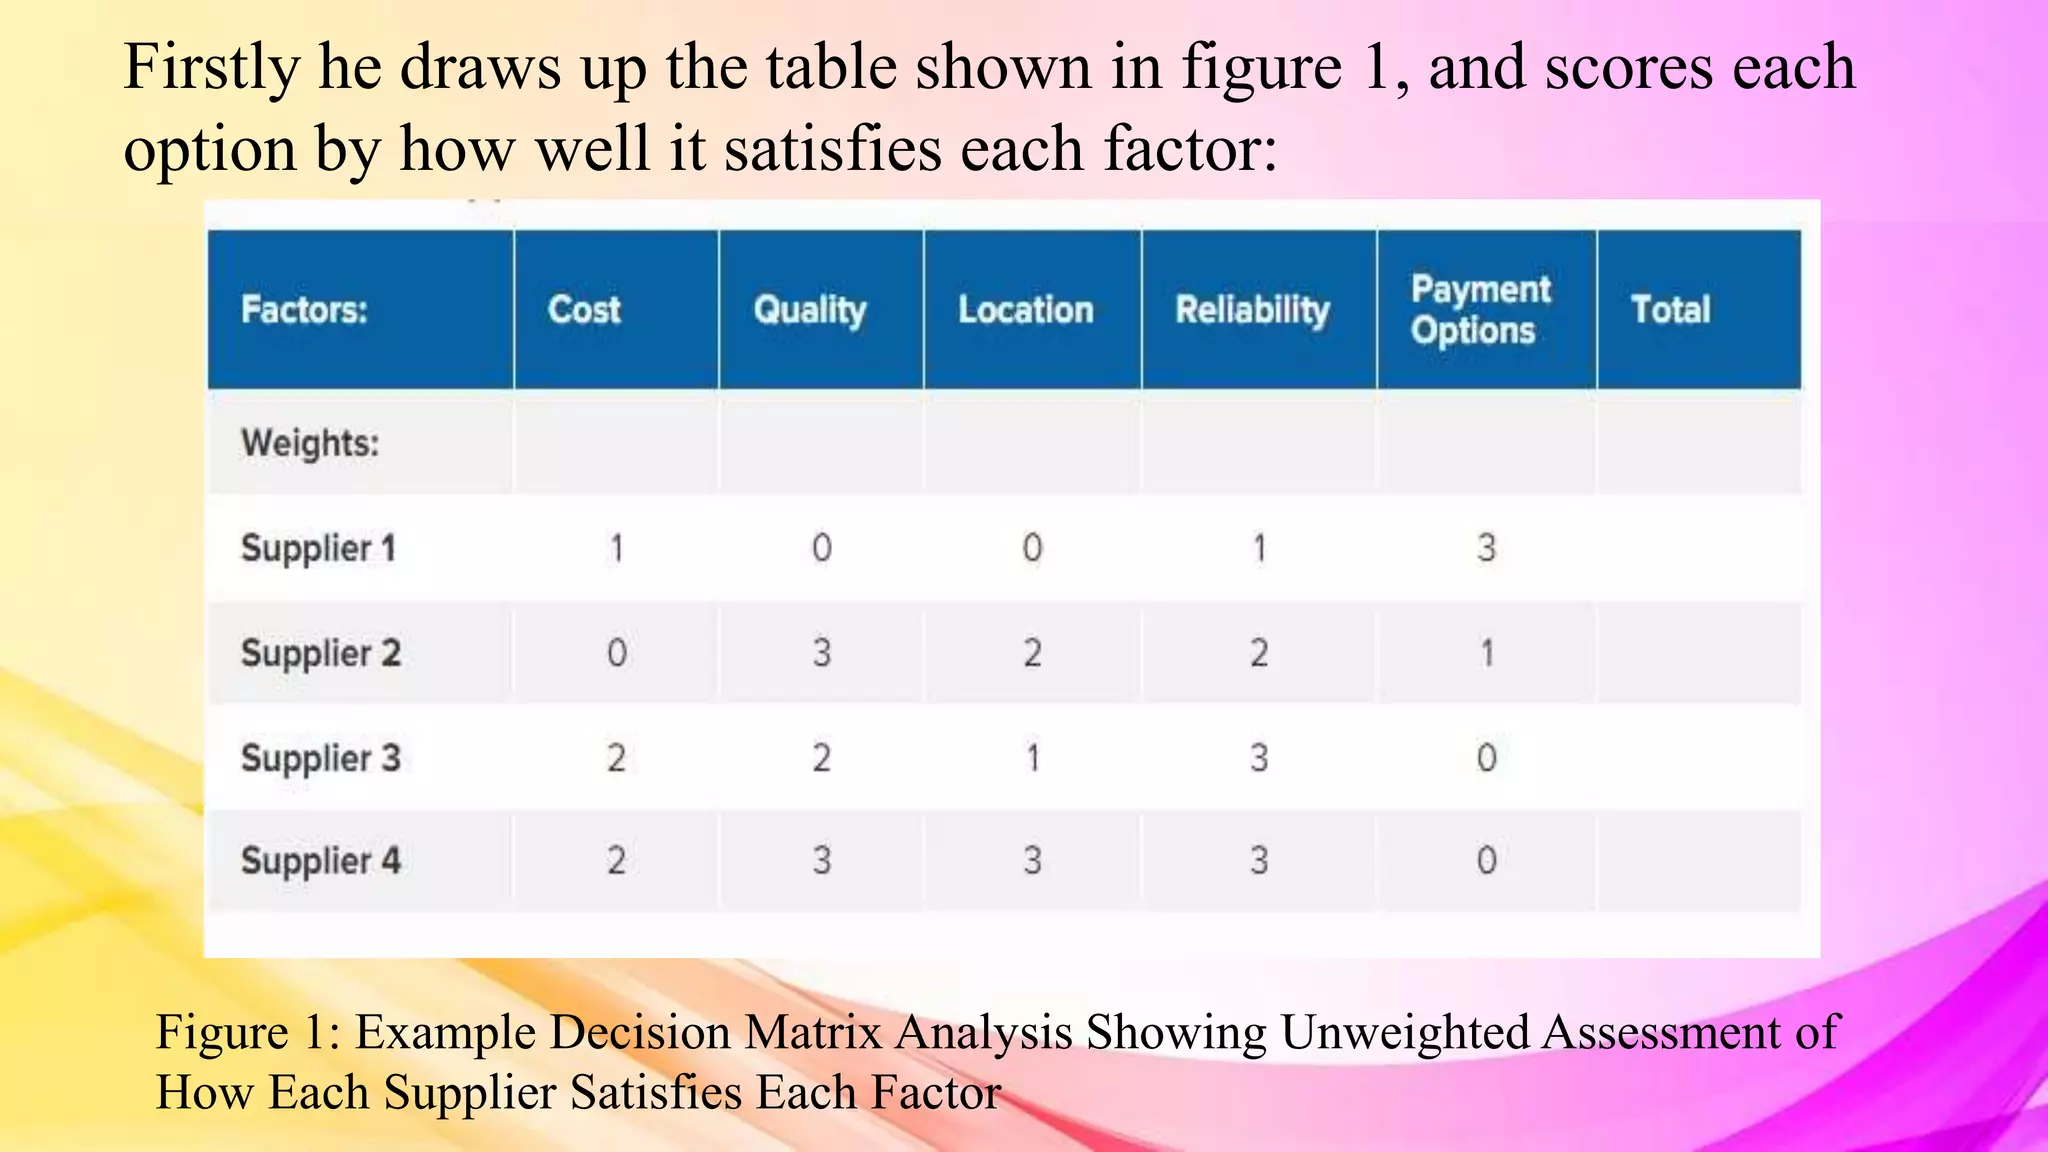
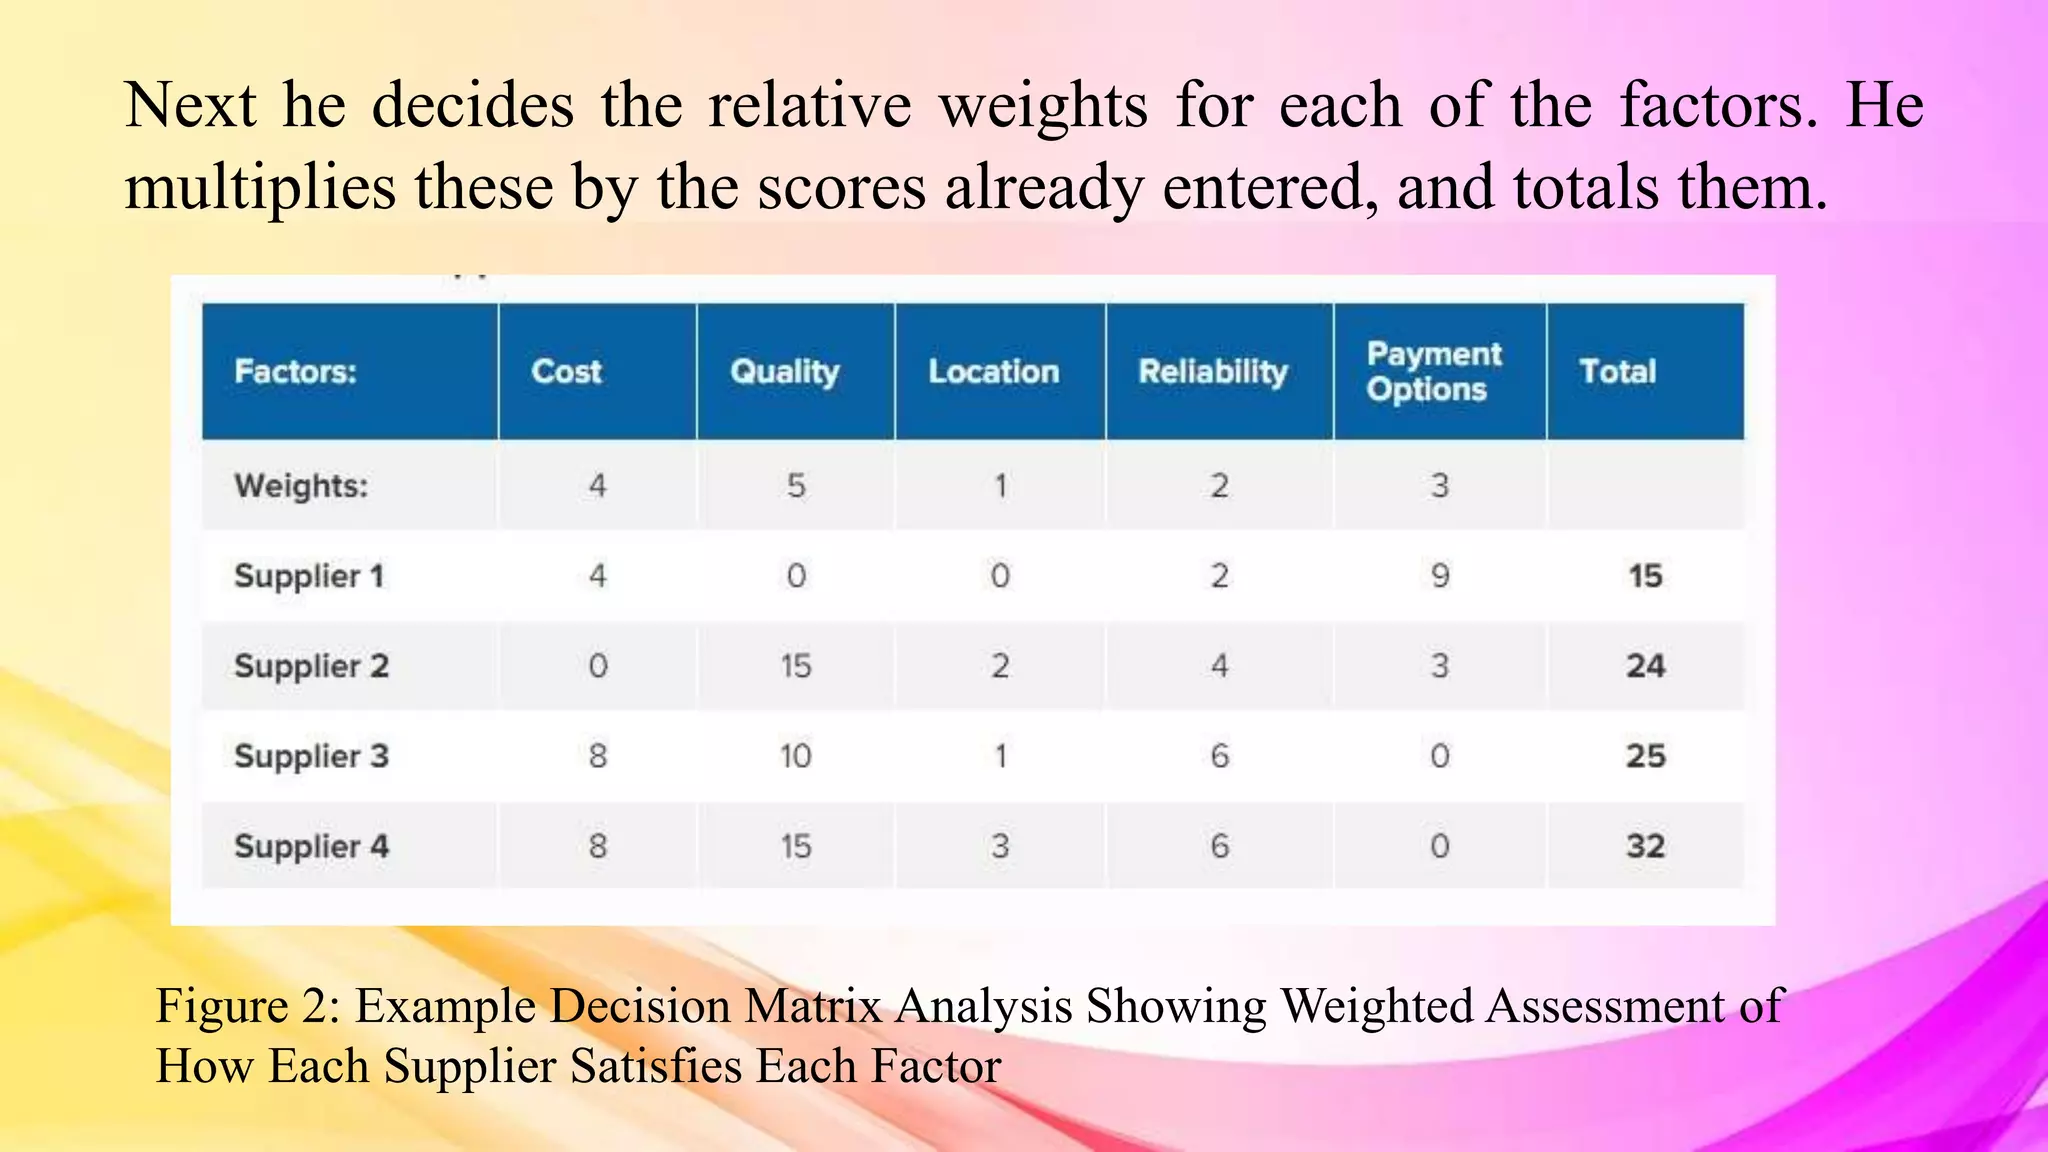
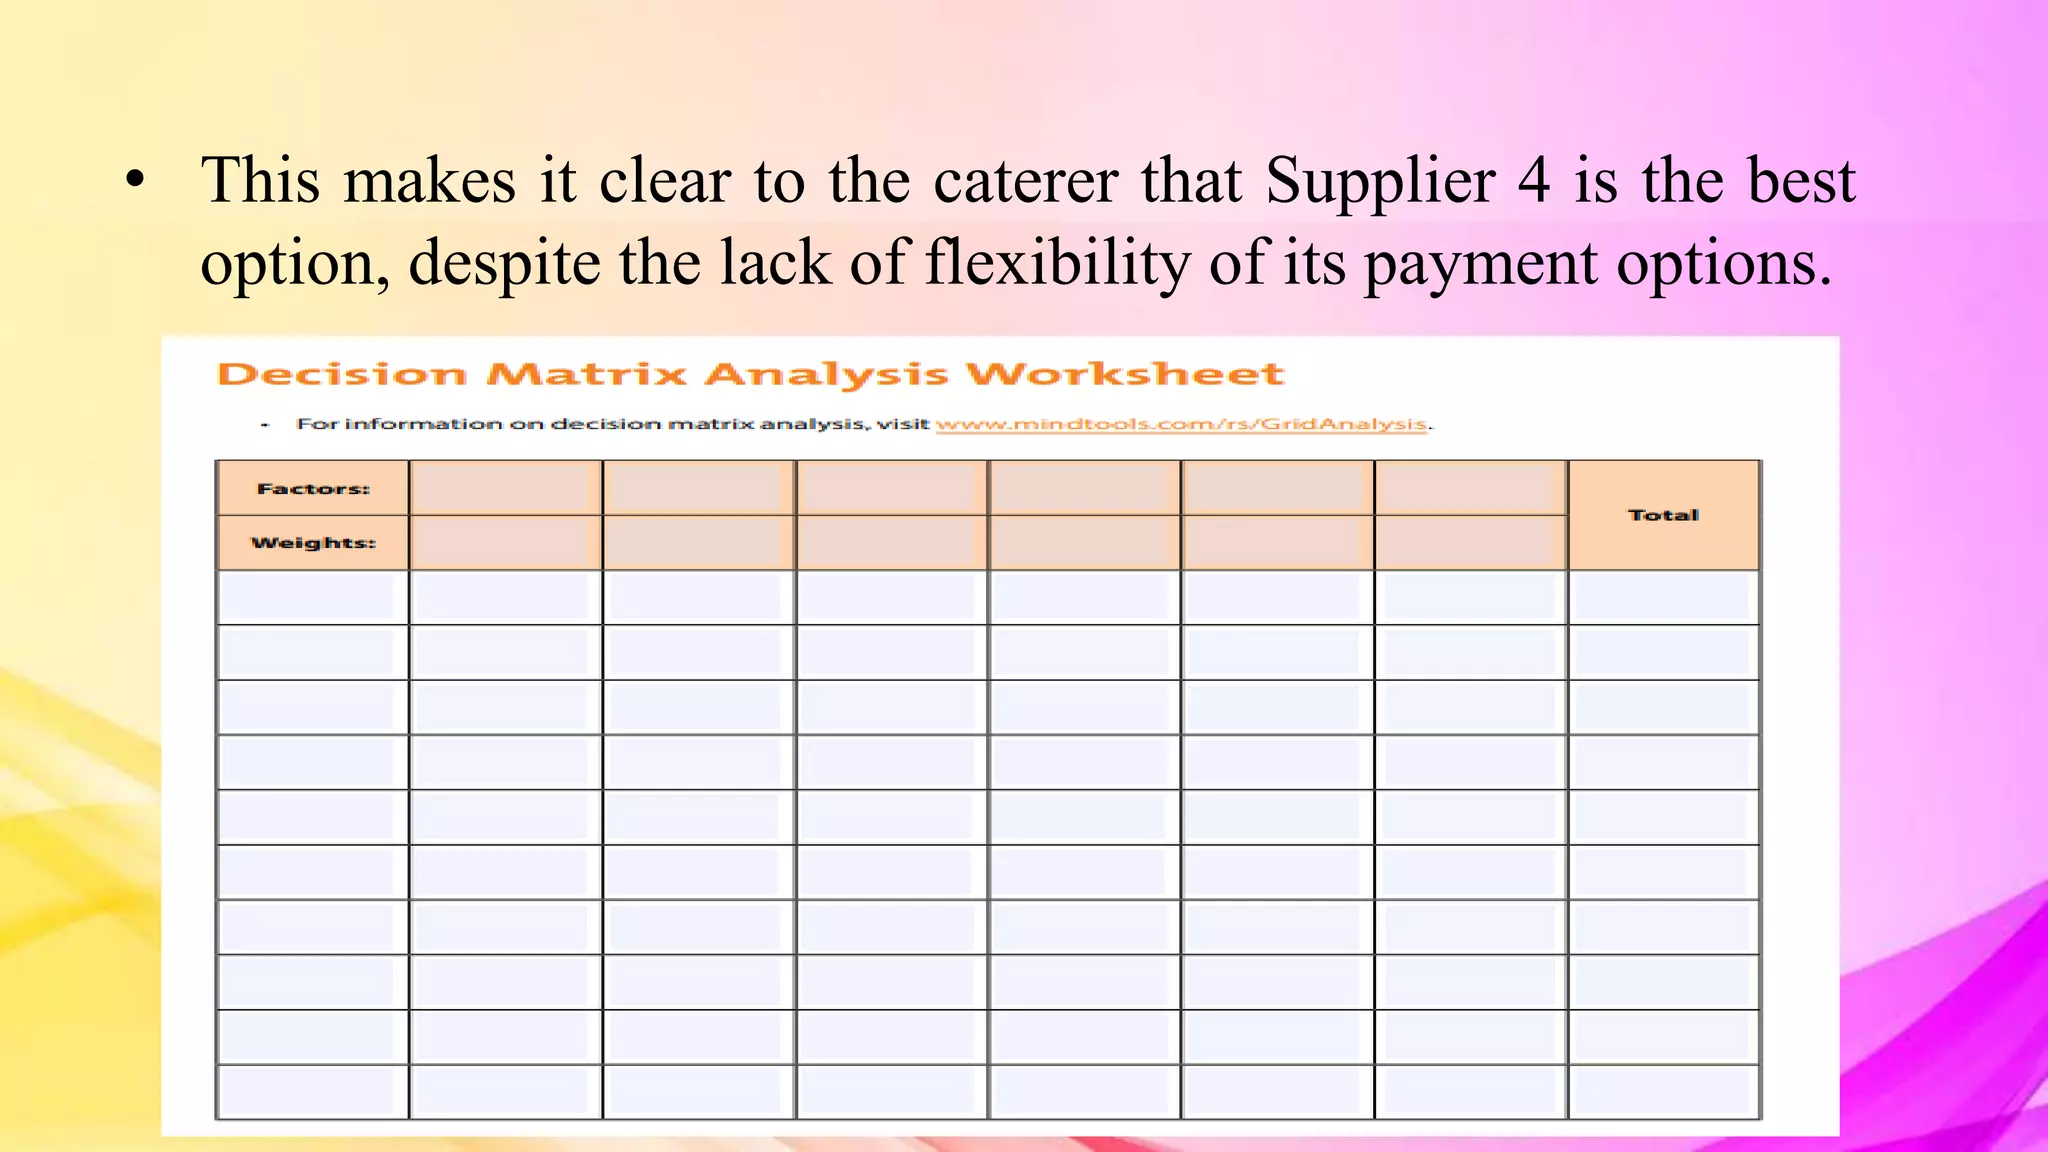
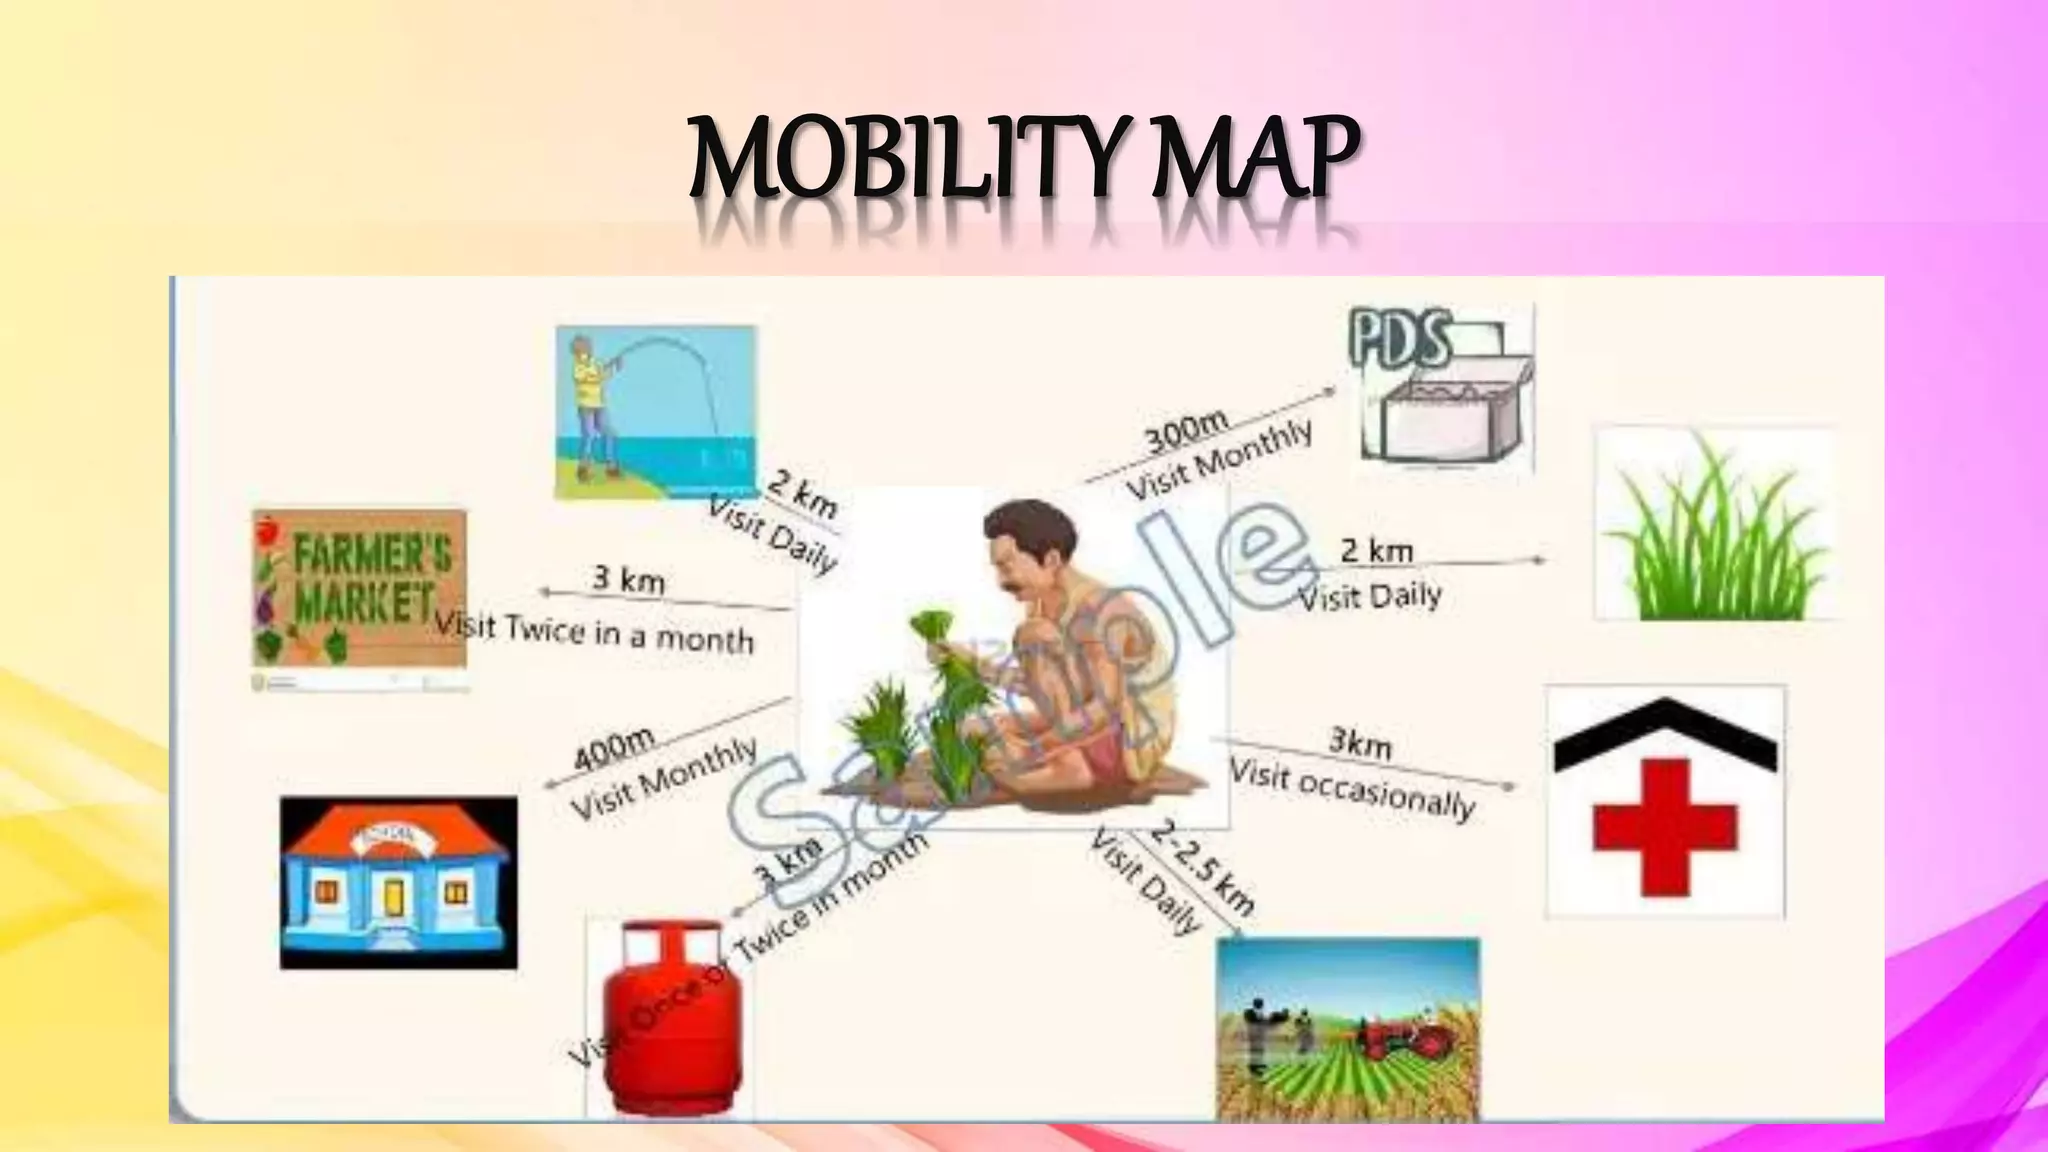
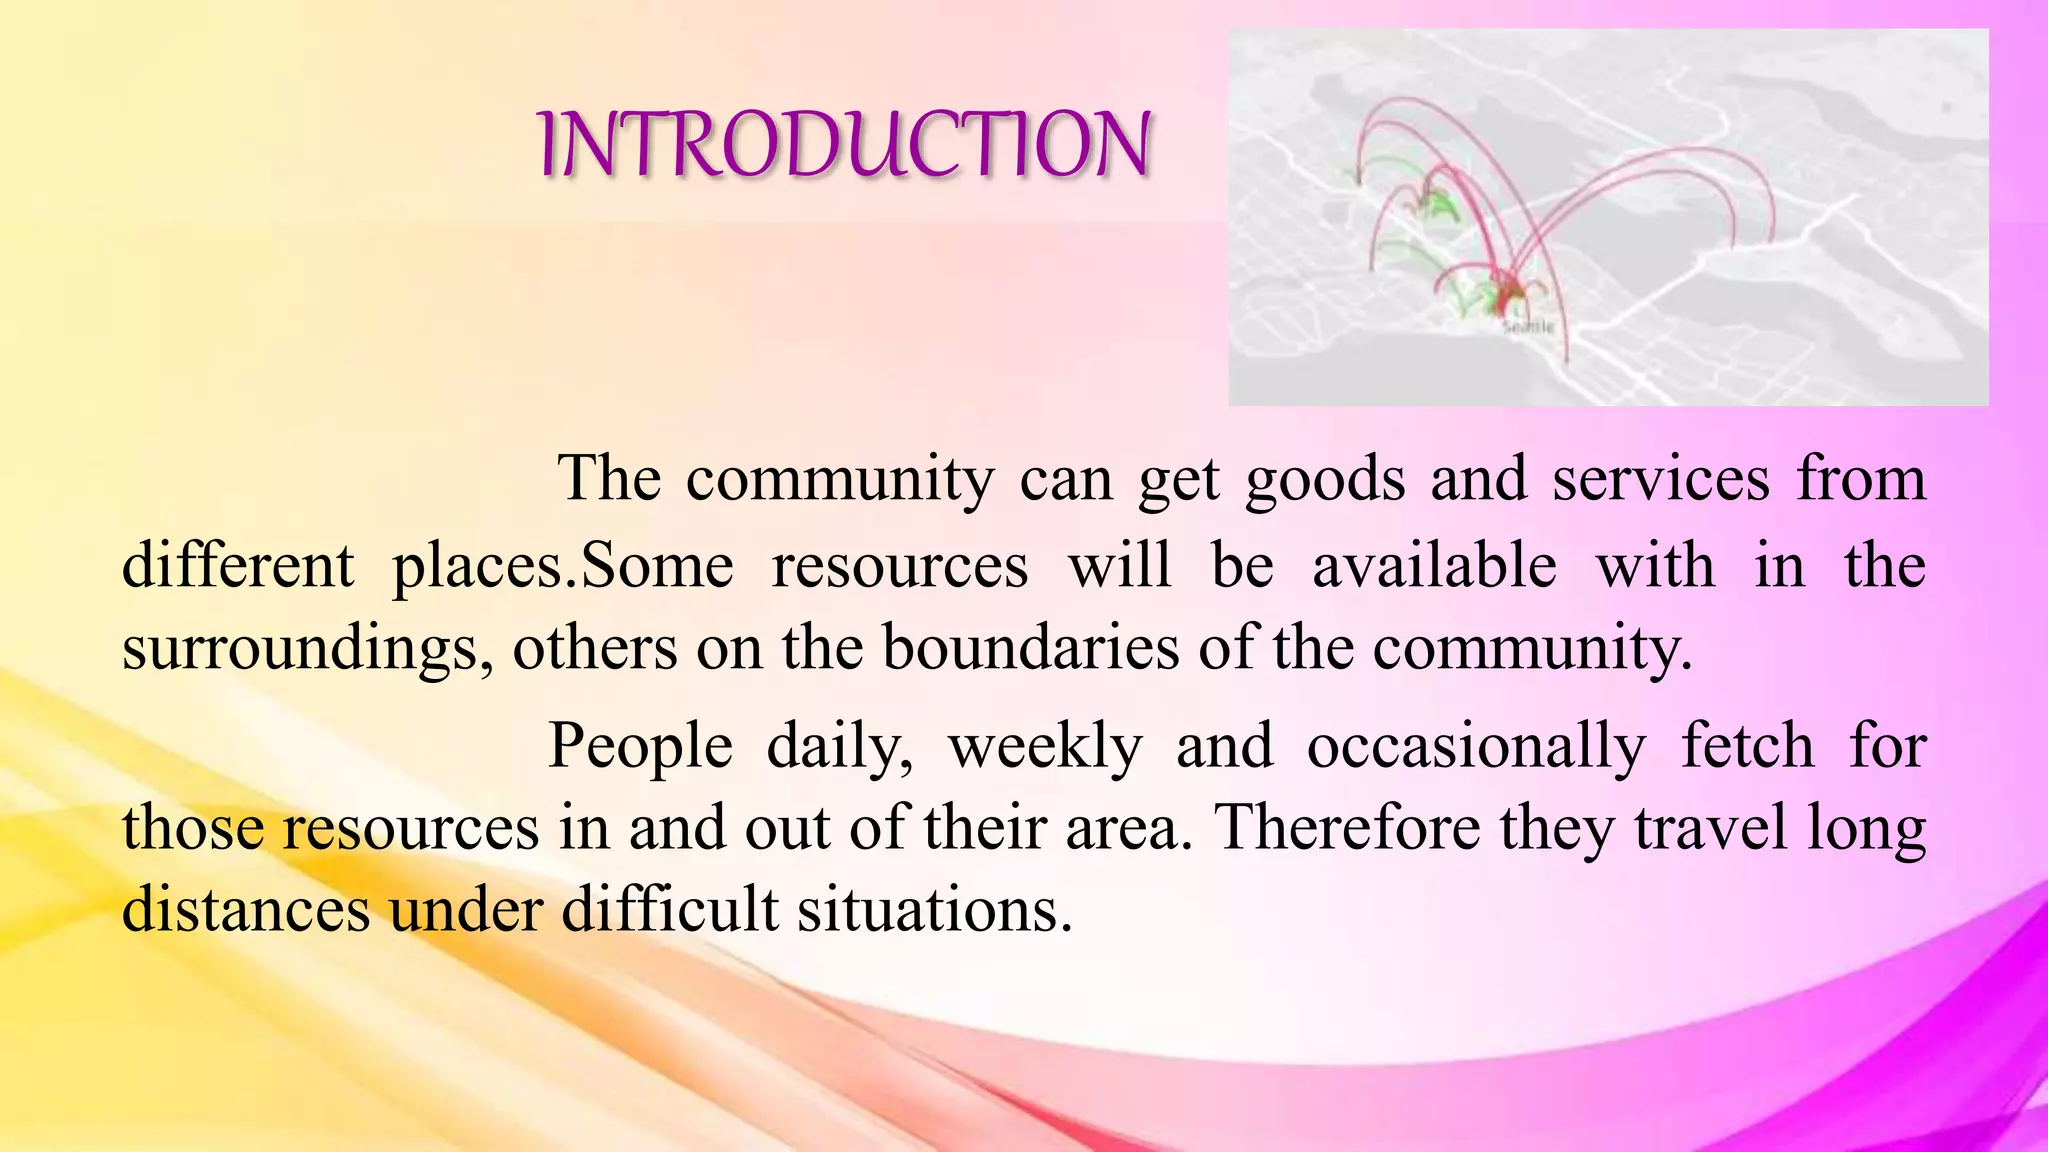
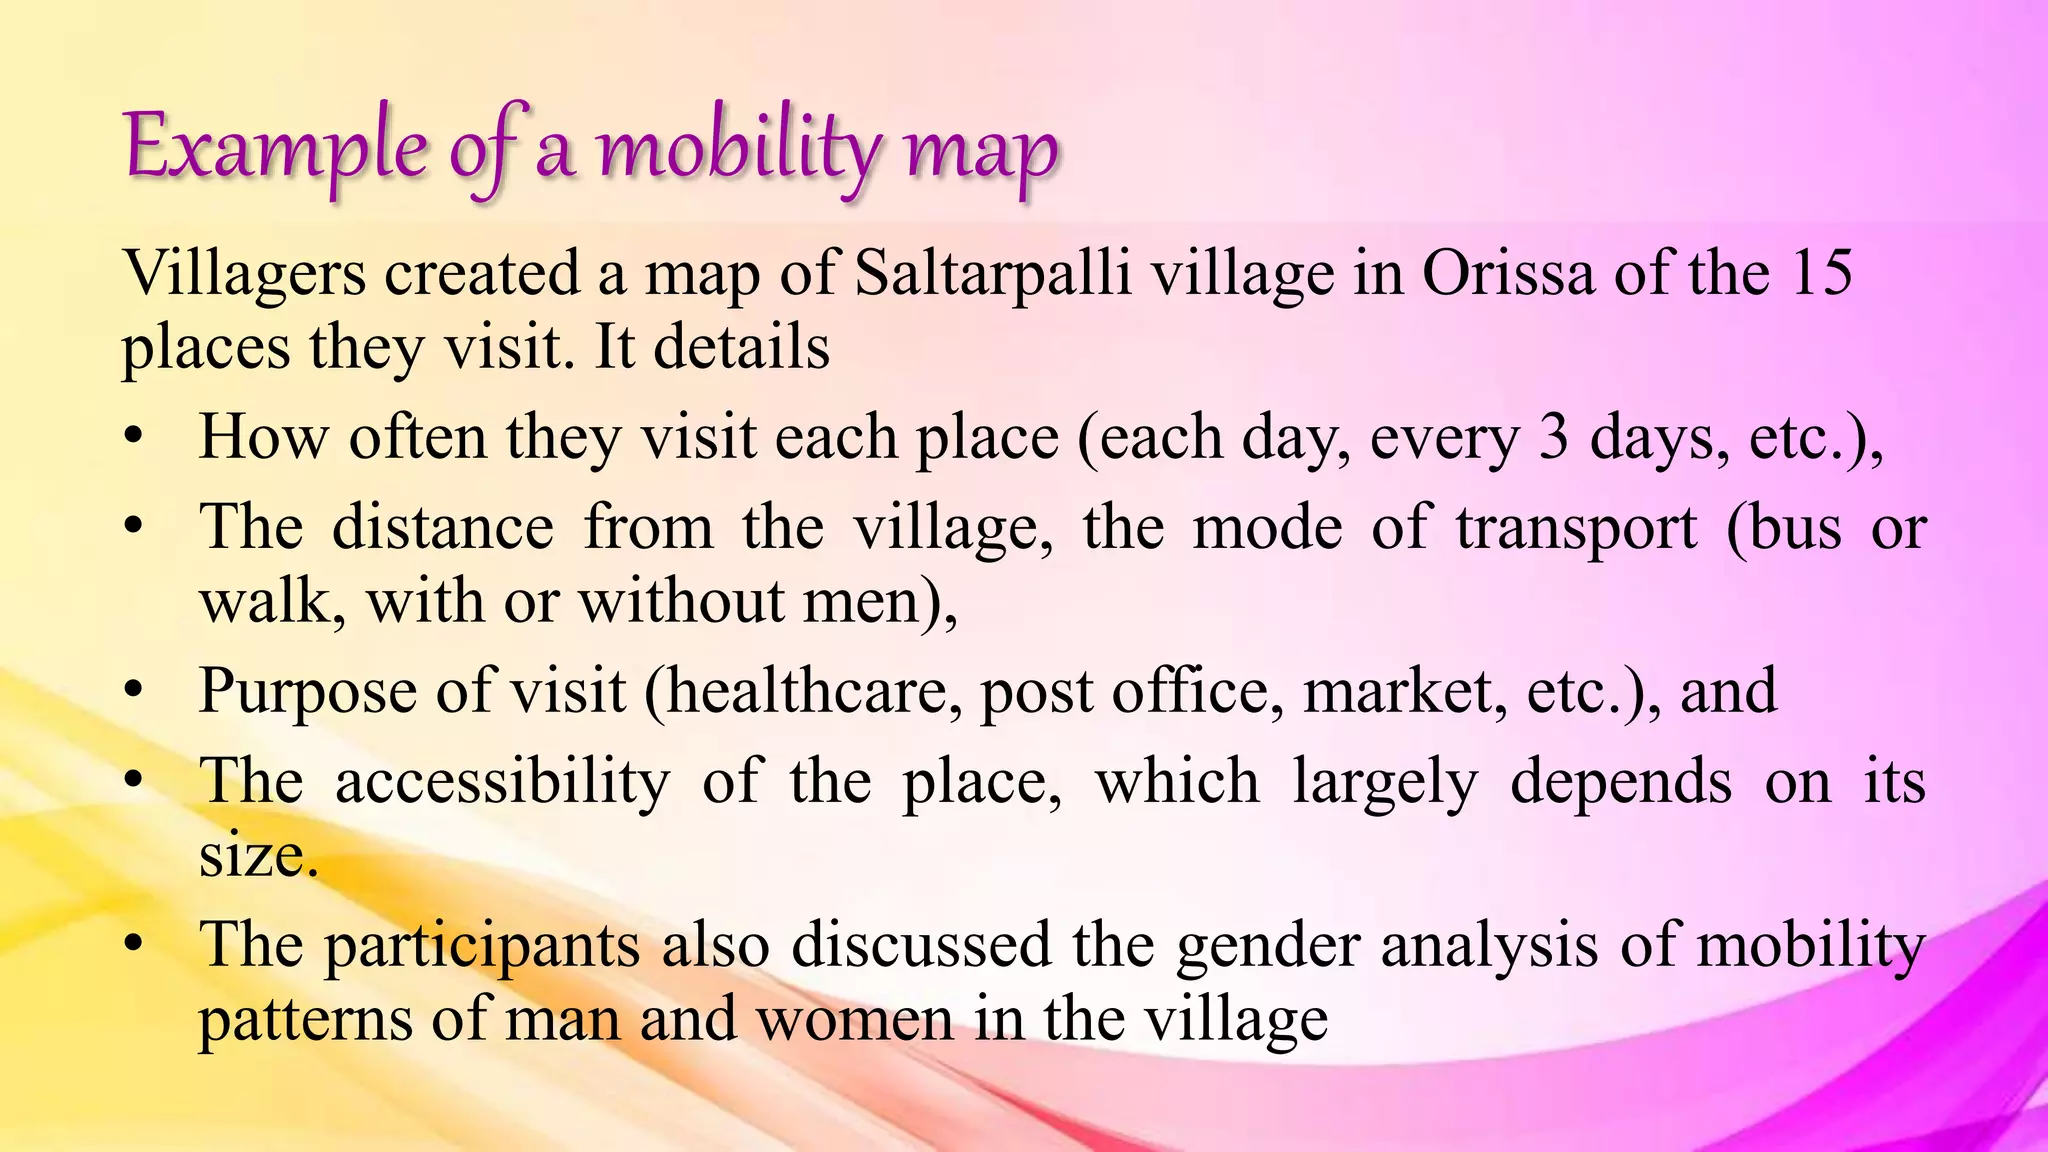
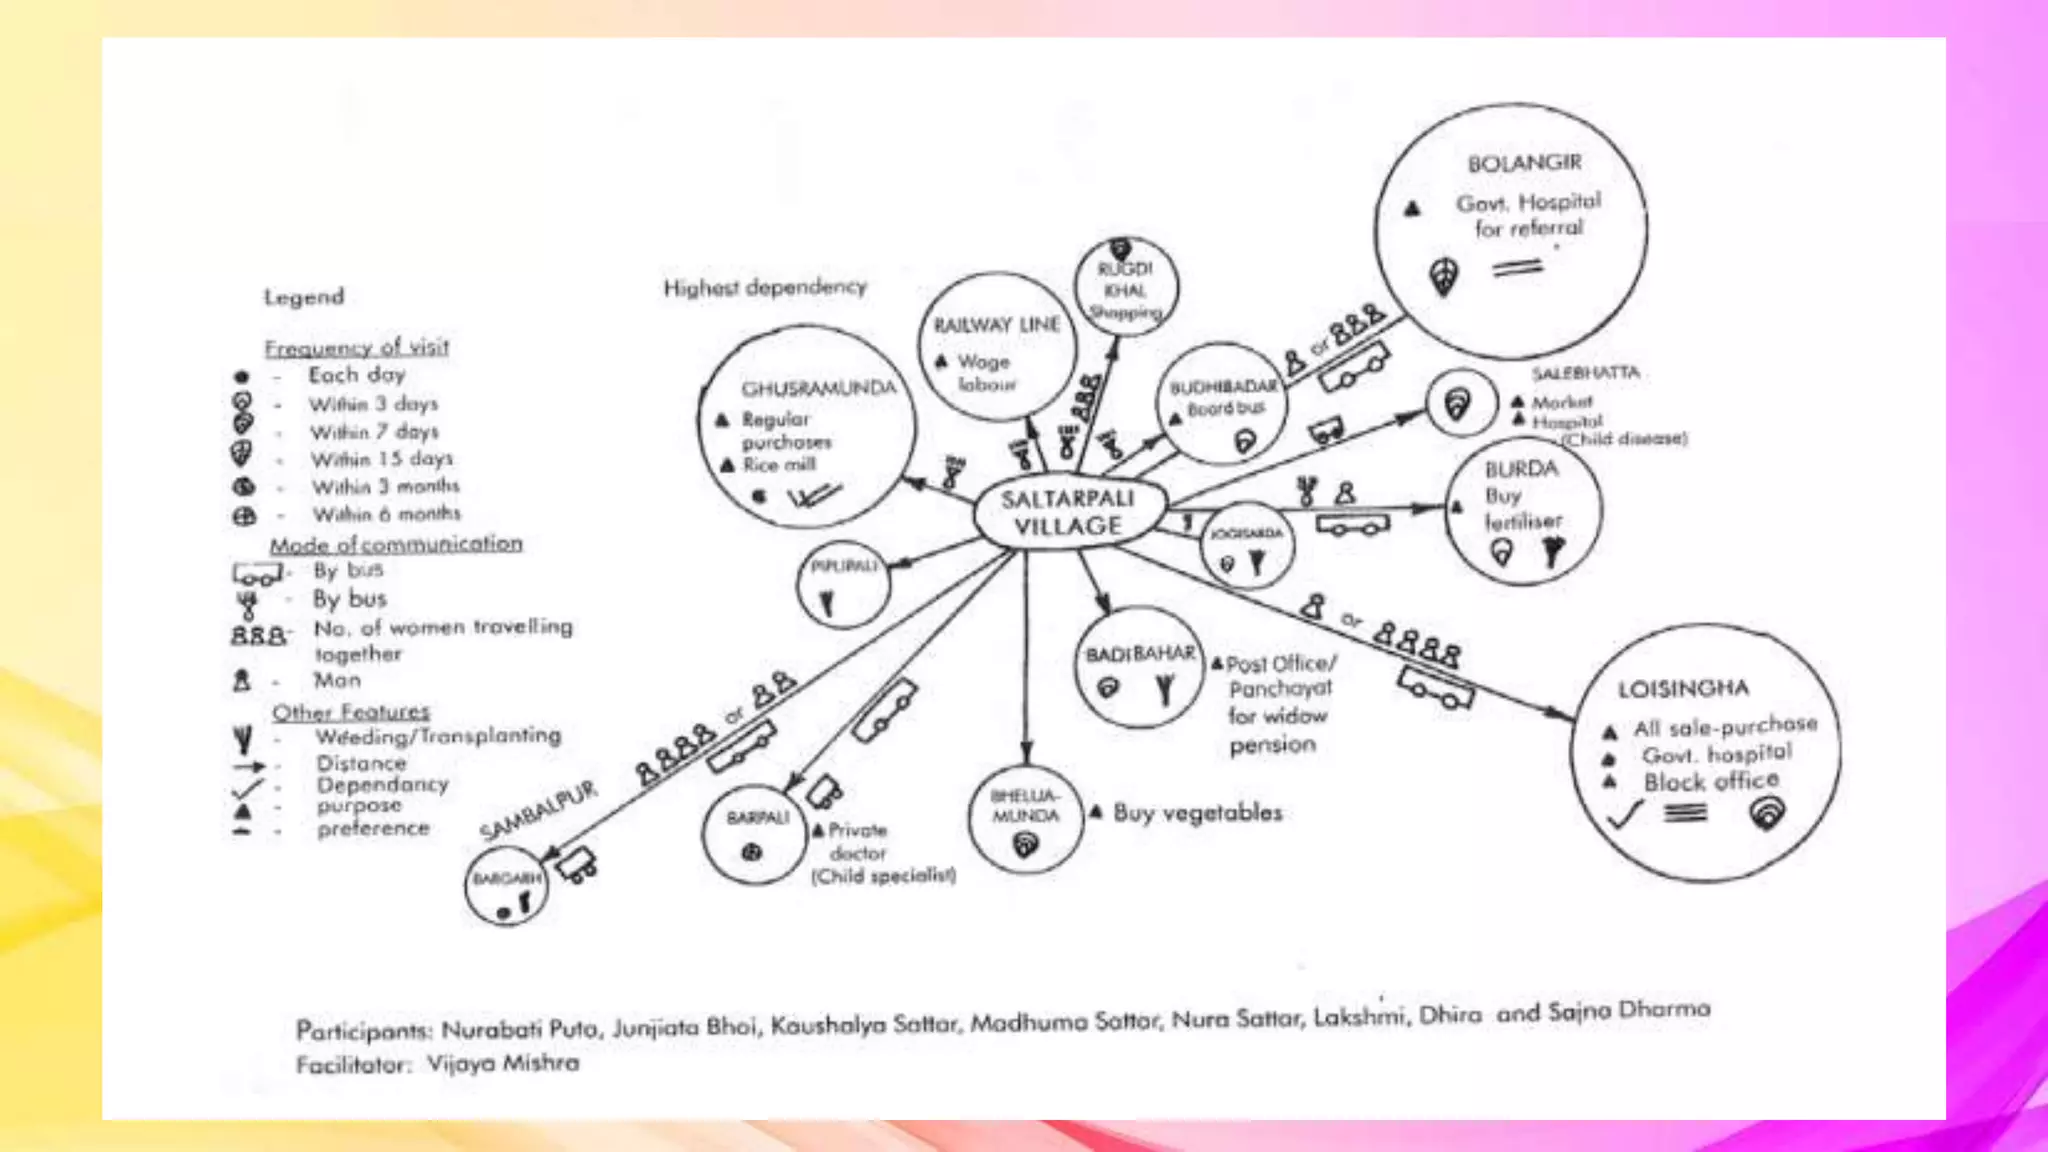
COLLEGE OF AGRICULTURE , RAICHUR .
DEPARTMENT OF AGRICULTURAL EXTENSION EDUCATION
PRESENTATION
SOLUTIONASSESSMENTTHROUGHVARIOUS PRA TECHNIQUES
PRESENTED BY
C. VAISHNAVI
M.Sc(Agri.)
PG20AGR12028
SOLUTION ASSESSMENT
 Solution assessment and
validation is the process of ensuring
that the solution built will match the
requirements of problem solving.
 It may be performed on a
single solution or be used to compare
multiple proposed solutions to
recommend the best course of action
to be proposed
MEANING
SOLUTION in general is a
response or coping mechanism which is
specific to the problem or situation. It is
the outcome of problem solving process.
For obtaining any solution
first the problem is defined clearly and
then should come out with alternative
solutions. Then the finally decided
solution need to be assessed.
Assessment generally means gathering,
interpretation and the use of information to support
the decision making of the solution finalised.
assess Latin
assidere to sit with.
with for
to Green
HOW TO ASSESS THE SOLUTION?
METHOD
• We can go for a Ranking Criteria Matrix
WHAT IS IT
• This is a PRA method, where all the solutions are listed, and
matched again certain acceptable criteria. where the people
come out with their own criteria and own ideas which suits to
their local conditions.
Why is this ?
How is this exercise carried out?
• Ask the people to come with their own soultions and
their own criteria.
• Later the PRA Facilitator (team) can add at the end, if
people agreed to add that criteria to their proposed
list.
• Ask if they want to consider the criteria to be not only
socially acceptable but also technically sound and
financially viable and manageable
PARTICIPANTS:
All those who are concerned with the problem
in question can be invited to participate.
PURPOSE:
Selecting the most suitable solution for the
implementation in order to resolve a pressing problem
identified through “NSL Chart”.
EXPECTED OUTCOME:
The most suitable solution to
the problem in question emerge through
people’s consensus which is based on
their scoring and ranking
MEASURES TO BE TAKEN
 Clear understanding of the method is important.
The PRA facilitator can start the participatory
analysis of the solutions based on the criteria evolved by
people, only after making sure that everyone has
understood the method, and purpose of the exercise.
 People can suggest if there are any other more
scientific way of assessing the appropriateness of the
solution.
 Under this PRA tool, all the problems were discussed
with the farmers for all possible reasons using top down
approach.
 It is a short dendogram analysis of the problem by the
farmers.
 The possible solution for each cause will be discussed
with the farmers.
 These causes and solutions were later discussed with the
subject matter specialist before the finalization of the
tree.
CASE STUDY
Basic information:
Name of the Village : Nongtraw
District : East Khasi Hills
State : Meghalaya
 Problems identified were categorized as problems
arising out of gaps in research in various agricultural
disciplines and as problems arisingout of gaps in
extension activities.
 After getting all the information about resources
available in the village it was realized that some
opportunities lies in the village itself.
 Thus Extension workers and villagers should focus
on such opportunities for betterment of livelihood.
SOLUTIONS IDENTIFIED COLLECTIVELY
1. Eichhornia crassipes as composting materials.
2. Lotus cultivation in pond and swampy area.
3. SRI method of rice cultivation for higher productivity.
4. Diversified vegetable cultivation for enhancing farmer income.
5. IFS for efficient use of on-farm resources and its efficient management.
6. Scientific pisciculture for year round income.
7. Livestock breed up- gradation through Artificial Insemination
8. Cultivation of fodder grass (para grass) to meet feed requirement of cattle.
9. Bio gas production to meet rural energy need (cooking/lighting etc)
Making a Decision by Weighing Up Different Factors
Decision Matrix Analysis is a useful technique to
use for making a decision. It's particularly powerful
where you have a number of good alternatives to
choose from, and many different factors to take into
account.
This makes it a great technique to use in almost
any important decision where there isn't a clear and
obvious preferred option.
How to Use the Tool
Decision Matrix Analysis works by getting
you to list your options as rows on a table, and the
factors you need consider as columns. You then score
each option/factor combination, weight this score by the
relative importance of the factor, and add these scores
up to give an overall score for each option.
1. List all of your options as the row labels on the table, and list the factors
that you need to consider as the column headings.
2. Next, work your way down the columns of your table, scoring each option
for each of the factors in your decision. Score each option from 0 (poor) to 5
(very good). Note that you do not have to have a different score for each
option – if none of them are good for a particular factor in your decision,
then all options should score 0.
3. The next step is to work out the relative importance of the factors in your decision.
Show these as numbers from, say, 0 to 5, where 0 means that the factor is absolutely
unimportant in the final decision, and 5 means that it is very important. (It's perfectly
acceptable to have factors with the same importance.
4. Now multiply each of your scores from step 2 by the values for relative
importance of the factor that you calculated in step 3. This will give you
weighted scores for each option/factor combination.
5. Finally, add up these weighted scores for each of your options. The option
that scores the highest wins!
Example
 A caterer needs to find a new supplier for his basic ingredients.
He has four different options.
 Factors that he wants to consider are:
Cost.
Quality.
Location.
Reliability.
Payment options.
Firstly he draws up the table shown in figure 1, and scores each
option by how well it satisfies each factor:
Figure 1: Example Decision Matrix Analysis Showing Unweighted Assessment of
How Each Supplier Satisfies Each Factor
Next he decides the relative weights for each of the factors. He
multiplies these by the scores already entered, and totals them.
Figure 2: Example Decision Matrix Analysis Showing Weighted Assessment of
How Each Supplier Satisfies Each Factor
• This makes it clear to the caterer that Supplier 4 is the best
option, despite the lack of flexibility of its payment options.
MOBILITY MAP
INTRODUCTION
The community can get goods and services from
different places.Some resources will be available with in the
surroundings, others on the boundaries of the community.
People daily, weekly and occasionally fetch for
those resources in and out of their area. Therefore they travel long
distances under difficult situations.
PURPOSE
• The diagram is used to understand the places traveled,
resources collected and to identify the persons travelling. The
resource centers could have problems and the road and means
of transportation may not be appropriate.
• PRA team needs to know the critical goods and services that
people travel to fetch for.
WHO & HOW?
The PRA team identifies individuals or groups who
travel to other places on a purpose. Discussion with men and
women travelers can give a clue about resource scarcity.
 Select informants who travel for resources
 Write down as many places as possible visited and resources
the most wanted.
 The difficulties faced on the way and at the destination are
discussed
 The informants mark on the ground the starting point and
destination for different resources or services.
APPLICATION
The PRA team and informant record resources in short
supply and the reasons for not having in the community and
prepares the action plan.
The community action plans include
 ways and means to get critical resources in the future.
 The difficulties faced on the road and at the resource center
(destination) taken due consideration for improvement.
UTILITY
• Understand the mobility pattern of local people: where do
they go and for what?
• Increase gender sensitivity and awareness through highlighting
the differences in the mobility patterns of men and women
• Evaluate the impact of certain interventions by noting their
effects on mobility patterns
• Plan for intervention and projects
Example of a mobility map
Villagers created a map of Saltarpalli village in Orissa of the 15
places they visit. It details
• How often they visit each place (each day, every 3 days, etc.),
• The distance from the village, the mode of transport (bus or
walk, with or without men),
• Purpose of visit (healthcare, post office, market, etc.), and
• The accessibility of the place, which largely depends on its
size.
• The participants also discussed the gender analysis of mobility
patterns of man and women in the village
Solution assessment and mobility map

Solution assessment and mobility map

  • 1.
    COLLEGE OF AGRICULTURE, RAICHUR . DEPARTMENT OF AGRICULTURAL EXTENSION EDUCATION PRESENTATION SOLUTIONASSESSMENTTHROUGHVARIOUS PRA TECHNIQUES PRESENTED BY C. VAISHNAVI M.Sc(Agri.) PG20AGR12028
  • 2.
    SOLUTION ASSESSMENT  Solutionassessment and validation is the process of ensuring that the solution built will match the requirements of problem solving.  It may be performed on a single solution or be used to compare multiple proposed solutions to recommend the best course of action to be proposed
  • 3.
    MEANING SOLUTION in generalis a response or coping mechanism which is specific to the problem or situation. It is the outcome of problem solving process. For obtaining any solution first the problem is defined clearly and then should come out with alternative solutions. Then the finally decided solution need to be assessed.
  • 4.
    Assessment generally meansgathering, interpretation and the use of information to support the decision making of the solution finalised.
  • 5.
    assess Latin assidere tosit with. with for to Green
  • 6.
    HOW TO ASSESSTHE SOLUTION? METHOD • We can go for a Ranking Criteria Matrix WHAT IS IT • This is a PRA method, where all the solutions are listed, and matched again certain acceptable criteria. where the people come out with their own criteria and own ideas which suits to their local conditions.
  • 8.
  • 9.
    How is thisexercise carried out? • Ask the people to come with their own soultions and their own criteria. • Later the PRA Facilitator (team) can add at the end, if people agreed to add that criteria to their proposed list. • Ask if they want to consider the criteria to be not only socially acceptable but also technically sound and financially viable and manageable
  • 11.
    PARTICIPANTS: All those whoare concerned with the problem in question can be invited to participate. PURPOSE: Selecting the most suitable solution for the implementation in order to resolve a pressing problem identified through “NSL Chart”.
  • 12.
    EXPECTED OUTCOME: The mostsuitable solution to the problem in question emerge through people’s consensus which is based on their scoring and ranking
  • 13.
    MEASURES TO BETAKEN  Clear understanding of the method is important. The PRA facilitator can start the participatory analysis of the solutions based on the criteria evolved by people, only after making sure that everyone has understood the method, and purpose of the exercise.  People can suggest if there are any other more scientific way of assessing the appropriateness of the solution.
  • 15.
     Under thisPRA tool, all the problems were discussed with the farmers for all possible reasons using top down approach.  It is a short dendogram analysis of the problem by the farmers.  The possible solution for each cause will be discussed with the farmers.  These causes and solutions were later discussed with the subject matter specialist before the finalization of the tree.
  • 16.
    CASE STUDY Basic information: Nameof the Village : Nongtraw District : East Khasi Hills State : Meghalaya
  • 18.
     Problems identifiedwere categorized as problems arising out of gaps in research in various agricultural disciplines and as problems arisingout of gaps in extension activities.  After getting all the information about resources available in the village it was realized that some opportunities lies in the village itself.  Thus Extension workers and villagers should focus on such opportunities for betterment of livelihood.
  • 19.
    SOLUTIONS IDENTIFIED COLLECTIVELY 1.Eichhornia crassipes as composting materials. 2. Lotus cultivation in pond and swampy area. 3. SRI method of rice cultivation for higher productivity. 4. Diversified vegetable cultivation for enhancing farmer income. 5. IFS for efficient use of on-farm resources and its efficient management. 6. Scientific pisciculture for year round income. 7. Livestock breed up- gradation through Artificial Insemination 8. Cultivation of fodder grass (para grass) to meet feed requirement of cattle. 9. Bio gas production to meet rural energy need (cooking/lighting etc)
  • 21.
    Making a Decisionby Weighing Up Different Factors Decision Matrix Analysis is a useful technique to use for making a decision. It's particularly powerful where you have a number of good alternatives to choose from, and many different factors to take into account. This makes it a great technique to use in almost any important decision where there isn't a clear and obvious preferred option.
  • 22.
    How to Usethe Tool Decision Matrix Analysis works by getting you to list your options as rows on a table, and the factors you need consider as columns. You then score each option/factor combination, weight this score by the relative importance of the factor, and add these scores up to give an overall score for each option.
  • 23.
    1. List allof your options as the row labels on the table, and list the factors that you need to consider as the column headings. 2. Next, work your way down the columns of your table, scoring each option for each of the factors in your decision. Score each option from 0 (poor) to 5 (very good). Note that you do not have to have a different score for each option – if none of them are good for a particular factor in your decision, then all options should score 0.
  • 24.
    3. The nextstep is to work out the relative importance of the factors in your decision. Show these as numbers from, say, 0 to 5, where 0 means that the factor is absolutely unimportant in the final decision, and 5 means that it is very important. (It's perfectly acceptable to have factors with the same importance. 4. Now multiply each of your scores from step 2 by the values for relative importance of the factor that you calculated in step 3. This will give you weighted scores for each option/factor combination. 5. Finally, add up these weighted scores for each of your options. The option that scores the highest wins!
  • 25.
    Example  A catererneeds to find a new supplier for his basic ingredients. He has four different options.  Factors that he wants to consider are: Cost. Quality. Location. Reliability. Payment options.
  • 26.
    Firstly he drawsup the table shown in figure 1, and scores each option by how well it satisfies each factor: Figure 1: Example Decision Matrix Analysis Showing Unweighted Assessment of How Each Supplier Satisfies Each Factor
  • 27.
    Next he decidesthe relative weights for each of the factors. He multiplies these by the scores already entered, and totals them. Figure 2: Example Decision Matrix Analysis Showing Weighted Assessment of How Each Supplier Satisfies Each Factor
  • 28.
    • This makesit clear to the caterer that Supplier 4 is the best option, despite the lack of flexibility of its payment options.
  • 29.
  • 30.
    INTRODUCTION The community canget goods and services from different places.Some resources will be available with in the surroundings, others on the boundaries of the community. People daily, weekly and occasionally fetch for those resources in and out of their area. Therefore they travel long distances under difficult situations.
  • 31.
    PURPOSE • The diagramis used to understand the places traveled, resources collected and to identify the persons travelling. The resource centers could have problems and the road and means of transportation may not be appropriate. • PRA team needs to know the critical goods and services that people travel to fetch for.
  • 32.
    WHO & HOW? ThePRA team identifies individuals or groups who travel to other places on a purpose. Discussion with men and women travelers can give a clue about resource scarcity.  Select informants who travel for resources  Write down as many places as possible visited and resources the most wanted.  The difficulties faced on the way and at the destination are discussed  The informants mark on the ground the starting point and destination for different resources or services.
  • 33.
    APPLICATION The PRA teamand informant record resources in short supply and the reasons for not having in the community and prepares the action plan. The community action plans include  ways and means to get critical resources in the future.  The difficulties faced on the road and at the resource center (destination) taken due consideration for improvement.
  • 34.
    UTILITY • Understand themobility pattern of local people: where do they go and for what? • Increase gender sensitivity and awareness through highlighting the differences in the mobility patterns of men and women • Evaluate the impact of certain interventions by noting their effects on mobility patterns • Plan for intervention and projects
  • 35.
    Example of amobility map Villagers created a map of Saltarpalli village in Orissa of the 15 places they visit. It details • How often they visit each place (each day, every 3 days, etc.), • The distance from the village, the mode of transport (bus or walk, with or without men), • Purpose of visit (healthcare, post office, market, etc.), and • The accessibility of the place, which largely depends on its size. • The participants also discussed the gender analysis of mobility patterns of man and women in the village