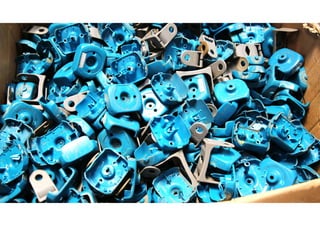
MUNICIPAL solid waste
CommonlyKnown as Garbage or Trash.
It is the Waste Generated from Household
Consumption. It Includes Some Commercial
Waste. Improper MSW Disposal is Associated
with Environmental Pollution & Health Risks.
6.
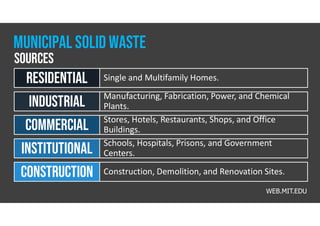
Single and MultifamilyHomes.
Residential
Manufacturing, Fabrication, Power, and Chemical
Plants.
Industrial
Stores, Hotels, Restaurants, Shops, and Office
Buildings.
Commercial
Schools, Hospitals, Prisons, and Government
Centers.
Institutional
Construction, Demolition, and Renovation Sites.
Construction
SOURCES
MUNICIPAL SOLID WASTE
WEB.MIT.EDU
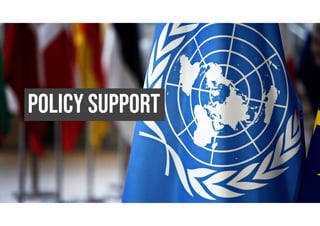
In 1992, theUNEP Int’l Environmental
Technology Center (IETC) was Established
to Support the Implementation of Proper
Solid Waste Management Systems. IETC
Aims to Optimize the Management of Solid
Waste: Plastic, Electronic, Agriculture, and
Food Wastes in Developing Countries.
UNEP.ORG
UN Environment Program
Solid Waste Management
15.
This is aplaceholder text. This text
can be replaced with your own text.
This text can be replaced with your
own text. This is a placeholder text.
This text can be replaced with your
own text. This text can be replaced
with your own text.
9.7
6.6
4.1
3.6
16.
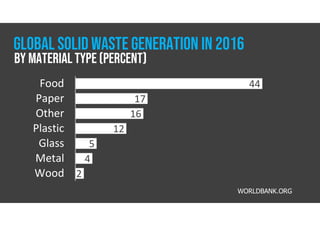
GLOBAL SOLID WASTEGENERATION IN 2016
44
17
16
12
5
4
2
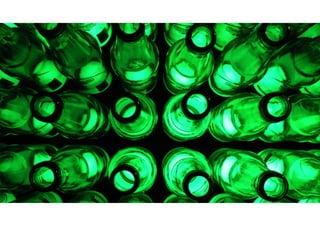
Food
Paper
Other
Plastic
Glass
Metal
Wood
WORLDBANK.ORG
By Material Type (Percent)
17.
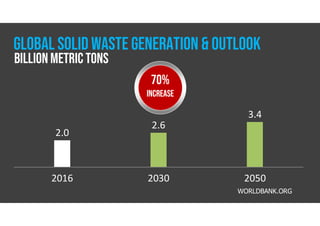
GLOBAL SOLID WASTEGENERATION & outlook
2016 2030 2050
2.0
2.6
3.4
WORLDBANK.ORG
BILLION metric tons
70%
increase
18.
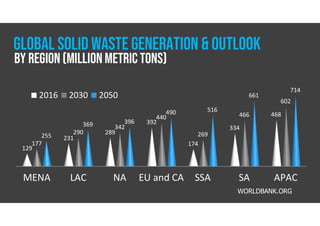
MENA LAC NAEU and CA SSA SA APAC
129
231
289
392
174
334
468
177
290
342
440
269
466
602
255
369 396
490 516
661
714
2016 2030 2050
WORLDBANK.ORG
GLOBAL SOLID WASTE GENERATION & outlook
By region (million metric tons)