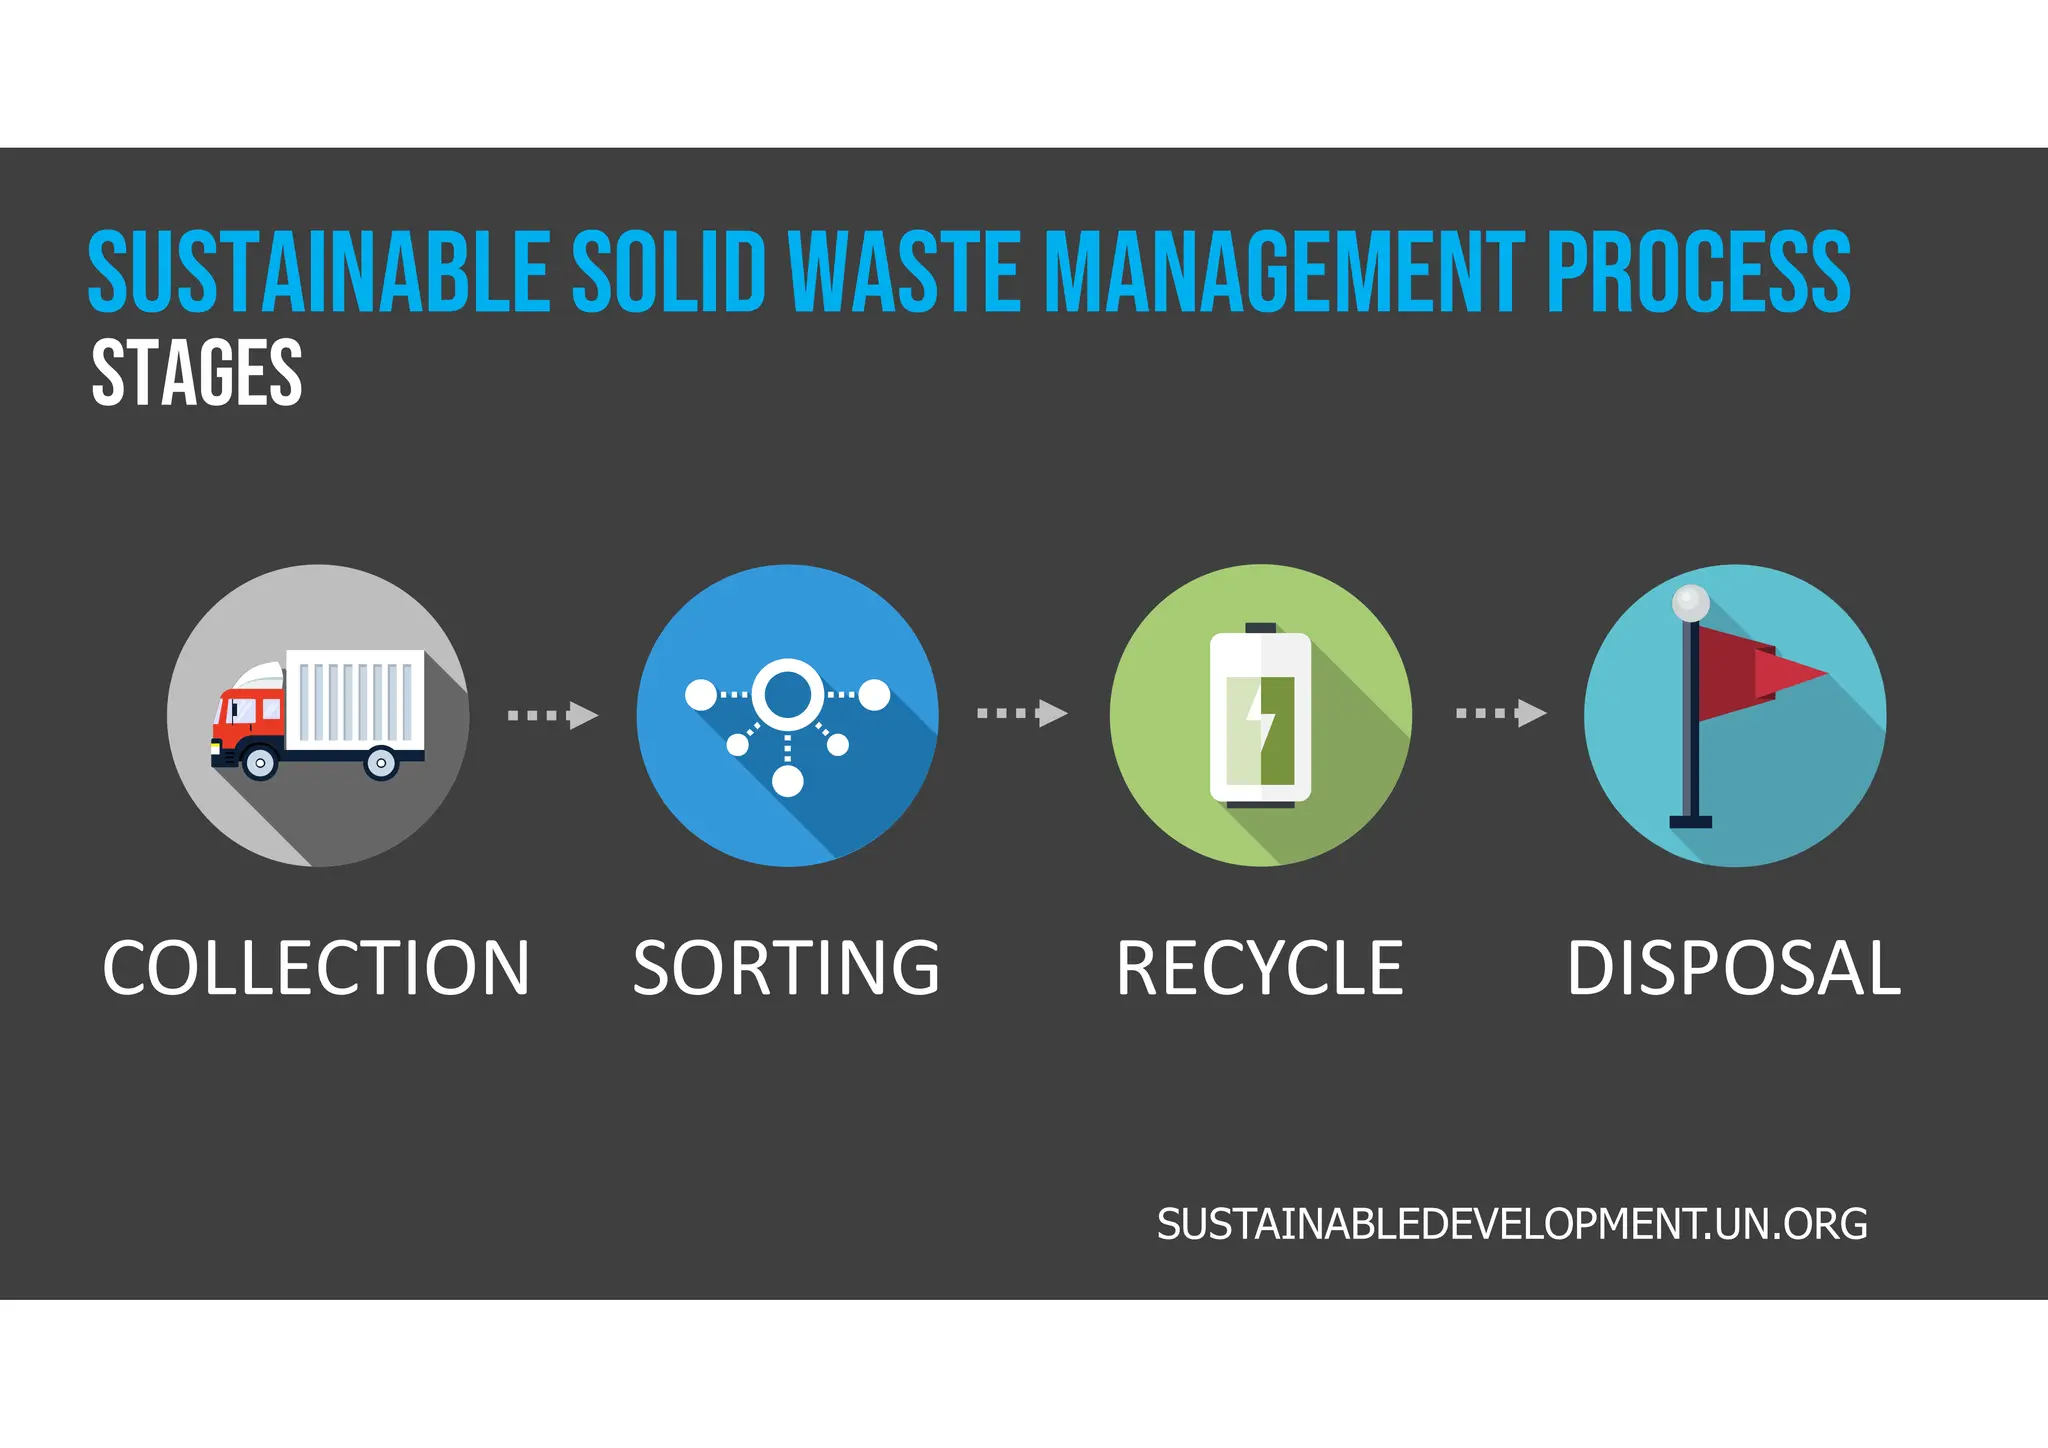
CIRCULAR
WASTE
MANAGEMENT
Dr. Salem Baidas
ENVIRONMENTAL SUSTAINABILITY SLIDESHOWS
FROM s2adesign.com
S2ADESIGN.COM
DEFINITION
01
METHODS
02
STAGES
03
UN POLICY
04
INFOGRAPHICS
05
Commonly Known as Garbage.
It is the Waste Generated from
Household Consumption. Solid
Waste Sources Include Homes
Businesses, Schools & Hospitals.
The Process of Collecting, Treating and
Disposing of Waste in an Environmentally
Sustainable Manner. It Involves Budgeting
Planning, Organization & Implementation to
Reduce Health & Environmental Impacts.
LANDFILL
A Site that is
Used to Dump
Waste: Open Pit
Sanitary and
Controlled.
INCINERATION
Burning of
Waste to Save
Space: 95%
Volume
Reduction.
COMPOST
Converting Food
Waste Into a
Fertilizer that
Can Enrich Soil.
RECYCLE
Processing
Recyclable
Waste Material
into New
Products.
Most Common methods
Solid waste management
EC.EUROPA.EU
COLLECTION SORTING RECYCLE DISPOSAL
stages
SUSTAINABLE Solid waste management PROCESS
SUSTAINABLEDEVELOPMENT.UN.ORG
s
Avoid Wasteful &
Non-Recyclable
Products.
Reduce Wasteful &
Non-Recyclable
Products.
Use Compostable
or Reusable
Products.
Upcycle: Give
Waste Products
New Function.
Not Creating Waste is the Best Strategy
SUSTAINABLE Solid waste management strategy
ROADRUNNERWM.COM
In 1992, the UNEP Int’l Environmental
Technology Center (IETC) was Established
to Support the Implementation of Proper
Solid Waste Management Systems. IETC
Aims to Optimize the Management of Solid
Waste: Plastic, Electronic, Agriculture, and
Food Wastes in Developing Countries.
UNEP.ORG
UN Environment Program
Solid Waste Management
This is a placeholder text. This text
can be replaced with your own text.
This text can be replaced with your
own text. This is a placeholder text.
This text can be replaced with your
own text. This text can be replaced
with your own text.
9.7
6.6
4.1
3.6
GLOBAL SOLID WASTE GENERATION IN 2016
44
17
16
12
5
4
2
Food
Paper
Other
Plastic
Glass
Metal
Wood
WORLDBANK.ORG
By Material Type (Percent)
GLOBAL SOLID WASTE GENERATION & outlook
2016 2030 2050
2.0
2.6
3.4
WORLDBANK.ORG
BILLION metric tons
70%
increase
MENA LAC NA EU and CA SSA SA APAC
129
231
289
392
174
334
468
177
290
342
440
269
466
602
255
369 396
490 516
661
714
2016 2030 2050
WORLDBANK.ORG
GLOBAL SOLID WASTE GENERATION & outlook
By region (million metric tons)
15.55
11.95
11.65
3.85
3.30
2.40
2.15
2.15
1.95
China
India
U.S.
Brazil
Indonesia
Russia
Mexico
Japan
Germany
MAPLECROFT.COM
LEADING COUNTRIES IN Sw GENERATION
Percent (2018)
942
850
814
770
730
701
653
624
475
U.S.
Canada
Australia
Germany
South Africa
France
UK
Japan
KSA
VISUALCAPITALIST.COM
LEADING COUNTRIES IN Sw GENERATION PER CAPITA
KG Per Year (2018)
33
25
14
11
8
6
4
Open Dump
Unsanitary Landfill
Recycling
Incineration
Sanitary Landfill
Composting
Controlled Landfill
WORLDBANK.ORG
GLOBAL SOLID WASTE MANAGEMENTIN 2016
By Method (Percent)
GLOBAL SOLID WASTE Mgmt marketvalue & outlook
Trillion dollars
2022 2023 2024 2025 2026 2027 2028 2029 2030
1.29 1.36 1.43 1.51 1.59 1.67 1.76 1.86 1.96
GRANDVIEWRESEARCH.COM
50%
increase
S2ADesign.com

Circular Waste Management