


![References [1]Gilbert M.Masters, Stanford University” Renewable and Efficient Electric power System”. John Wiley and Sons Ltd., 3rd Edition, 2004. [2]Roger Messenger and Jerry Ventre “Photovoltaic Systems Engineering” CRC Press, 1999. [3]Luis Castaner and SantiagoSilvestre, “Modeling of Photovoltaic Systems using Pspice”.John Willey and Sons, Ltd., 2002. [4] Hand book of Solar Radiation data for India 1980, compiled by Anna Mani, Allied Publishers Pvt. Limited. New Delhi, India. [5] Muhammad H.Rashid “Introduction to PSpice using Orcad for Circuits and Electronics” Third Edition.2003 [6] Mohan Kolhe “Techno-Economic Optimum sizing of a stand-alone solar photovoltaic system”; IEEE transactions on energy conversion, Vol.4 No.2, June 2009, pp 511-519. [7]Mohammad A.S.Masoum, Seyed Mahdi Mousavi Badejani and Ewald F.Fuchs, Fellow, IEEE,”Microprocessor Controlled new class of optimal battery chargers for photovoltaic applications. IEEE transactions on energy conversion, Vol.19. No.3, September 2004, pp 599-606. [8]Florent Boico and Brad Lehman, Member IEEE and Khalil Shujaee “Solar Battery Chargers for NiMH Batteries” IEEE transactions on Power Electronics, Vol.22 No.5, September 2007, pp 1600-1609. [9]R. M. Moharil and P. S. Kulkarni, “A case study of Solar Photovoltaic Power System at Sagardeep Island, India”, International Journal Renewable and Sustainable Energy Reviews (Elsevier Publication), Vol. 13, 2009, pp. 673-681. [10 ] http://mnre.gov.in/](https://image.slidesharecdn.com/solargyenergyanalysis-110812013847-phpapp02/85/Solargy-energy-analysis-51-320.jpg)
![Querries/Suggessions are most welcome [email_address]](https://image.slidesharecdn.com/solargyenergyanalysis-110812013847-phpapp02/85/Solargy-energy-analysis-52-320.jpg)


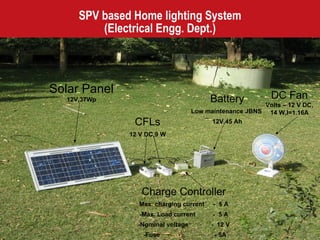
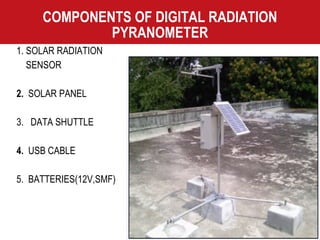
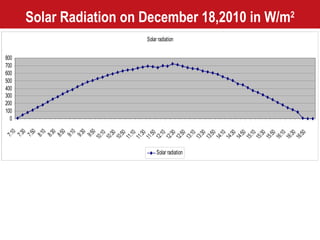
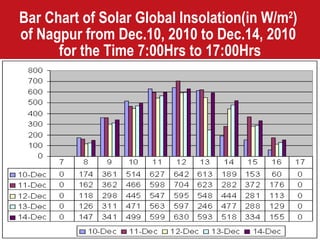
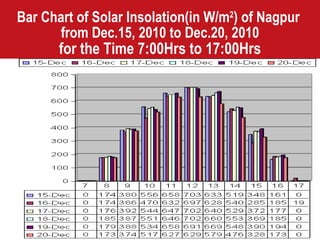
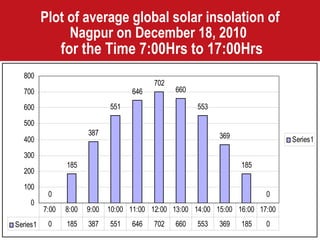
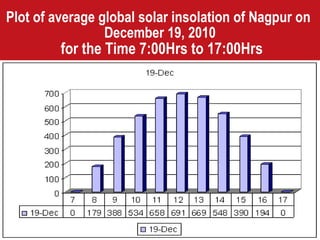
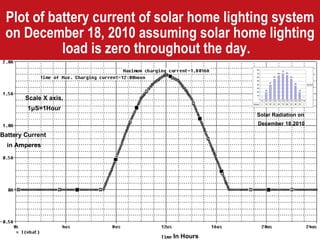
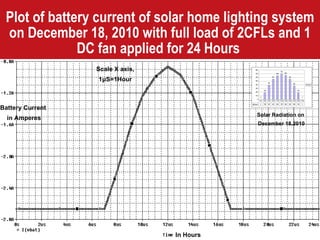
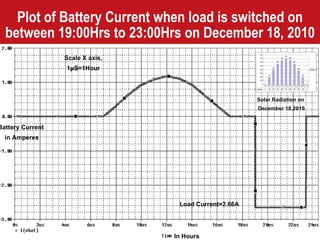
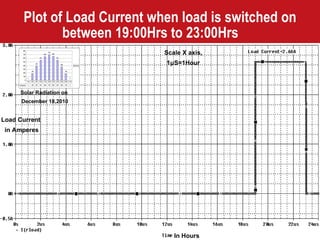
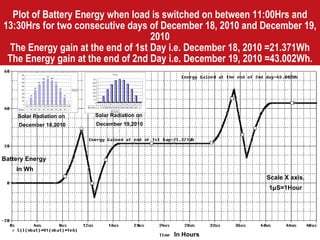
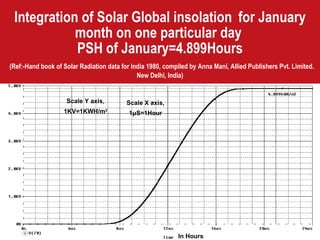
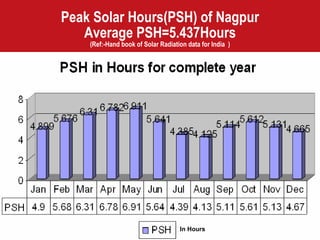
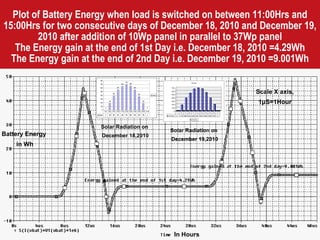
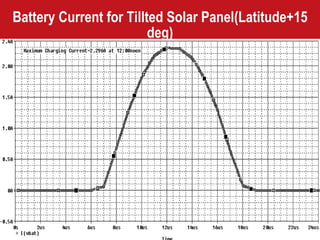
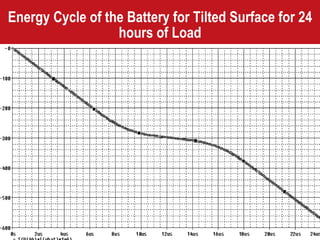
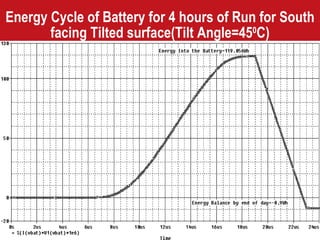
The document discusses the energy analysis and optimal design of a solar home lighting system in Nagpur, India. Key points: 1. The system's performance was analyzed on December 18-19, 2010 using solar radiation data collected from a digital pyranometer. Various load scenarios were simulated. 2. An optimal design was calculated to run the load (2 CFLs, 1 fan) for 4 hours per day using Nagpur's average peak solar hours of 5.437 hours. 3. The analysis determined an additional 10Wp solar panel was needed to ensure continuous energy gain with the existing 37Wp panel under the 4 hour daily load.