


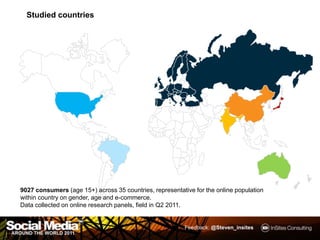


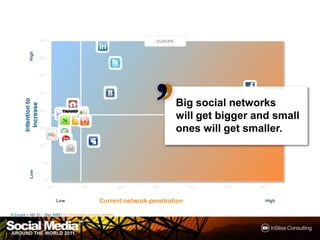


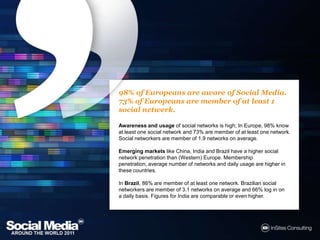
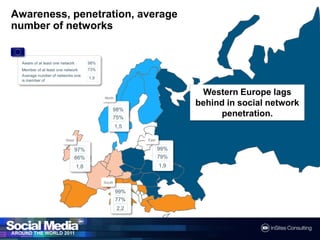
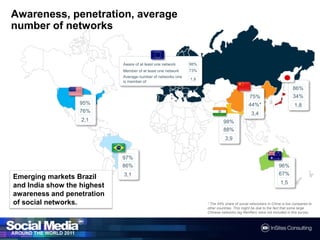
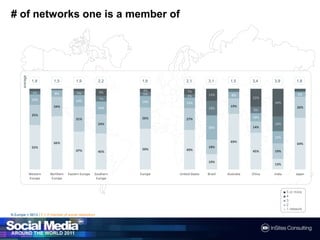
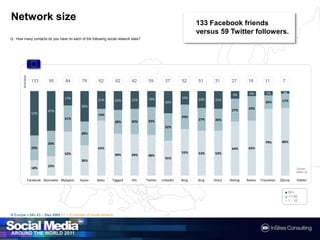
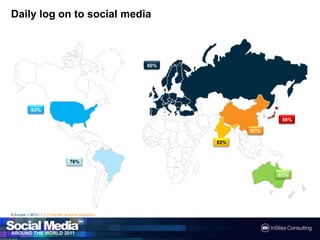
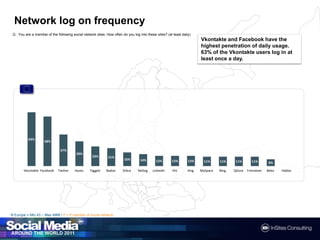

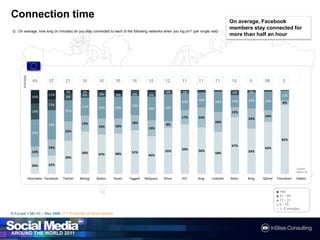

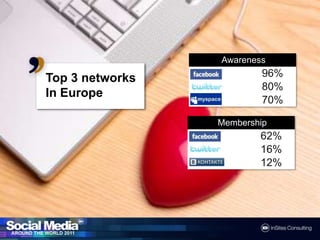
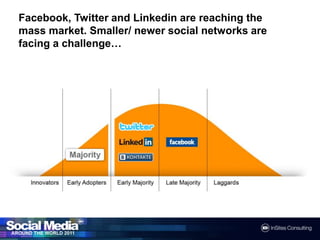
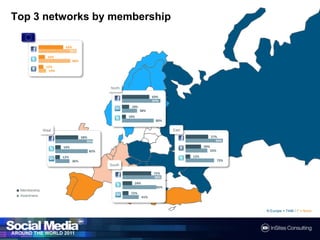
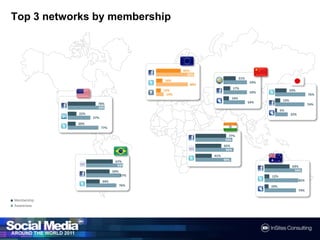
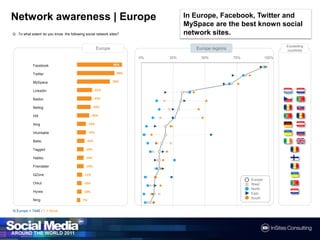
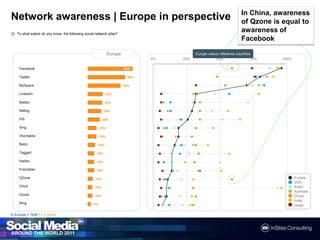
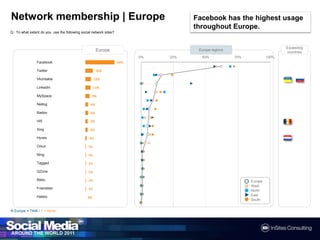
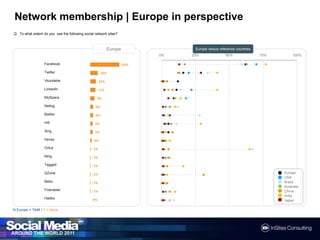
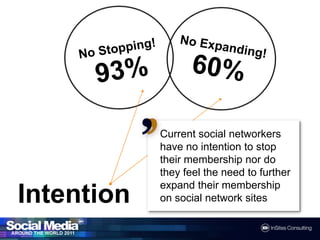
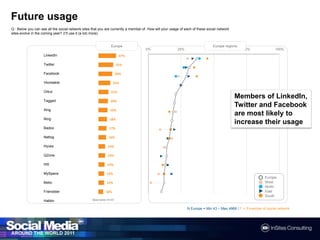
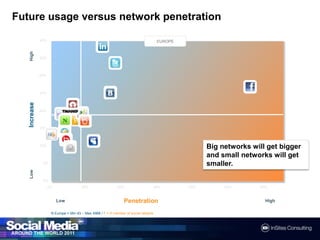
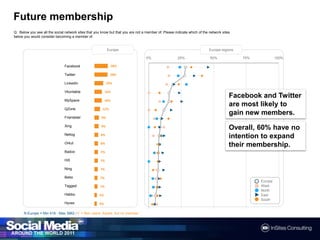

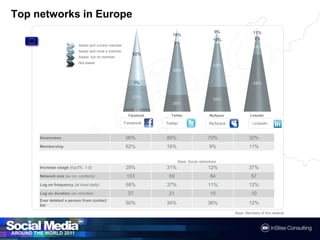
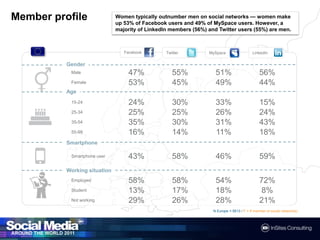

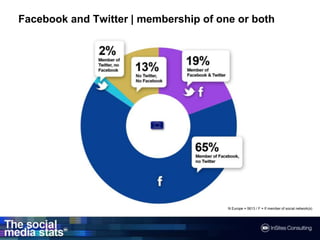
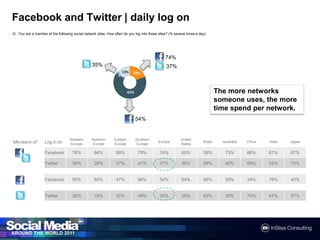
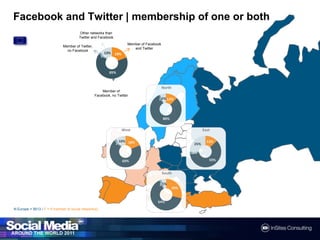


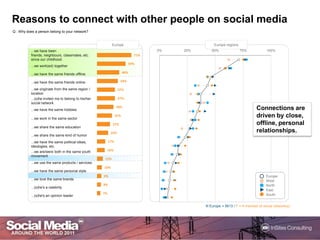
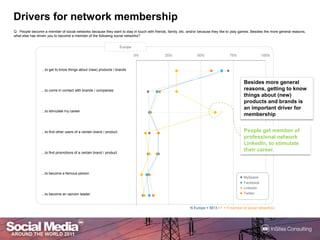

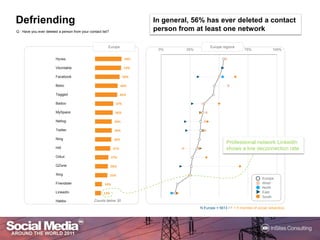
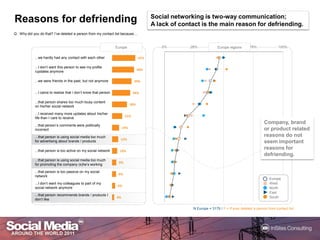
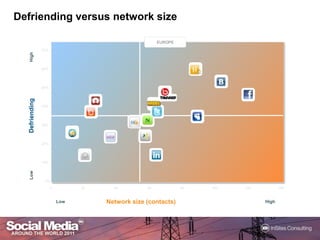


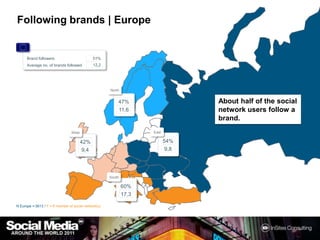


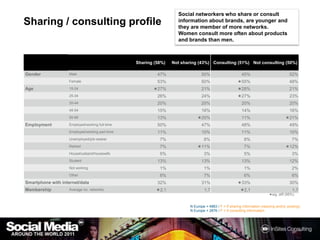


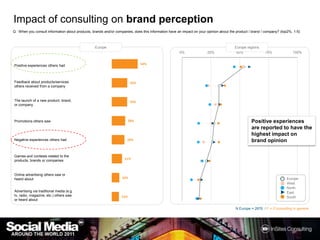
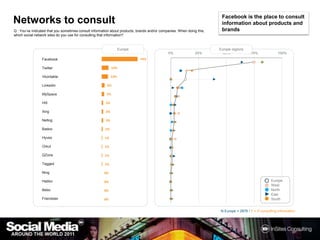


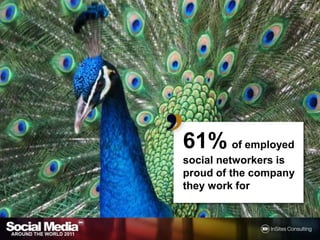
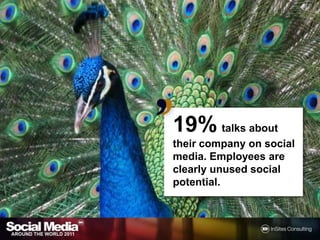
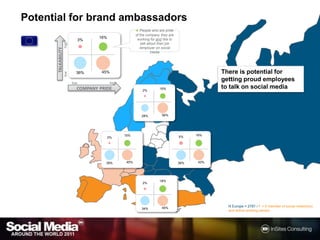
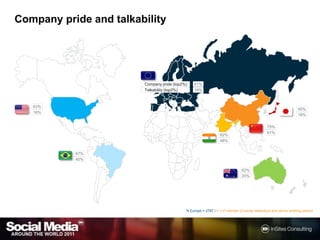
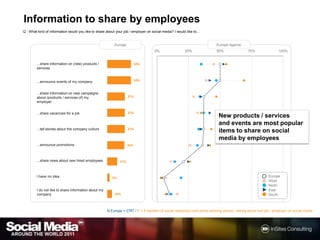


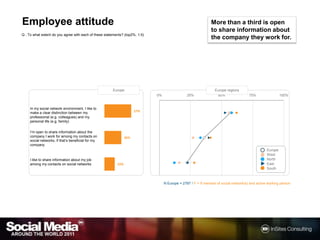

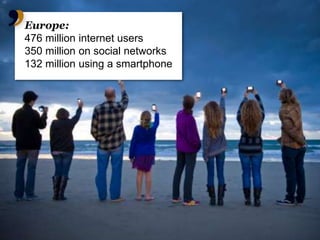
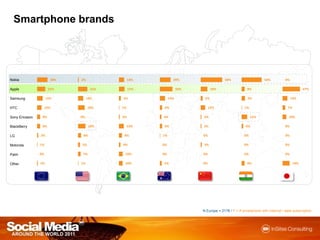

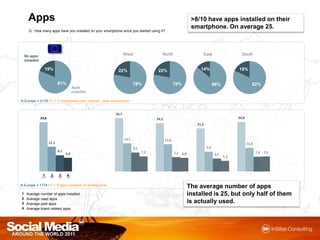
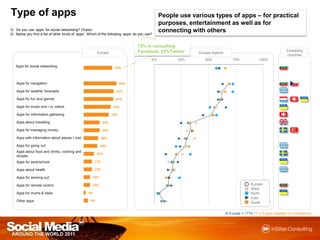


Awareness and usage of social networks is high in Europe, with 98% aware of at least one network and 73% as members of at least one. Emerging markets like Brazil and India have even higher rates of social network penetration. Facebook is the dominant social network in Europe, though other large networks like Twitter and LinkedIn also have significant reach. Smaller networks face challenges growing due to people's reluctance to join new networks or increase their memberships.


![Getting Started with Apache Spark: Big Data Made Simple [Free Meetup]](https://cdn.slidesharecdn.com/ss_thumbnails/apachesparkgettingstarted-260203175547-8361bcc3-thumbnail.jpg?width=640&height=640&fit=bounds)


