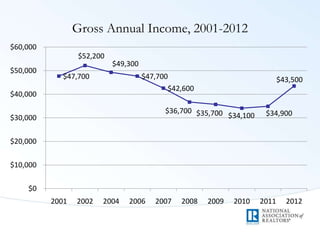
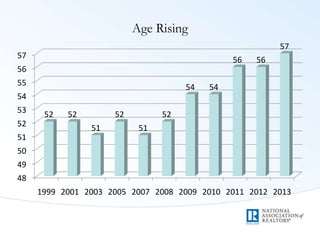
2013 Member Profile
Jessica Lautz
May 13, 2013
Methodology
• Tailored Design Method
• Mailed hard copy and emailed to 58,068 members
• Re-mail reminder
• Received 4,883 surveys
• Response rate of 8.4 percent
• Incentive drawing for gift cards
Business Characteristics
What do our members do?
• 27 percent brokers
• 18 percent broker associates
• 56 percent sales agents
• 4 percent appraisers
Primary Specialty Area Among Brokers
2003 2005 2007 20082009 2010 2011 2012 2013
Residential brokerage 81% 76% 79% 79% 80% 79% 78% 75% 81%
Commercial brokerage 3 4 5 6 6 7 6 4 3
Land/Development 1 3 3 1 3 2 2 2 1
Relocation 2 3 2 * 1 1 1 1 1
Counseling 2 3 1 1 1 1 1 2 1
Appraising 3 2 1 4 1 1 1 1 1
Property management 4 4 4 1 6 6 7 10 8
International * 1 * 3 * * * * 1
Other 4 4 4 4 2 3 5 6 4
Primary Specialty Area Among Sales Agents
2003 2005 2007 20082009 2010 2011 2012 2013
Residential brokerage 84% 74% 75% 77% 86% 87% 83% 83% 83%
Commercial brokerage 2 1 2 2 3 3 3 1 2
Land/Development 1 3 3 1 1 1 1 1 1
Relocation 2 5 6 * 2 2 2 2 2
Counseling 2 5 4 5 1 1 1 1 1
Appraising 3 5 1 4 1 * 1 1 *
Property management 3 3 4 3 4 3 4 5 6
International * * 2 2 1 * 1 * 1
Other 3 3 4 6 2 2 5 6 5
Secondary Specialty Area
37%
18%
17%
15%
8%
7%
4%
3%
3%
3%
1%
10%
27%
0 5 10 15 20 25 30 35 40
Residential brokerage
Commercial property management
Relocation
Commercial brokerage
Counseling
Land development
Residential appraisal
Residential property management
International
Auction
Commercial appraisal
Other
None/Nothing
Years of Experience in Real Estate
0
2
4
6
8
10
12
14
2007 Survey 2008 Survey 2009 Survey 2010 Survey 2011 Survey 2012 Survey 2013 Survey
7
8
10 10
12
11
13
Years of Experience in Real Estate
0
5
10
15
20
25
30
Broker-Owner
(without
selling)
Broker-Owner
(with selling)
Associate
Broker
Manager
(without
selling)
Manager
(with sellling)
Sales Agent Appraiser
25
20
17
29
17
10
22
Number of Personal Assistants
ALL
REALTORS®
2 years or
less
3 to 5
years
6 to 15
years
16 years or
more
None 83% 95% 90% 84% 78%
One 14 5 9 13 17
Two or more 4 0 1 3 5
Make a Difference
• 22 percent members of an affiliate
• 12% CRS—Council of
Residential Specialists
• 9% REBAC—Real Estate
Agent Council
• 36 percent have a designation
• 21% GRI—Graduate
REALTOR Institute
• 15% ABR—Accredited Buyer
Representative
• 39 percent have a certification
• 23% Short Sales and
Foreclosures
• 17% e-Pro
Will Remain Active in Real Estate for Two More
Years by Experience
All
Members
2 years or
less
3 to 5
years
6 to 15
years
16 years or
more
Very certain 80% 77% 81% 82% 78%
Somewhat certain 14 19 15 13 14
Not certain 6 5 5 5 8
Business Activity
Business Activity
2009
Survey
2010
Survey
2011
Survey
2012
Survey
2013
Survey
Properties appraised 200 200 200 200 200
Transaction sides 7 7 8 10 12
Percent of members
who had a transaction
involving a foreclosure
41% 48% 51% 56% 53%
Percent of members
who had a transaction
involving a short sale
28% 40% 45% 51% 51%
Brokerage sales volume $1.2
million
$1.2
million
$1.1
million
$1.3
million
$1.5
million
Number of properties
managed
40 33 25 30 49
Transaction Sides
0
2
4
6
8
10
12
14
ALL
REALTORS®
2 years or less 3 to 5 years 6 to 15 years 16 years or
more
8
4
10
12
13
Most Important Factor Limiting Clients
RESIDENTIAL
SPECIALISTS
Broker/
Broker
Associate
Sales
Agent
Commercial
Specialists
Difficulty in obtaining mortgage
finance 30% 28% 21%
Difficulty in finding the right property 22 28 25
No factors are limiting potential clients 13 13 24
Ability to sell existing home 10 8 5
Expectation that prices might fall
further 8 8 16
Low consumer confidence 8 5 8
Concern about losing job 2 2 0
Where Clients Come From
• 21 percent repeat business from past
clients
• 21 percent referrals from past clients
• 4 percent off member website (of those
with a website)
• Only 34 percent of members report any
business from an open house
Technology
Use of Communications and Tech Products
All REALTORS®
Daily or nearly
every day
A few times
a week
A few times a
month
A few times
a year
Rarely or
Never
E-mail 95% 3% 1% 0 1%
Laptop/Desktop computer 91 4 2 1 2
Smartphone with wireless
email and Internet
capabilities
86 3 1 1 10
Cell phone (no email and
Internet)
61 4 1 0 34
Instant messaging (IM) 39 9 5 3 44
Global positioning system
(GPS)
38 24 17 6 15
Digital camera 30 22 30 11 6
PDA/Handheld (no phone
capabilities)
13 3 2 1 81
Blogs 5 4 10 10 72
RSS feeds 4 4 6 6 81
Podcasts 1 2 6 10 81
Use of Business Software
All REALTORS®
Daily or nearly
every day
A few times
a week
A few times a
month
A few times
a year
Rarely or
Never
Multiple listing 72% 14% 6% 2% 6%
Contact management 30 18 14 9 29
Electronic contract and
forms 26 30 26 8 10
Document preparation 25 27 22 8 19
Comparative market analysis 21 31 31 11 7
Customer relationship
management 18 13 12 9 48
Transaction management 15 15 15 9 46
Social media management
tools 15 12 14 10 50
E-signature 13 13 17 13 44
Property management 9 5 9 11 66
Graphics or presentation 9 14 26 17 34
Loan analysis 5 9 18 18 50
Video 3 6 14 15 62
Preferred Method of Communications
Current clients/
customers
Past clients/
customers
Potential
clients/
customers
Do not use
E-mail 92% 66% 63% 1%
Telephone 90 58 57 1
Text messaging 74 35 31 11
Postal mail 28 40 40 21
Instant
messaging (IM) 26 11 11 46
Blog 4 5 8 67
Video chat 1 1 1 73
Podcast 1 1 2 73
Changes in Technology
Communication
Source
2009
Survey
2010
Survey
2011
Survey
2012
Survey
2013
Survey
Realtor website 60% 63% 62% 62% 64%
Realtor blog 7 10 10 10 12
Use of social media 35 51 49 54 56
Information on Websites
Residential Commercial
Own property listings 93% 93%
Information about home buying and selling 87 67
Mortgage or financial calculators 75 23
Link to my firm's Web site 66 86
Community information/demographics 56 28
Virtual tours 55 36
School reports 54 28
Links to state/local government Web sites 43 29
Home valuation/Comparative Market Analysis tools 40 7
Current mortgage rates 38 29
Links to real estate service providers (title companies,
settlement services, etc) 32 24
Links to mortgage lenders' Web sites 30 16
Appointment scheduler 21 13
Firm Web Presence
Firm has Web
site, 94%
Firm does not
have Web
site, 4%
Firm does not
have Web site
but plans to
in the
future, 1%
Median Amount Spent on Website
$0
$100
$200
$300
$400
$500
$600
ALL
REALTORS®
Broker-Owner
(without
selling)
Broker-Owner
(with selling)
Associate
Broker
Manager
(without
selling)
Manager
(with sellling)
Sales Agent
$220
$300
$560
$150
$270
$370
$260
Percent of Business from Website by Amount to Maintain
0
2
4
6
8
10
12
14
ALL
REALTORS®
None Less than
$100
$100 to $499 $500 to $999 $1,000 or
more
4
0%
3%
4%
7%
12%
Income and Expenses
Compensation Structures
All REALTORS
Percentage commission split 68%
100% Commission 18
Commission plus share of profits 4
Salary plus share of profits/production bonus 3
Salary only 1
Share of profits only 1
Other 5
Gross Annual Income, 2001-2012
$47,700
$52,200
$49,300
$47,700
$42,600
$36,700 $35,700 $34,100 $34,900
$43,500
$0
$10,000
$20,000
$30,000
$40,000
$50,000
$60,000
2001 2002 2004 2006 2007 2008 2009 2010 2011 2012
Net Annual Income, 2012
$0
$5,000
$10,000
$15,000
$20,000
$25,000
$30,000
$35,000
In 2012 In 2011 Broker/ Broker
Associate
Sales Agent
$27,400
$23,200
$33,500
$22,200
Gross Annual Income by Experience, 2012
$0
$10,000
$20,000
$30,000
$40,000
$50,000
$60,000
ALL REALTORS® 2 years or less 3 to 5 years 6 to 15 years 16 years or
more
$43,500
$9,700
$29,600
$46,000
$57,300
Expenses 2010-2013
2010 2011 2012 2013
Total Expenses $5,480 $4,270 $4,520 $4,900
Business Use of Vehicle 1,580 1,680 1,770 1,790
Technology 720 630 630 690
Professional Development 700 600 600 640
Administrative 690 720 560 830
Marketing of Services 690 550 510 590
Median percent spent on online
marketing
10% 10% 10% 10%
Business Promotion 670 580 560 640
Affinity/Referral Relationship 0 0 0 0
Office/Lease Building 0 0 0 0
Office and Firm Affiliation
Where do our members work?
Independent
company
56%
Franchised
company
41%
Other
3%
What type of firm?
• Typical firm size 23 brokers and agents
– Typical firm has 1 office
– Typical office size has 24 brokers and
agents
• 7 years typical tenure at firm
• 10 percent worked at a firm that was bought
or merged
Relationship to the Firm
Independent
Contractor, 83
%
Employee, 6%
Other, 11%
Benefits Received
Provided
by Firm
Provided by
Partner/
Spouse/ Family
Pays for
out of
pocket
Do not
receive
Errors and omissions
(liability insurance) 22% 11% 38% 31%
Health insurance 4 27 34 36
Paid vacation/sick days 4 12 19 66
Pension/SEP/401(K) 4 15 30 53
Life insurance 3 17 35 46
Dental insurance 3 25 24 49
Disability insurance (long-
term care) 3 14 20 65
Vision care 3 23 25 50
Other 2 11 15 72
Demographics
Who Are Our Members?
Typical member:
• 57-years-old
• 57 percent are female
• 50 percent at least a Bachelor’s degree
• 34 percent had prior career in
management/business/financial or
sales/retail
• 77 percent real estate is only occupation
• Household income in 2012--$99,400
• 47 percent real estate is primary source of
income for household
Age Rising
48
49
50
51
52
53
54
55
56
57
1999 2001 2003 2005 2007 2008 2009 2010 2011 2012 2013
52 52
51
52
51
52
54 54
56 56
57
Invest in Their Product
• 87% own their own home
• 13% own a vacation property
• 36% own a residential
investment property
• 10% own a commercial property
For More Information
Member Profile Webpage
www.realtor.org/reports/member-profile
The Economists’ Outlook Blog:
economistsoutlook.blogs.realtor.org/
Via the NAR Research FaceBook Page:
www.facebook.com/narresearchgroup
Via @NAR_Research Twitter Account:
twitter.com/NAR_Research

Snapshot: 2013 NAR Member Profile

  • 1.
    2013 Member Profile JessicaLautz May 13, 2013
  • 2.
    Methodology • Tailored DesignMethod • Mailed hard copy and emailed to 58,068 members • Re-mail reminder • Received 4,883 surveys • Response rate of 8.4 percent • Incentive drawing for gift cards
  • 3.
  • 4.
    What do ourmembers do? • 27 percent brokers • 18 percent broker associates • 56 percent sales agents • 4 percent appraisers
  • 5.
    Primary Specialty AreaAmong Brokers 2003 2005 2007 20082009 2010 2011 2012 2013 Residential brokerage 81% 76% 79% 79% 80% 79% 78% 75% 81% Commercial brokerage 3 4 5 6 6 7 6 4 3 Land/Development 1 3 3 1 3 2 2 2 1 Relocation 2 3 2 * 1 1 1 1 1 Counseling 2 3 1 1 1 1 1 2 1 Appraising 3 2 1 4 1 1 1 1 1 Property management 4 4 4 1 6 6 7 10 8 International * 1 * 3 * * * * 1 Other 4 4 4 4 2 3 5 6 4
  • 6.
    Primary Specialty AreaAmong Sales Agents 2003 2005 2007 20082009 2010 2011 2012 2013 Residential brokerage 84% 74% 75% 77% 86% 87% 83% 83% 83% Commercial brokerage 2 1 2 2 3 3 3 1 2 Land/Development 1 3 3 1 1 1 1 1 1 Relocation 2 5 6 * 2 2 2 2 2 Counseling 2 5 4 5 1 1 1 1 1 Appraising 3 5 1 4 1 * 1 1 * Property management 3 3 4 3 4 3 4 5 6 International * * 2 2 1 * 1 * 1 Other 3 3 4 6 2 2 5 6 5
  • 7.
    Secondary Specialty Area 37% 18% 17% 15% 8% 7% 4% 3% 3% 3% 1% 10% 27% 05 10 15 20 25 30 35 40 Residential brokerage Commercial property management Relocation Commercial brokerage Counseling Land development Residential appraisal Residential property management International Auction Commercial appraisal Other None/Nothing
  • 8.
    Years of Experiencein Real Estate 0 2 4 6 8 10 12 14 2007 Survey 2008 Survey 2009 Survey 2010 Survey 2011 Survey 2012 Survey 2013 Survey 7 8 10 10 12 11 13
  • 9.
    Years of Experiencein Real Estate 0 5 10 15 20 25 30 Broker-Owner (without selling) Broker-Owner (with selling) Associate Broker Manager (without selling) Manager (with sellling) Sales Agent Appraiser 25 20 17 29 17 10 22
  • 10.
    Number of PersonalAssistants ALL REALTORS® 2 years or less 3 to 5 years 6 to 15 years 16 years or more None 83% 95% 90% 84% 78% One 14 5 9 13 17 Two or more 4 0 1 3 5
  • 11.
    Make a Difference •22 percent members of an affiliate • 12% CRS—Council of Residential Specialists • 9% REBAC—Real Estate Agent Council • 36 percent have a designation • 21% GRI—Graduate REALTOR Institute • 15% ABR—Accredited Buyer Representative • 39 percent have a certification • 23% Short Sales and Foreclosures • 17% e-Pro
  • 12.
    Will Remain Activein Real Estate for Two More Years by Experience All Members 2 years or less 3 to 5 years 6 to 15 years 16 years or more Very certain 80% 77% 81% 82% 78% Somewhat certain 14 19 15 13 14 Not certain 6 5 5 5 8
  • 13.
  • 14.
    Business Activity 2009 Survey 2010 Survey 2011 Survey 2012 Survey 2013 Survey Properties appraised200 200 200 200 200 Transaction sides 7 7 8 10 12 Percent of members who had a transaction involving a foreclosure 41% 48% 51% 56% 53% Percent of members who had a transaction involving a short sale 28% 40% 45% 51% 51% Brokerage sales volume $1.2 million $1.2 million $1.1 million $1.3 million $1.5 million Number of properties managed 40 33 25 30 49
  • 15.
    Transaction Sides 0 2 4 6 8 10 12 14 ALL REALTORS® 2 yearsor less 3 to 5 years 6 to 15 years 16 years or more 8 4 10 12 13
  • 16.
    Most Important FactorLimiting Clients RESIDENTIAL SPECIALISTS Broker/ Broker Associate Sales Agent Commercial Specialists Difficulty in obtaining mortgage finance 30% 28% 21% Difficulty in finding the right property 22 28 25 No factors are limiting potential clients 13 13 24 Ability to sell existing home 10 8 5 Expectation that prices might fall further 8 8 16 Low consumer confidence 8 5 8 Concern about losing job 2 2 0
  • 17.
    Where Clients ComeFrom • 21 percent repeat business from past clients • 21 percent referrals from past clients • 4 percent off member website (of those with a website) • Only 34 percent of members report any business from an open house
  • 18.
  • 19.
    Use of Communicationsand Tech Products All REALTORS® Daily or nearly every day A few times a week A few times a month A few times a year Rarely or Never E-mail 95% 3% 1% 0 1% Laptop/Desktop computer 91 4 2 1 2 Smartphone with wireless email and Internet capabilities 86 3 1 1 10 Cell phone (no email and Internet) 61 4 1 0 34 Instant messaging (IM) 39 9 5 3 44 Global positioning system (GPS) 38 24 17 6 15 Digital camera 30 22 30 11 6 PDA/Handheld (no phone capabilities) 13 3 2 1 81 Blogs 5 4 10 10 72 RSS feeds 4 4 6 6 81 Podcasts 1 2 6 10 81
  • 20.
    Use of BusinessSoftware All REALTORS® Daily or nearly every day A few times a week A few times a month A few times a year Rarely or Never Multiple listing 72% 14% 6% 2% 6% Contact management 30 18 14 9 29 Electronic contract and forms 26 30 26 8 10 Document preparation 25 27 22 8 19 Comparative market analysis 21 31 31 11 7 Customer relationship management 18 13 12 9 48 Transaction management 15 15 15 9 46 Social media management tools 15 12 14 10 50 E-signature 13 13 17 13 44 Property management 9 5 9 11 66 Graphics or presentation 9 14 26 17 34 Loan analysis 5 9 18 18 50 Video 3 6 14 15 62
  • 21.
    Preferred Method ofCommunications Current clients/ customers Past clients/ customers Potential clients/ customers Do not use E-mail 92% 66% 63% 1% Telephone 90 58 57 1 Text messaging 74 35 31 11 Postal mail 28 40 40 21 Instant messaging (IM) 26 11 11 46 Blog 4 5 8 67 Video chat 1 1 1 73 Podcast 1 1 2 73
  • 22.
    Changes in Technology Communication Source 2009 Survey 2010 Survey 2011 Survey 2012 Survey 2013 Survey Realtorwebsite 60% 63% 62% 62% 64% Realtor blog 7 10 10 10 12 Use of social media 35 51 49 54 56
  • 23.
    Information on Websites ResidentialCommercial Own property listings 93% 93% Information about home buying and selling 87 67 Mortgage or financial calculators 75 23 Link to my firm's Web site 66 86 Community information/demographics 56 28 Virtual tours 55 36 School reports 54 28 Links to state/local government Web sites 43 29 Home valuation/Comparative Market Analysis tools 40 7 Current mortgage rates 38 29 Links to real estate service providers (title companies, settlement services, etc) 32 24 Links to mortgage lenders' Web sites 30 16 Appointment scheduler 21 13
  • 24.
    Firm Web Presence Firmhas Web site, 94% Firm does not have Web site, 4% Firm does not have Web site but plans to in the future, 1%
  • 25.
    Median Amount Spenton Website $0 $100 $200 $300 $400 $500 $600 ALL REALTORS® Broker-Owner (without selling) Broker-Owner (with selling) Associate Broker Manager (without selling) Manager (with sellling) Sales Agent $220 $300 $560 $150 $270 $370 $260
  • 26.
    Percent of Businessfrom Website by Amount to Maintain 0 2 4 6 8 10 12 14 ALL REALTORS® None Less than $100 $100 to $499 $500 to $999 $1,000 or more 4 0% 3% 4% 7% 12%
  • 27.
  • 28.
    Compensation Structures All REALTORS Percentagecommission split 68% 100% Commission 18 Commission plus share of profits 4 Salary plus share of profits/production bonus 3 Salary only 1 Share of profits only 1 Other 5
  • 29.
    Gross Annual Income,2001-2012 $47,700 $52,200 $49,300 $47,700 $42,600 $36,700 $35,700 $34,100 $34,900 $43,500 $0 $10,000 $20,000 $30,000 $40,000 $50,000 $60,000 2001 2002 2004 2006 2007 2008 2009 2010 2011 2012
  • 30.
    Net Annual Income,2012 $0 $5,000 $10,000 $15,000 $20,000 $25,000 $30,000 $35,000 In 2012 In 2011 Broker/ Broker Associate Sales Agent $27,400 $23,200 $33,500 $22,200
  • 31.
    Gross Annual Incomeby Experience, 2012 $0 $10,000 $20,000 $30,000 $40,000 $50,000 $60,000 ALL REALTORS® 2 years or less 3 to 5 years 6 to 15 years 16 years or more $43,500 $9,700 $29,600 $46,000 $57,300
  • 32.
    Expenses 2010-2013 2010 20112012 2013 Total Expenses $5,480 $4,270 $4,520 $4,900 Business Use of Vehicle 1,580 1,680 1,770 1,790 Technology 720 630 630 690 Professional Development 700 600 600 640 Administrative 690 720 560 830 Marketing of Services 690 550 510 590 Median percent spent on online marketing 10% 10% 10% 10% Business Promotion 670 580 560 640 Affinity/Referral Relationship 0 0 0 0 Office/Lease Building 0 0 0 0
  • 33.
    Office and FirmAffiliation
  • 34.
    Where do ourmembers work? Independent company 56% Franchised company 41% Other 3%
  • 35.
    What type offirm? • Typical firm size 23 brokers and agents – Typical firm has 1 office – Typical office size has 24 brokers and agents • 7 years typical tenure at firm • 10 percent worked at a firm that was bought or merged
  • 36.
    Relationship to theFirm Independent Contractor, 83 % Employee, 6% Other, 11%
  • 37.
    Benefits Received Provided by Firm Providedby Partner/ Spouse/ Family Pays for out of pocket Do not receive Errors and omissions (liability insurance) 22% 11% 38% 31% Health insurance 4 27 34 36 Paid vacation/sick days 4 12 19 66 Pension/SEP/401(K) 4 15 30 53 Life insurance 3 17 35 46 Dental insurance 3 25 24 49 Disability insurance (long- term care) 3 14 20 65 Vision care 3 23 25 50 Other 2 11 15 72
  • 38.
  • 39.
    Who Are OurMembers? Typical member: • 57-years-old • 57 percent are female • 50 percent at least a Bachelor’s degree • 34 percent had prior career in management/business/financial or sales/retail • 77 percent real estate is only occupation • Household income in 2012--$99,400 • 47 percent real estate is primary source of income for household
  • 40.
    Age Rising 48 49 50 51 52 53 54 55 56 57 1999 20012003 2005 2007 2008 2009 2010 2011 2012 2013 52 52 51 52 51 52 54 54 56 56 57
  • 41.
    Invest in TheirProduct • 87% own their own home • 13% own a vacation property • 36% own a residential investment property • 10% own a commercial property
  • 42.
    For More Information MemberProfile Webpage www.realtor.org/reports/member-profile The Economists’ Outlook Blog: economistsoutlook.blogs.realtor.org/ Via the NAR Research FaceBook Page: www.facebook.com/narresearchgroup Via @NAR_Research Twitter Account: twitter.com/NAR_Research