This document provides an overview of agricultural meteorology. It defines meteorology and agricultural meteorology, noting that agricultural meteorology applies meteorological data and information to enhance crop yields and reduce losses from adverse weather. It discusses the importance of agricultural meteorology for crop production planning, selection of sowing dates, irrigation, reducing pest and disease impacts, and more. The document also outlines the scope of agricultural meteorology, including studying crop-weather relationships, developing forecasting models, monitoring drought impacts, and developing agro-advisories. It briefly describes the divisions of meteorology and their applications.


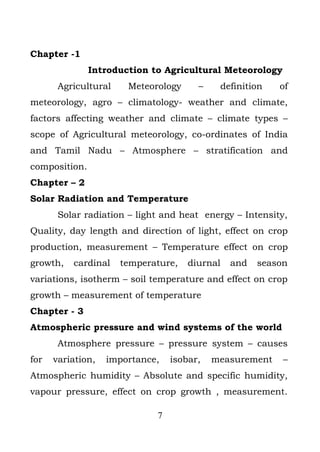


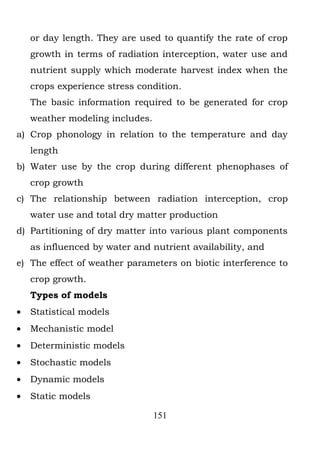
![Climates of India and Tamilnadu and their
characterization
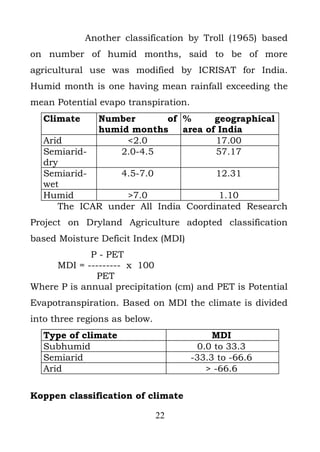
Climate classification was tried by many
scientists from beginning of 19th century using many
parameters. Thornthwaite during 1931 and 1948
classified the climate using precipitation and evaporation
/Potential evaporation and was subsequently modified by
Mathur (1955) for the Moisture Index (Im) and is given
below
Im = 100 [(P-PE)/PE]
Where P = Precipitation, PE = Potential
evapo-transpiration
Using the moisture Index (Im) the following
classification was made
Im Quantity Climate
classification
100 and above Per humid
20 to 100 Humid
0 to 20 Moist sub humid
-33.3 to 0 Dry sub humid
-66.7 to -33.3 Semi arid
-100 to -66.7 Arid
21](https://image.slidesharecdn.com/smsknew-book-1-120309105050-phpapp01/85/Smsk-new-book-1-31-320.jpg)
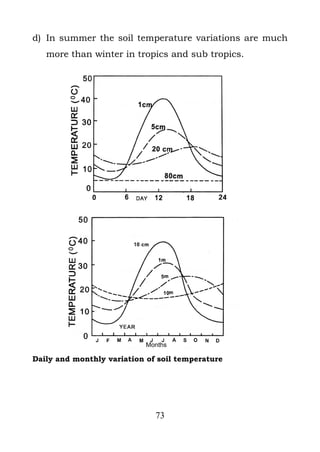


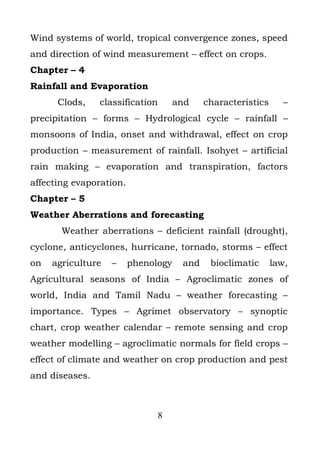
![Environmental factors that affecting plant growth]](https://cdn.slidesharecdn.com/ss_thumbnails/groupaenvironmentalfactorsthataffectingplantgrowth-190210170052-thumbnail.jpg?width=640&height=640&fit=bounds)


