Downloaded 157 times

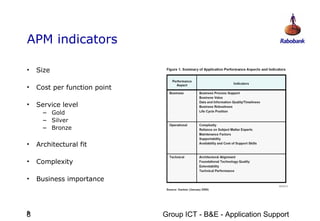

The document discusses the fundamentals of application portfolio management (APM), focusing on performance metrics such as cost per function point and productivity. It emphasizes the need for a consistent set of indicators to guide management decisions regarding software applications and their alignment with business strategy. Special challenges in sizing applications, particularly for complex systems like Siebel and SAP, are also outlined along with methods for effective size estimation.