Download to read offline


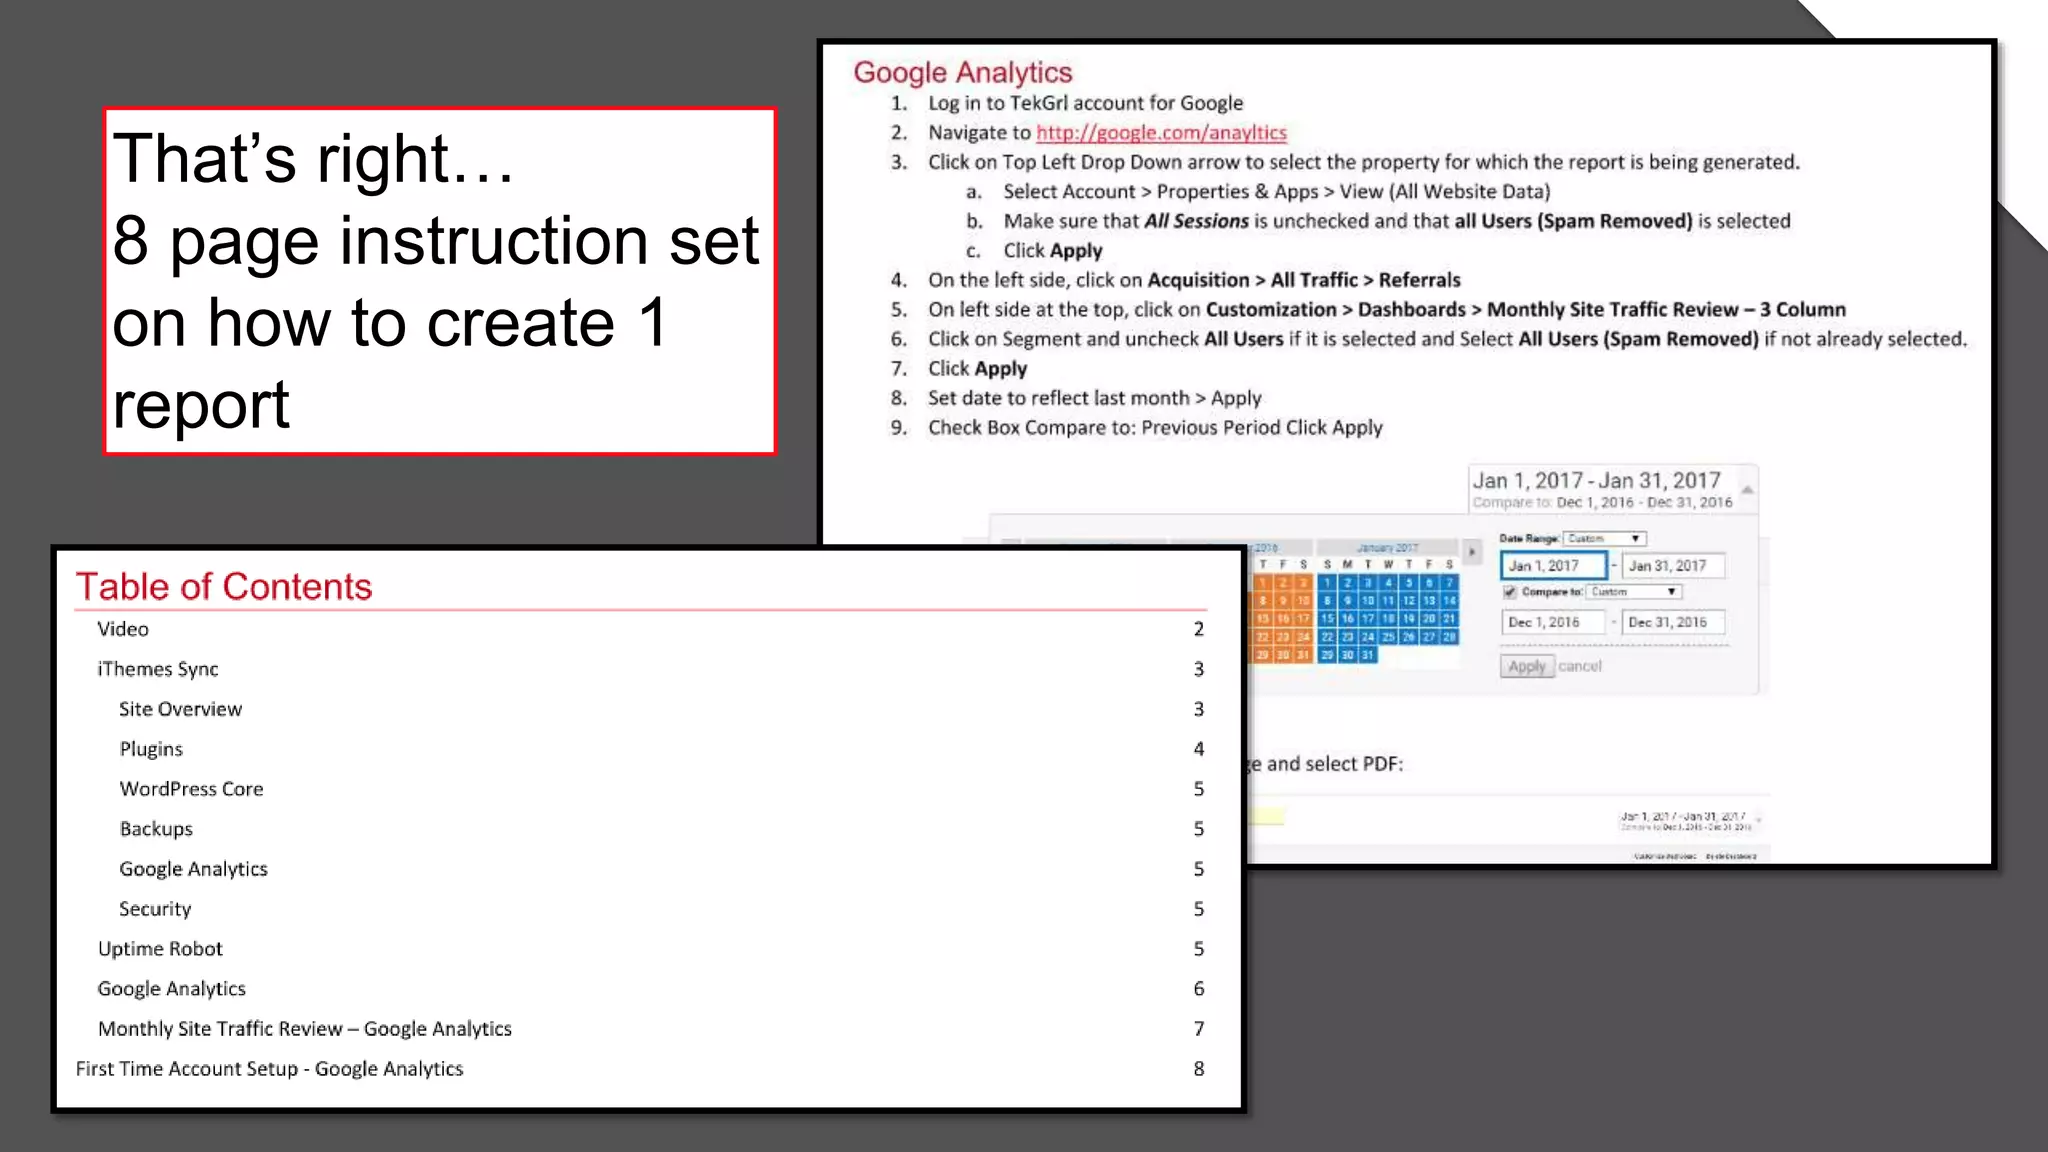


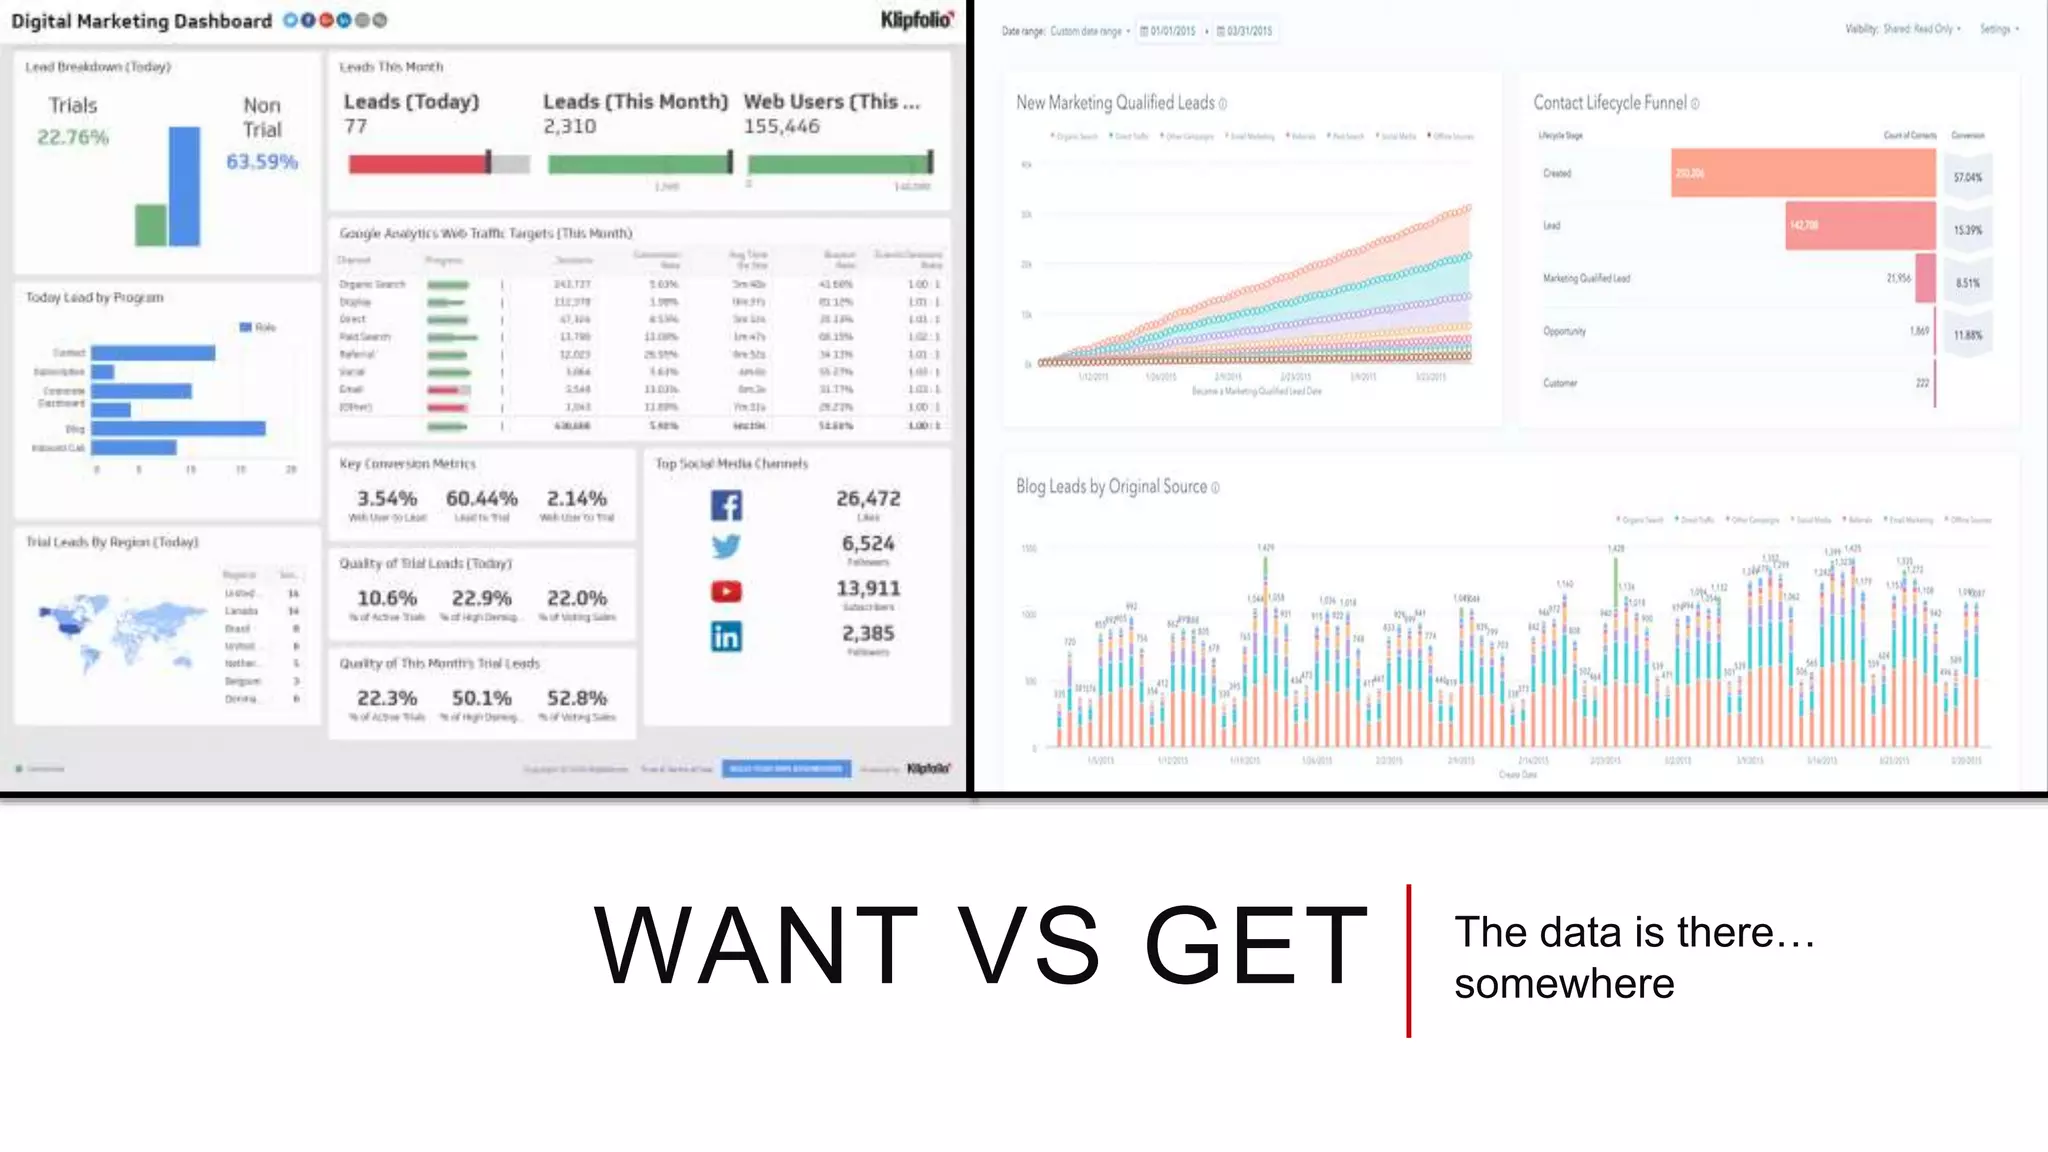


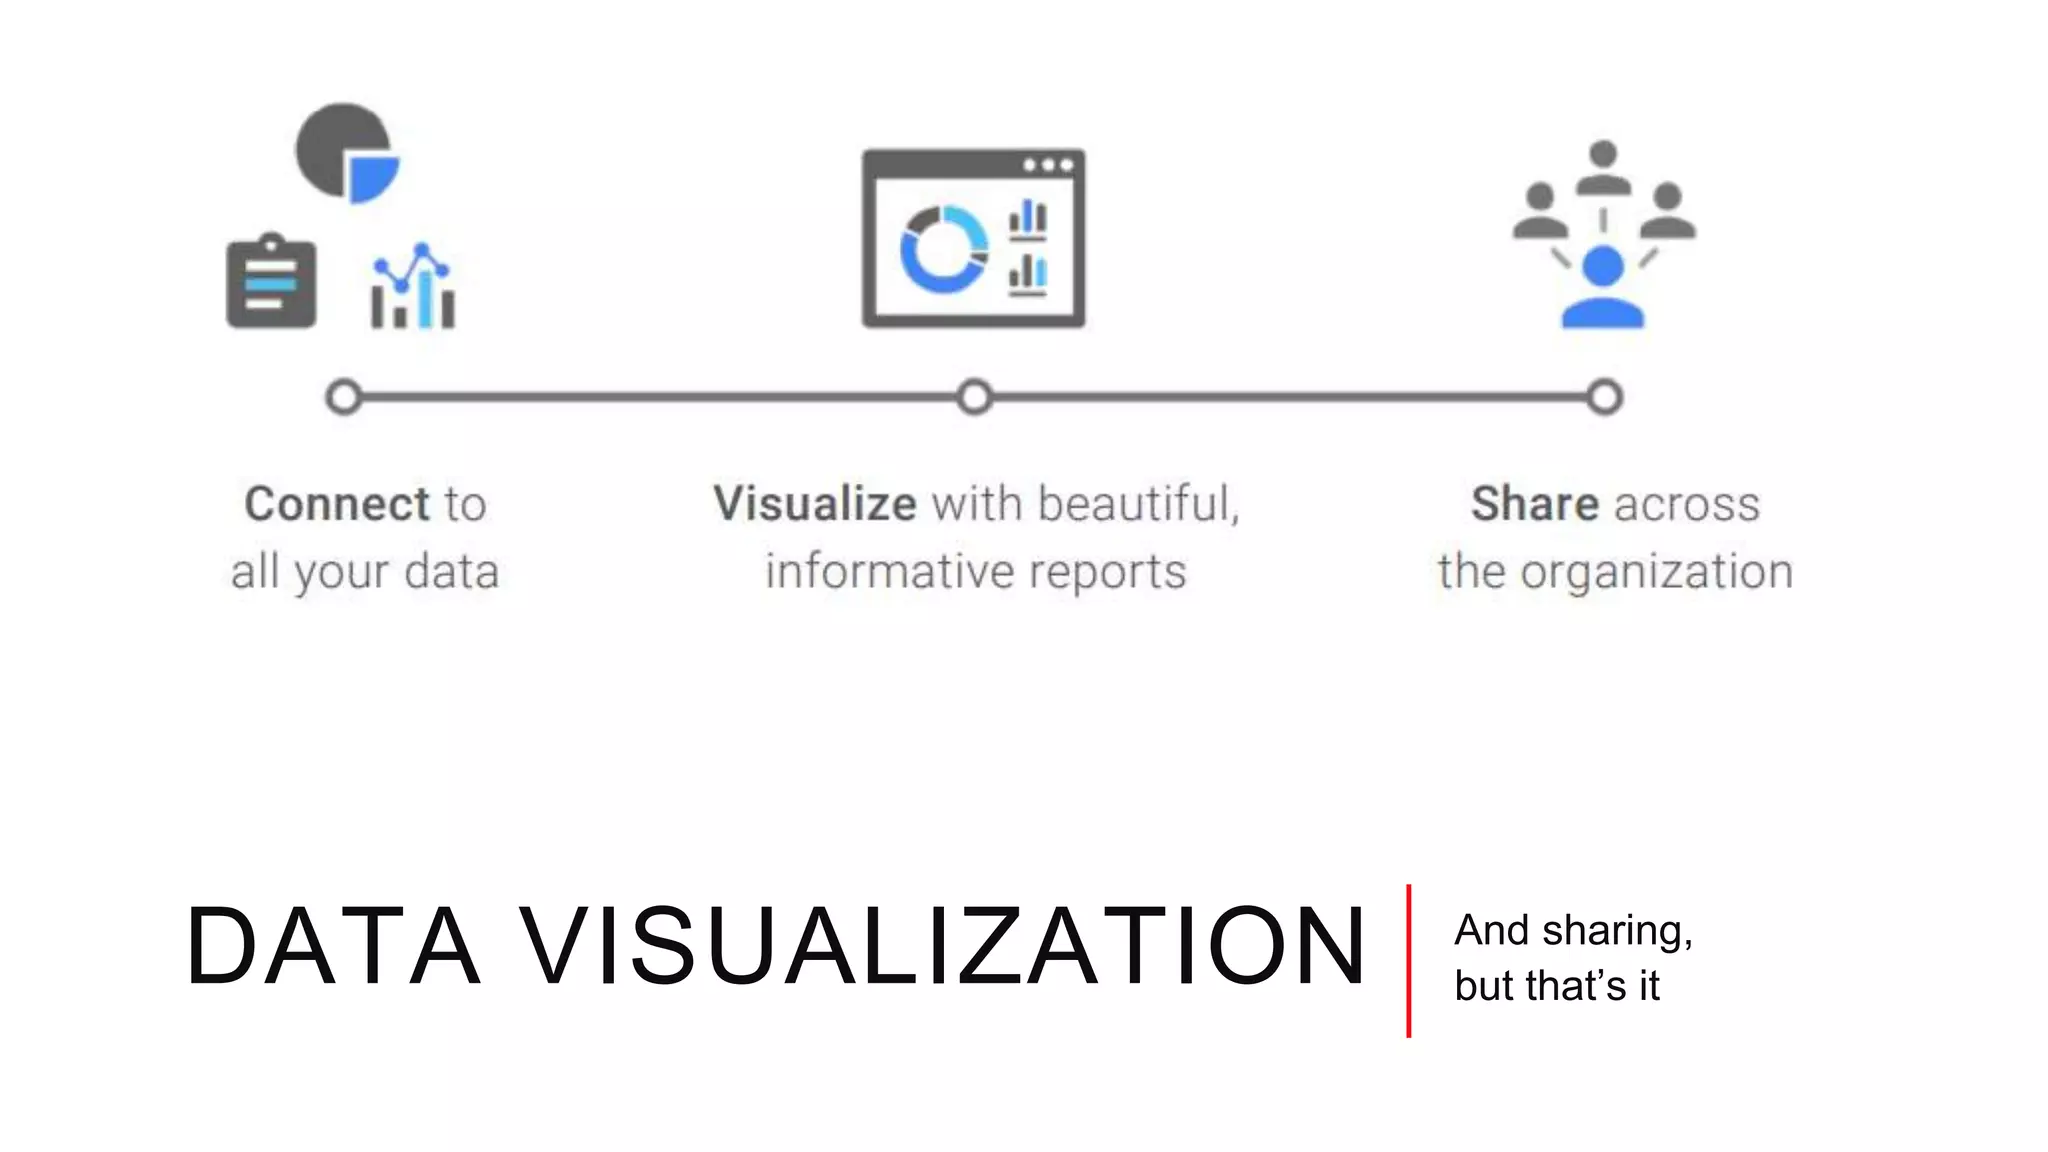
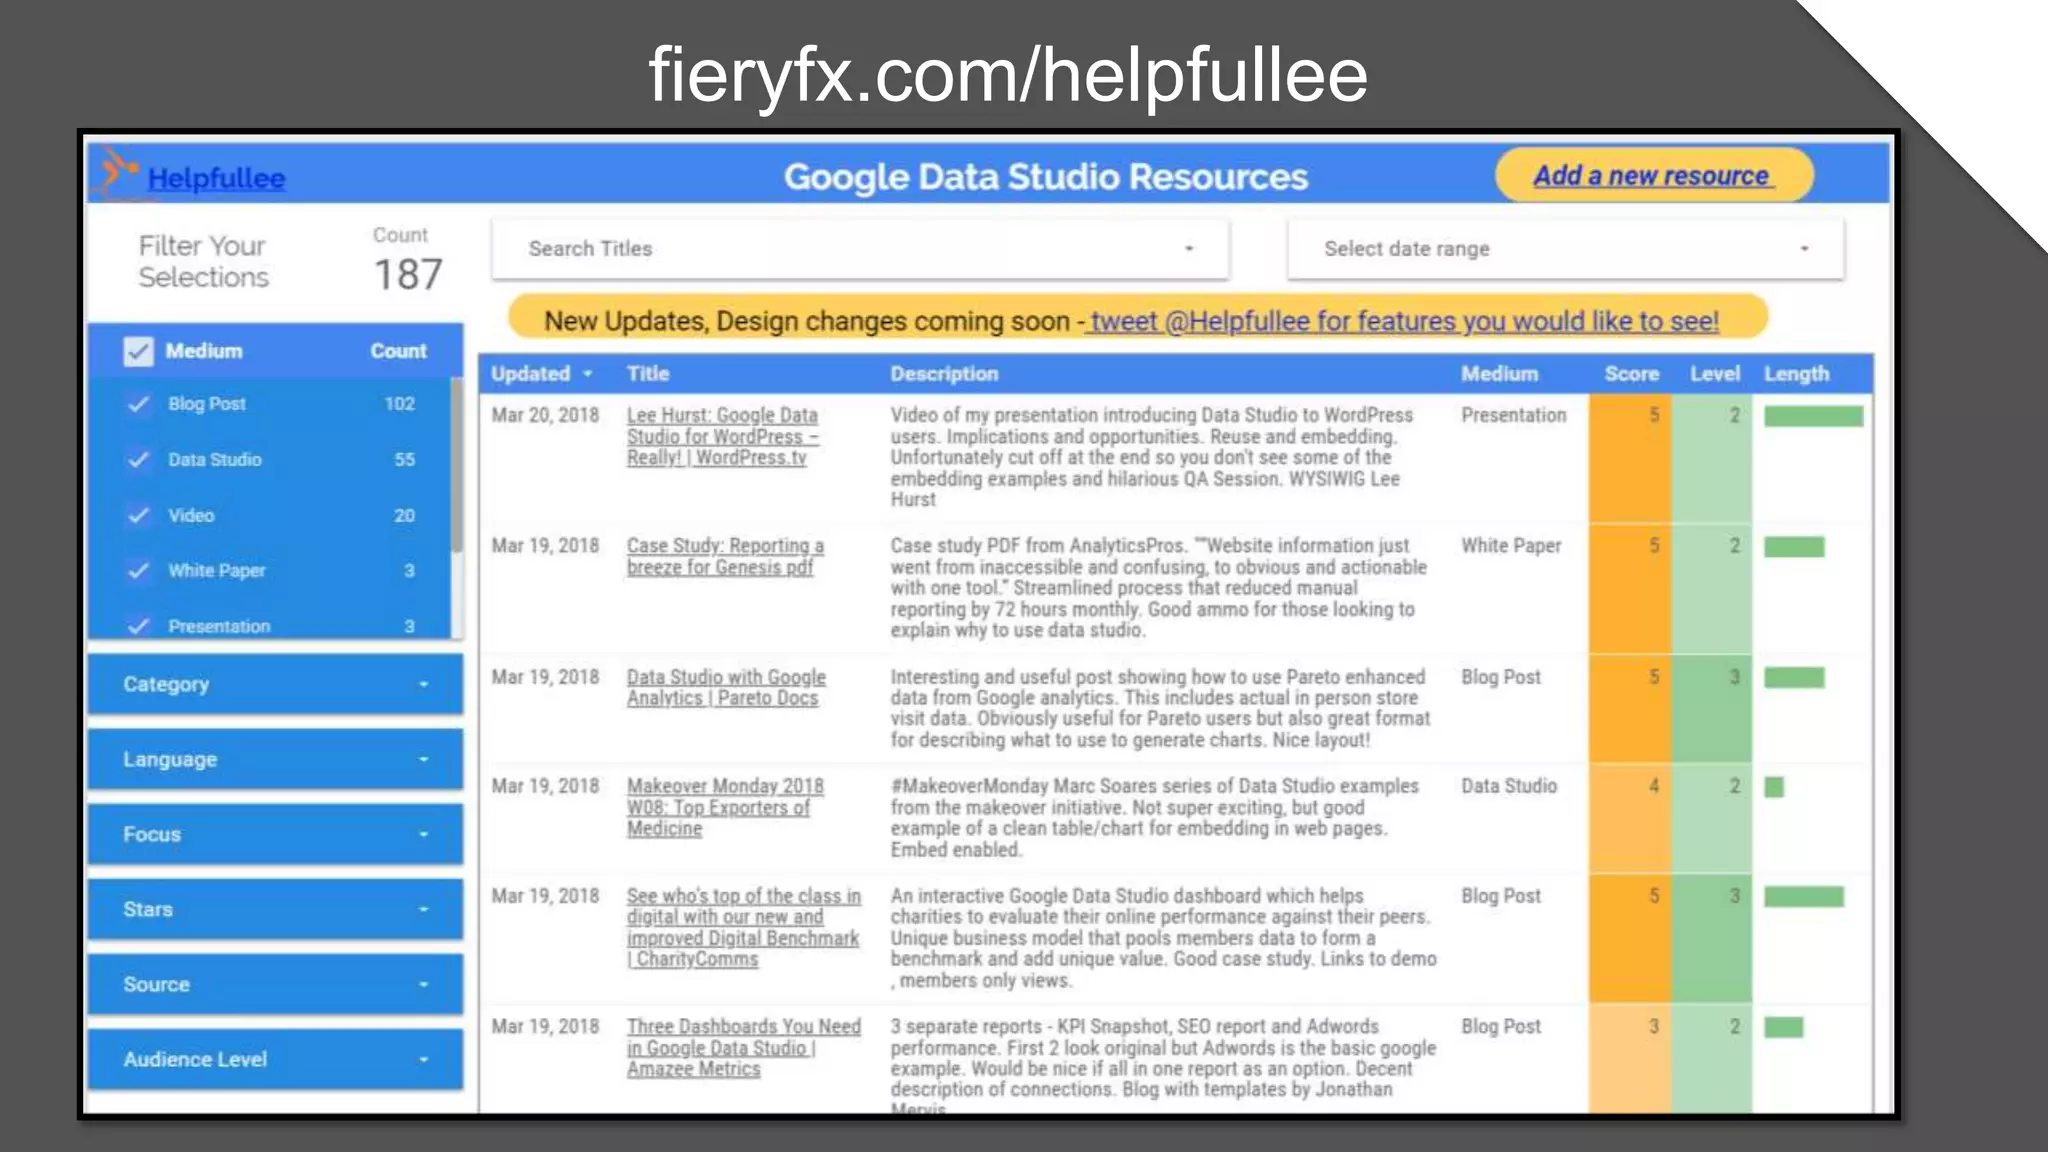
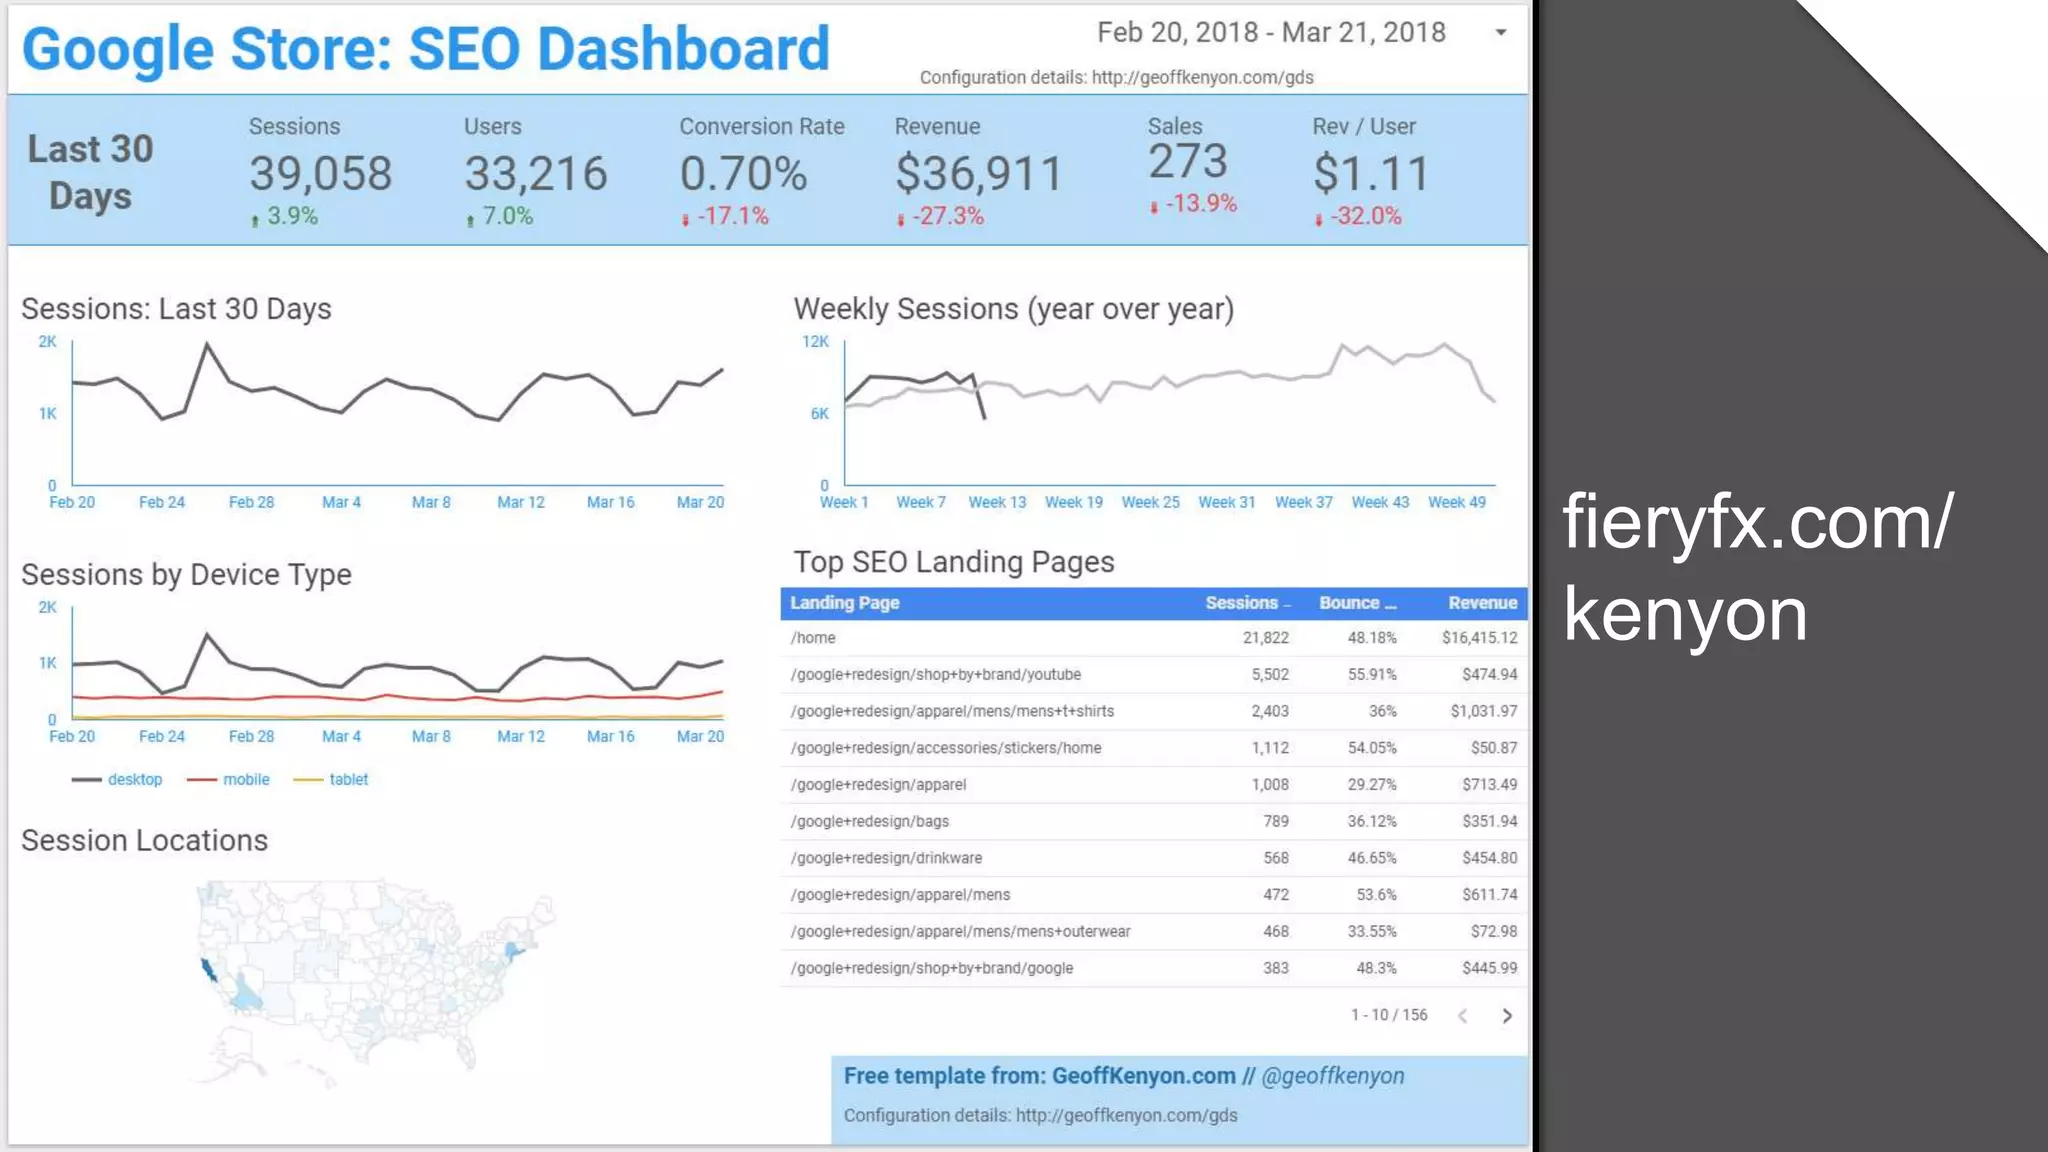

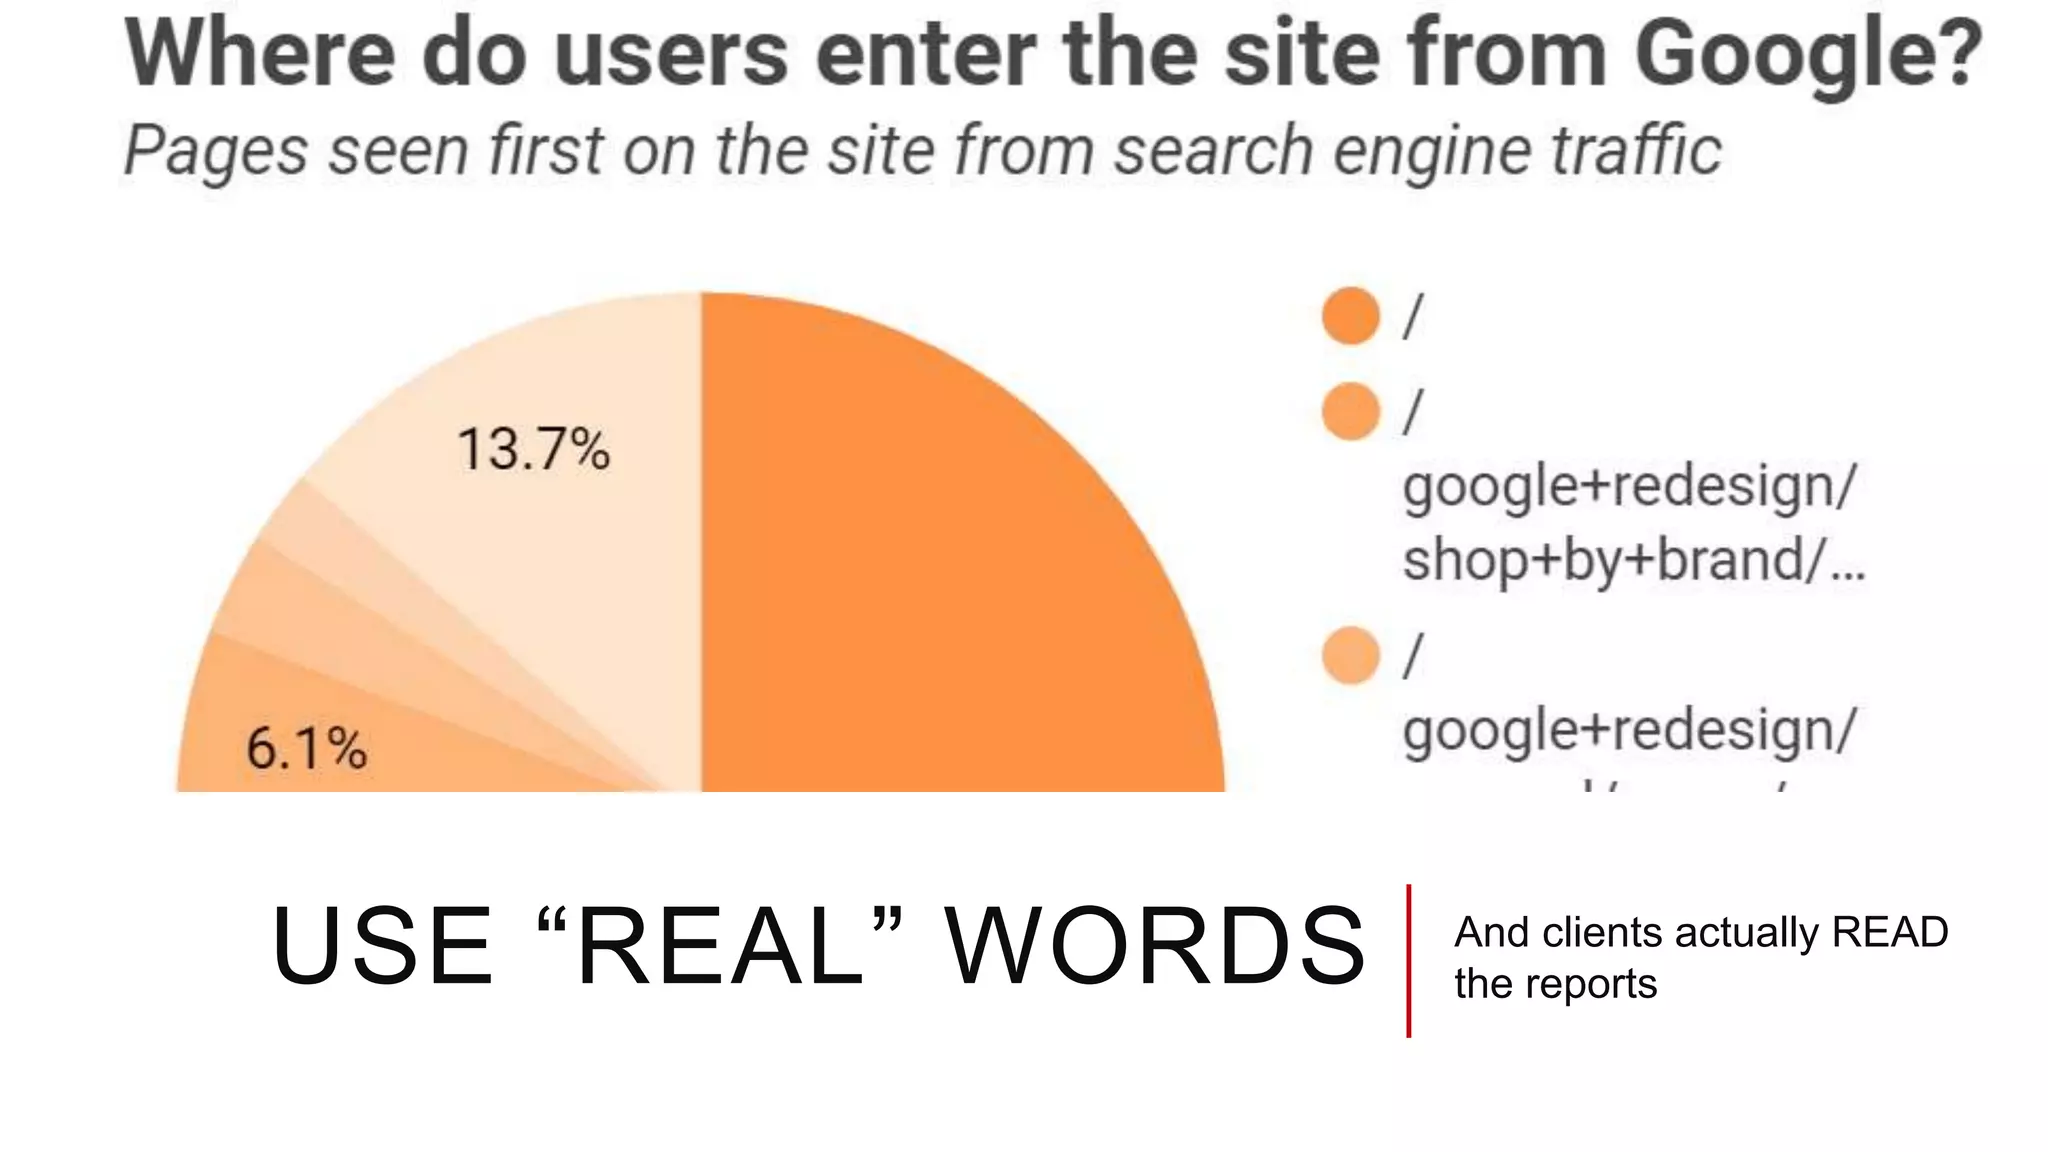


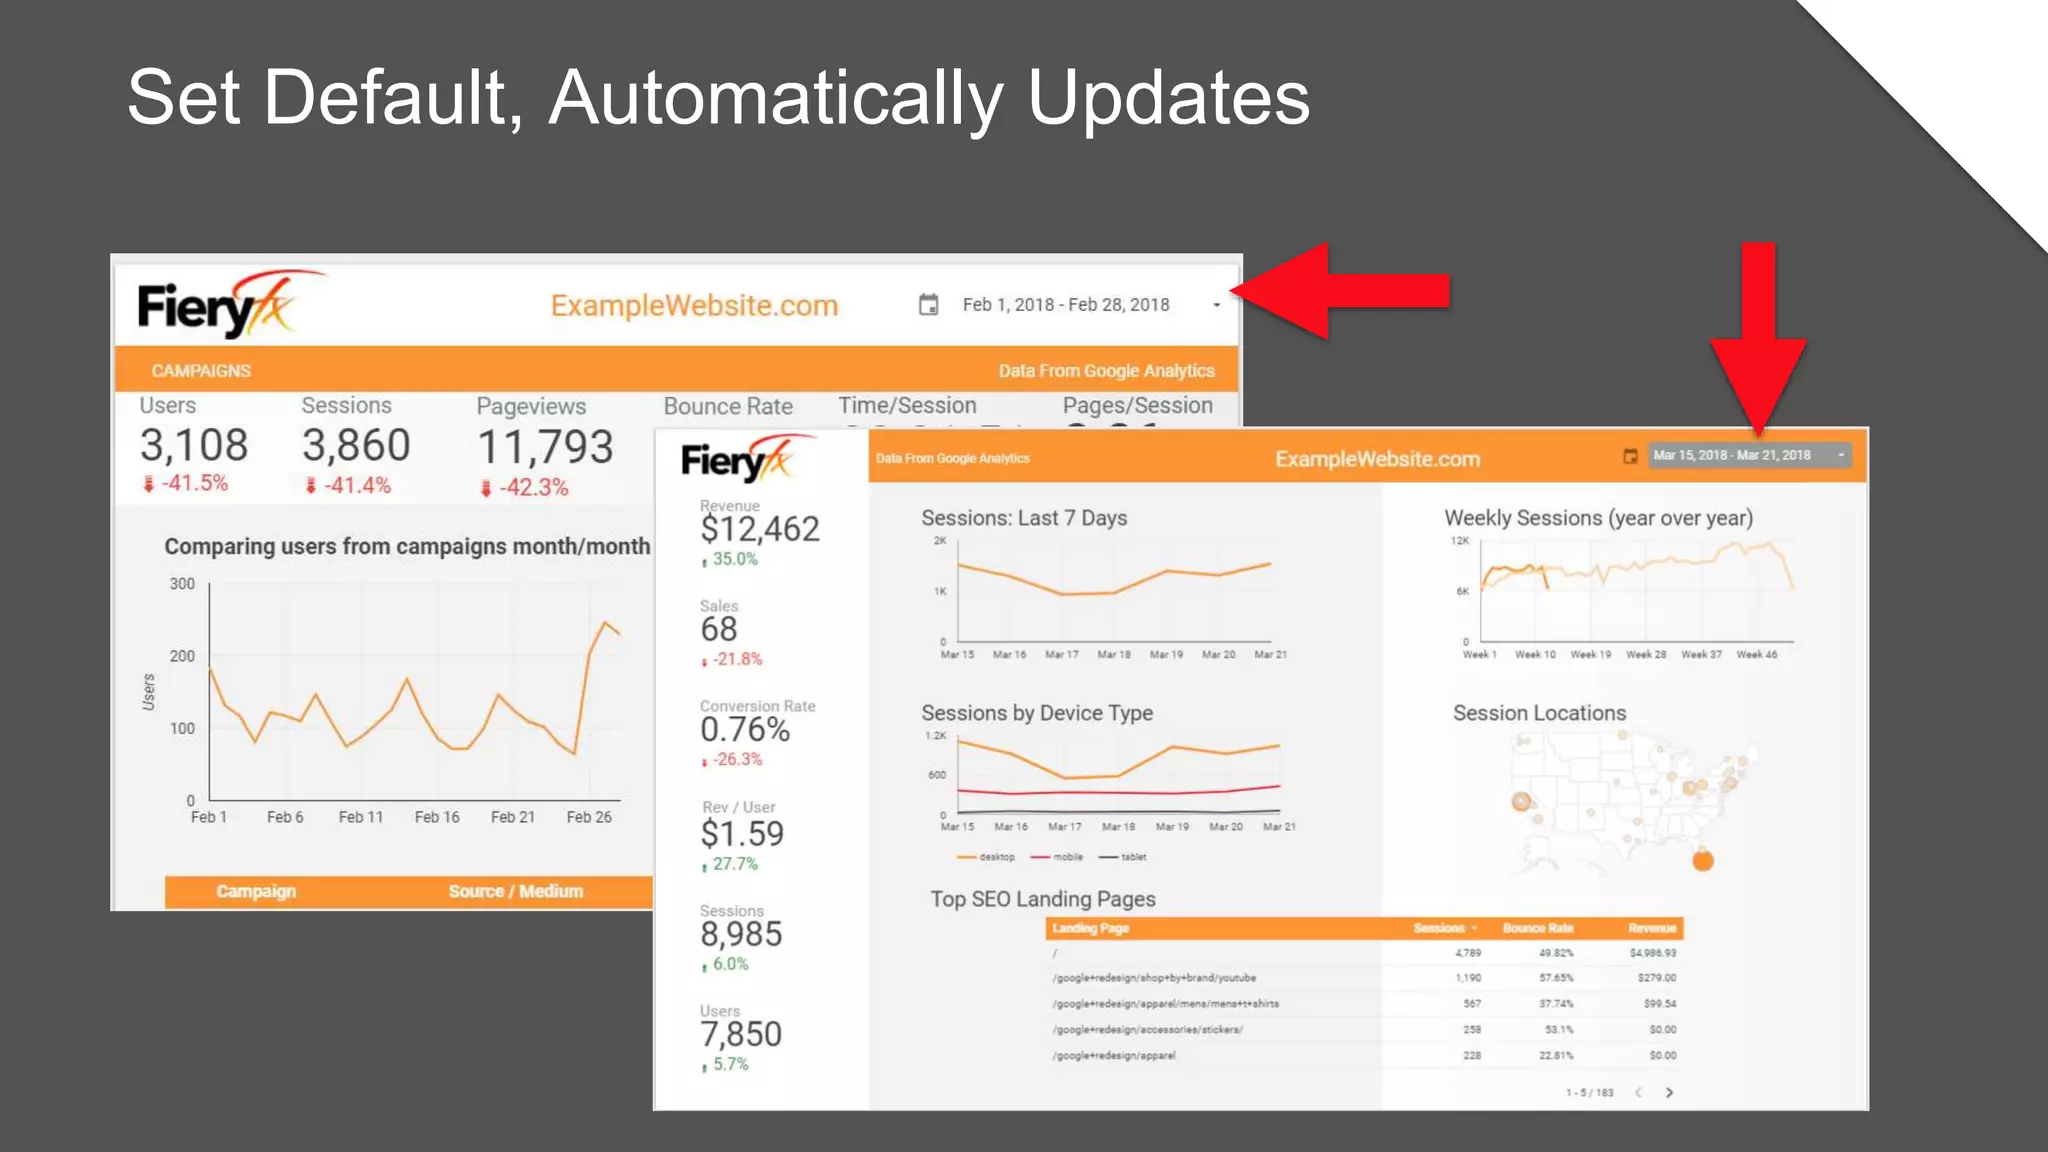
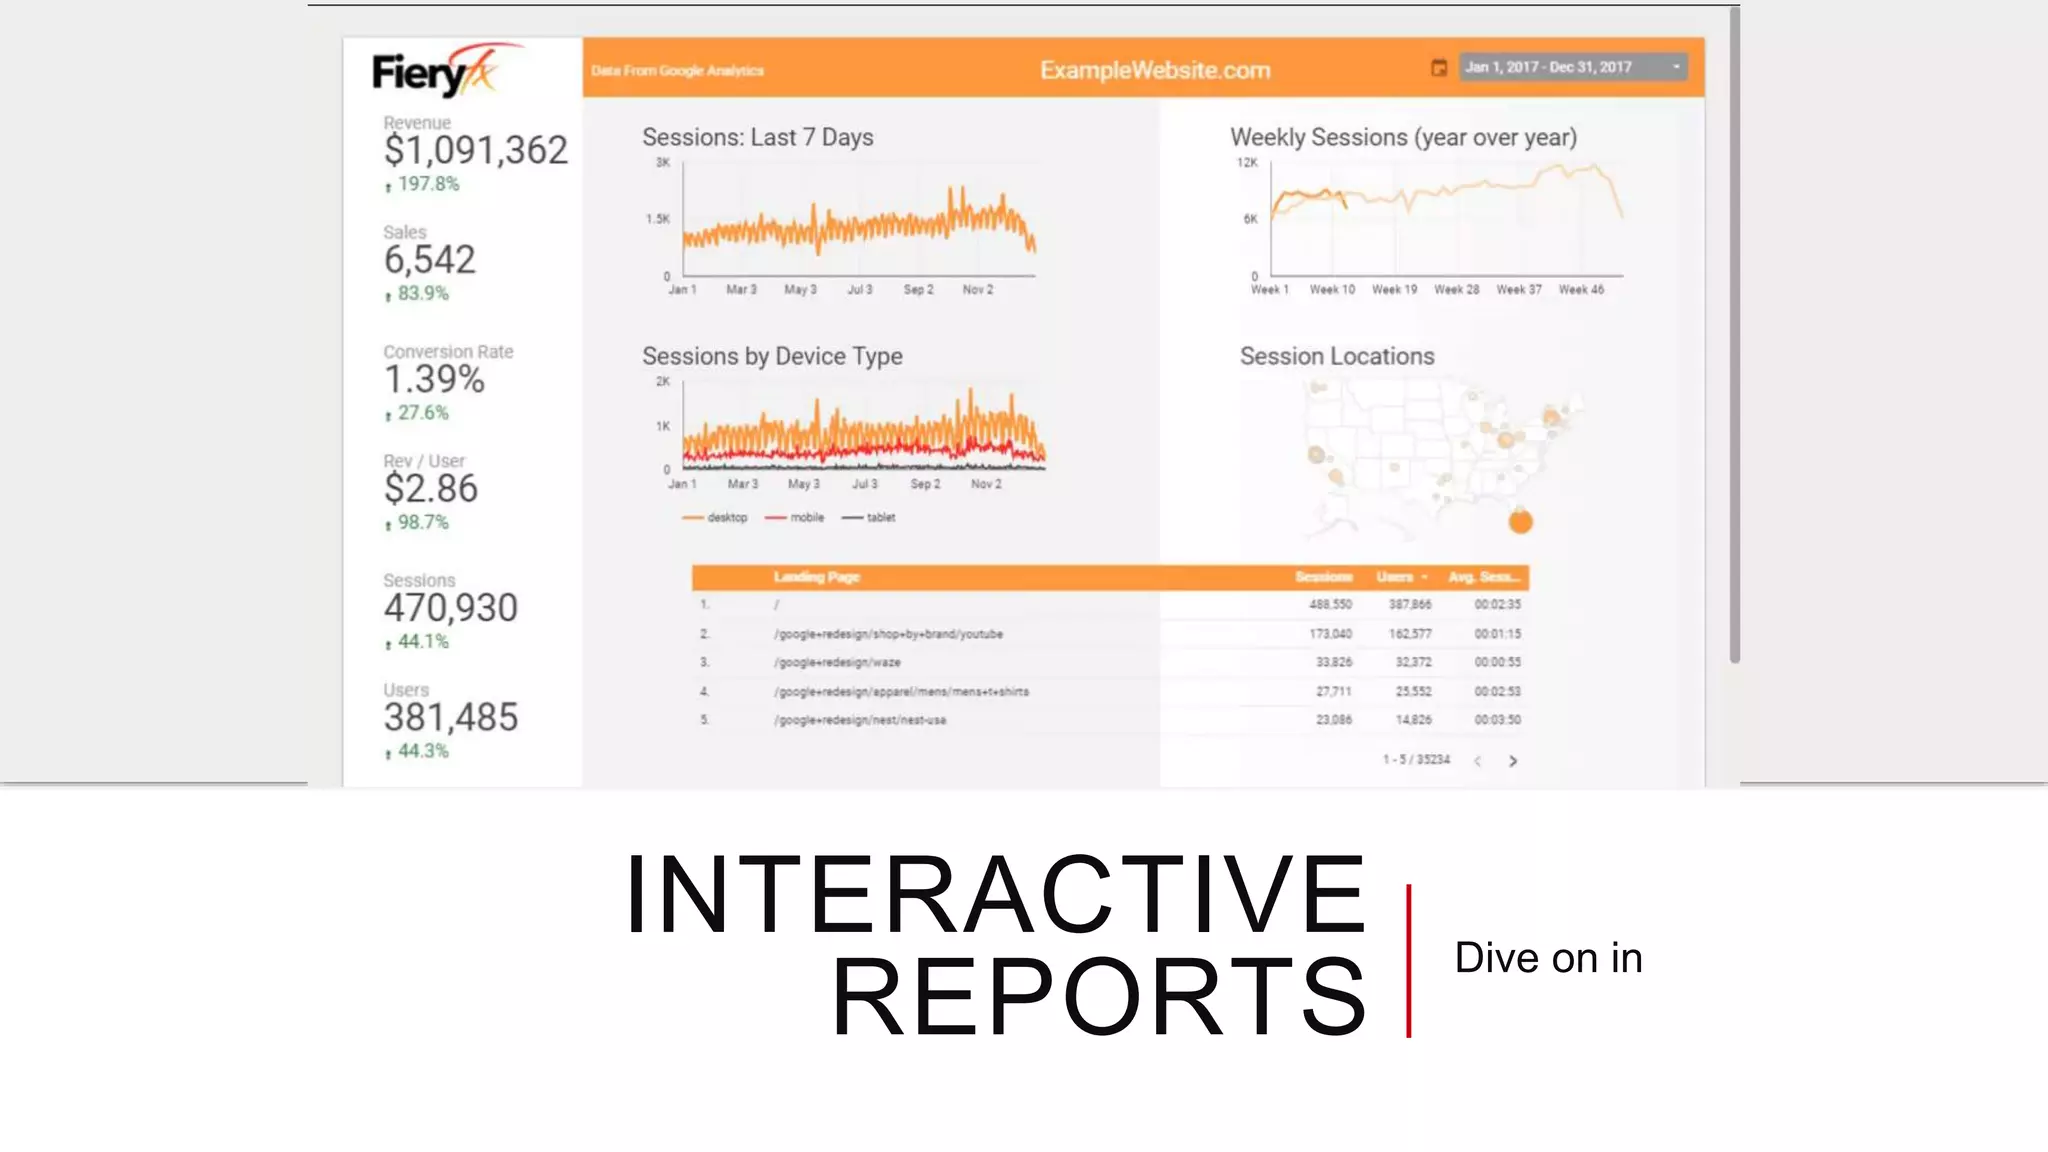

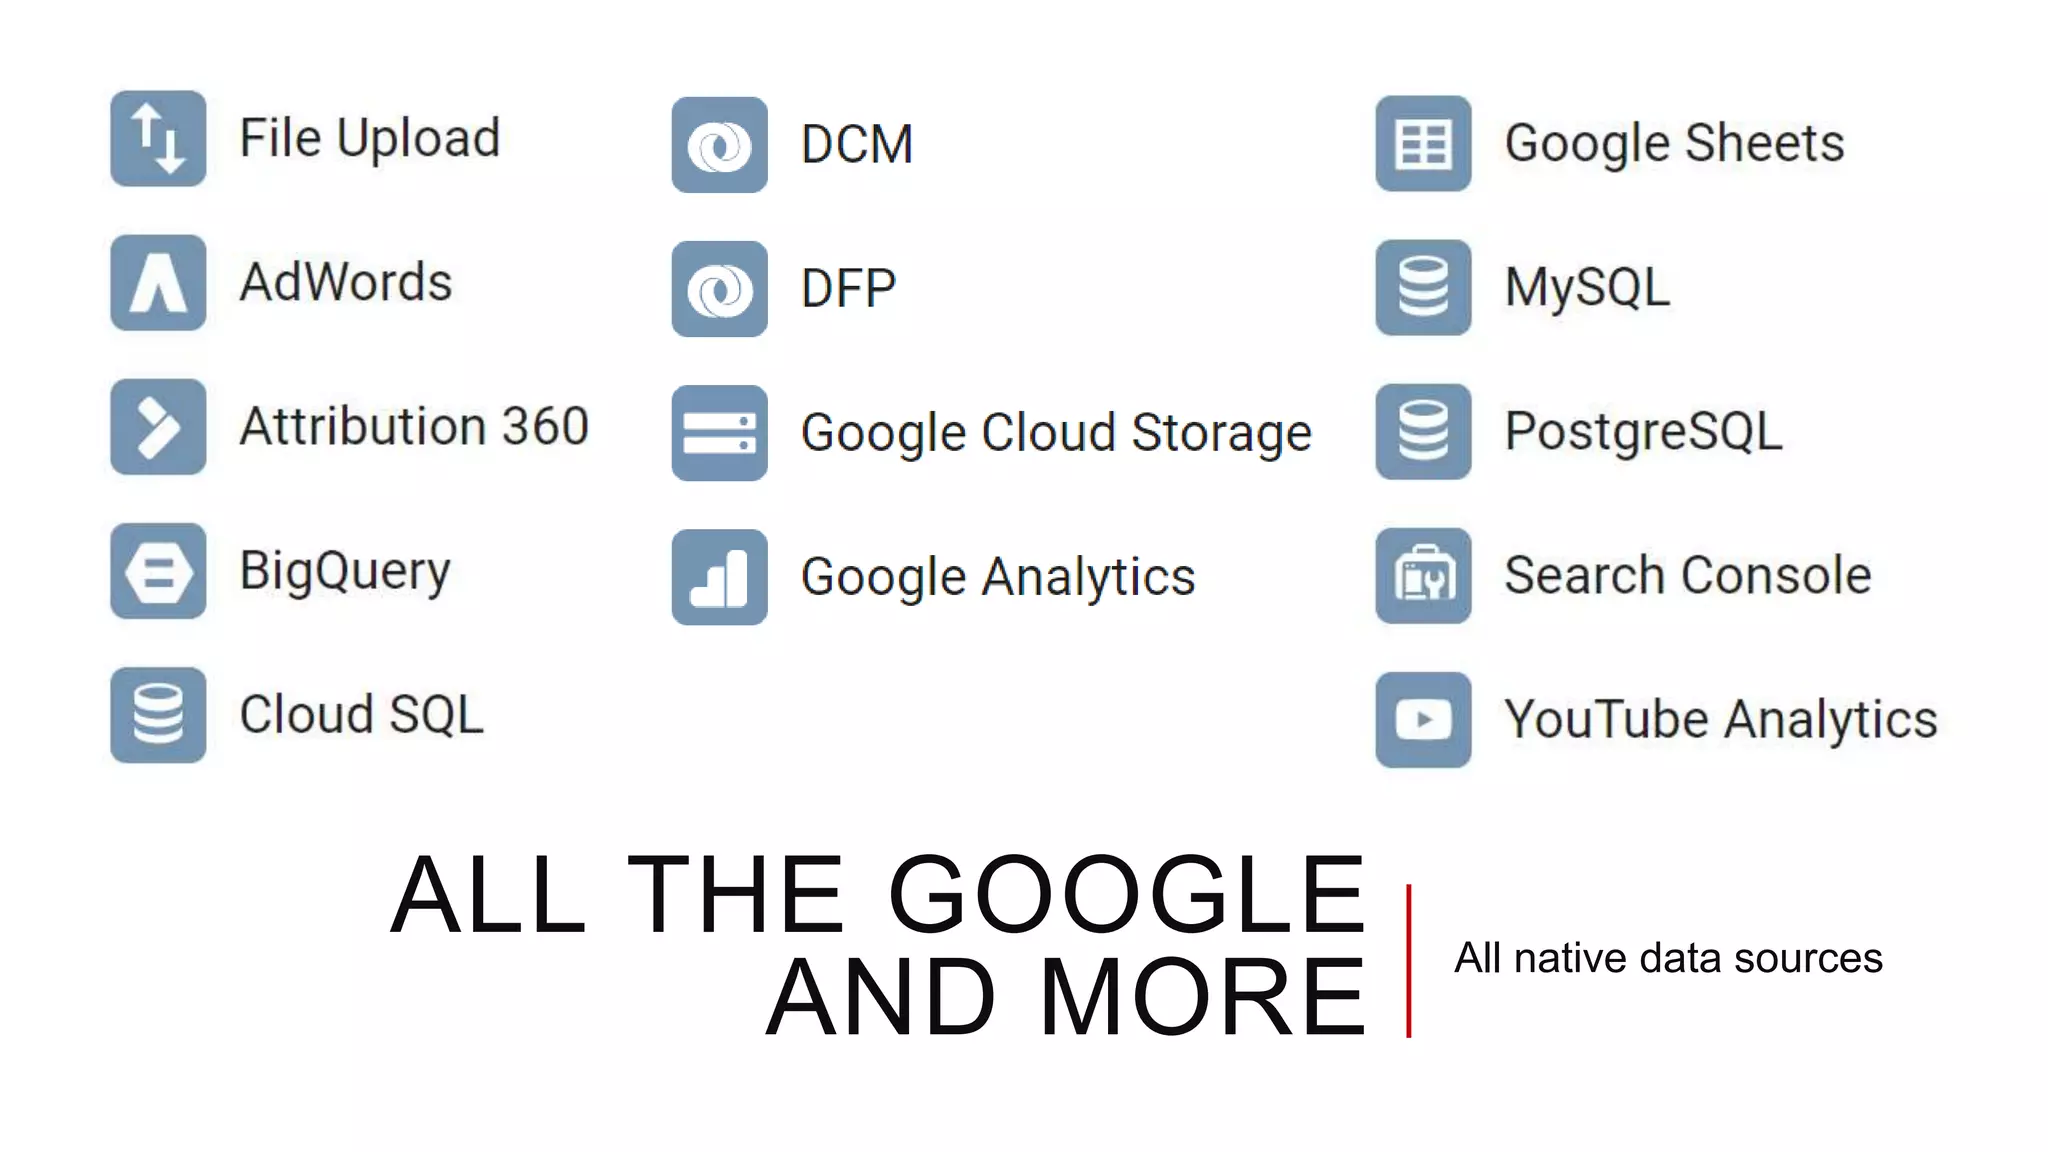
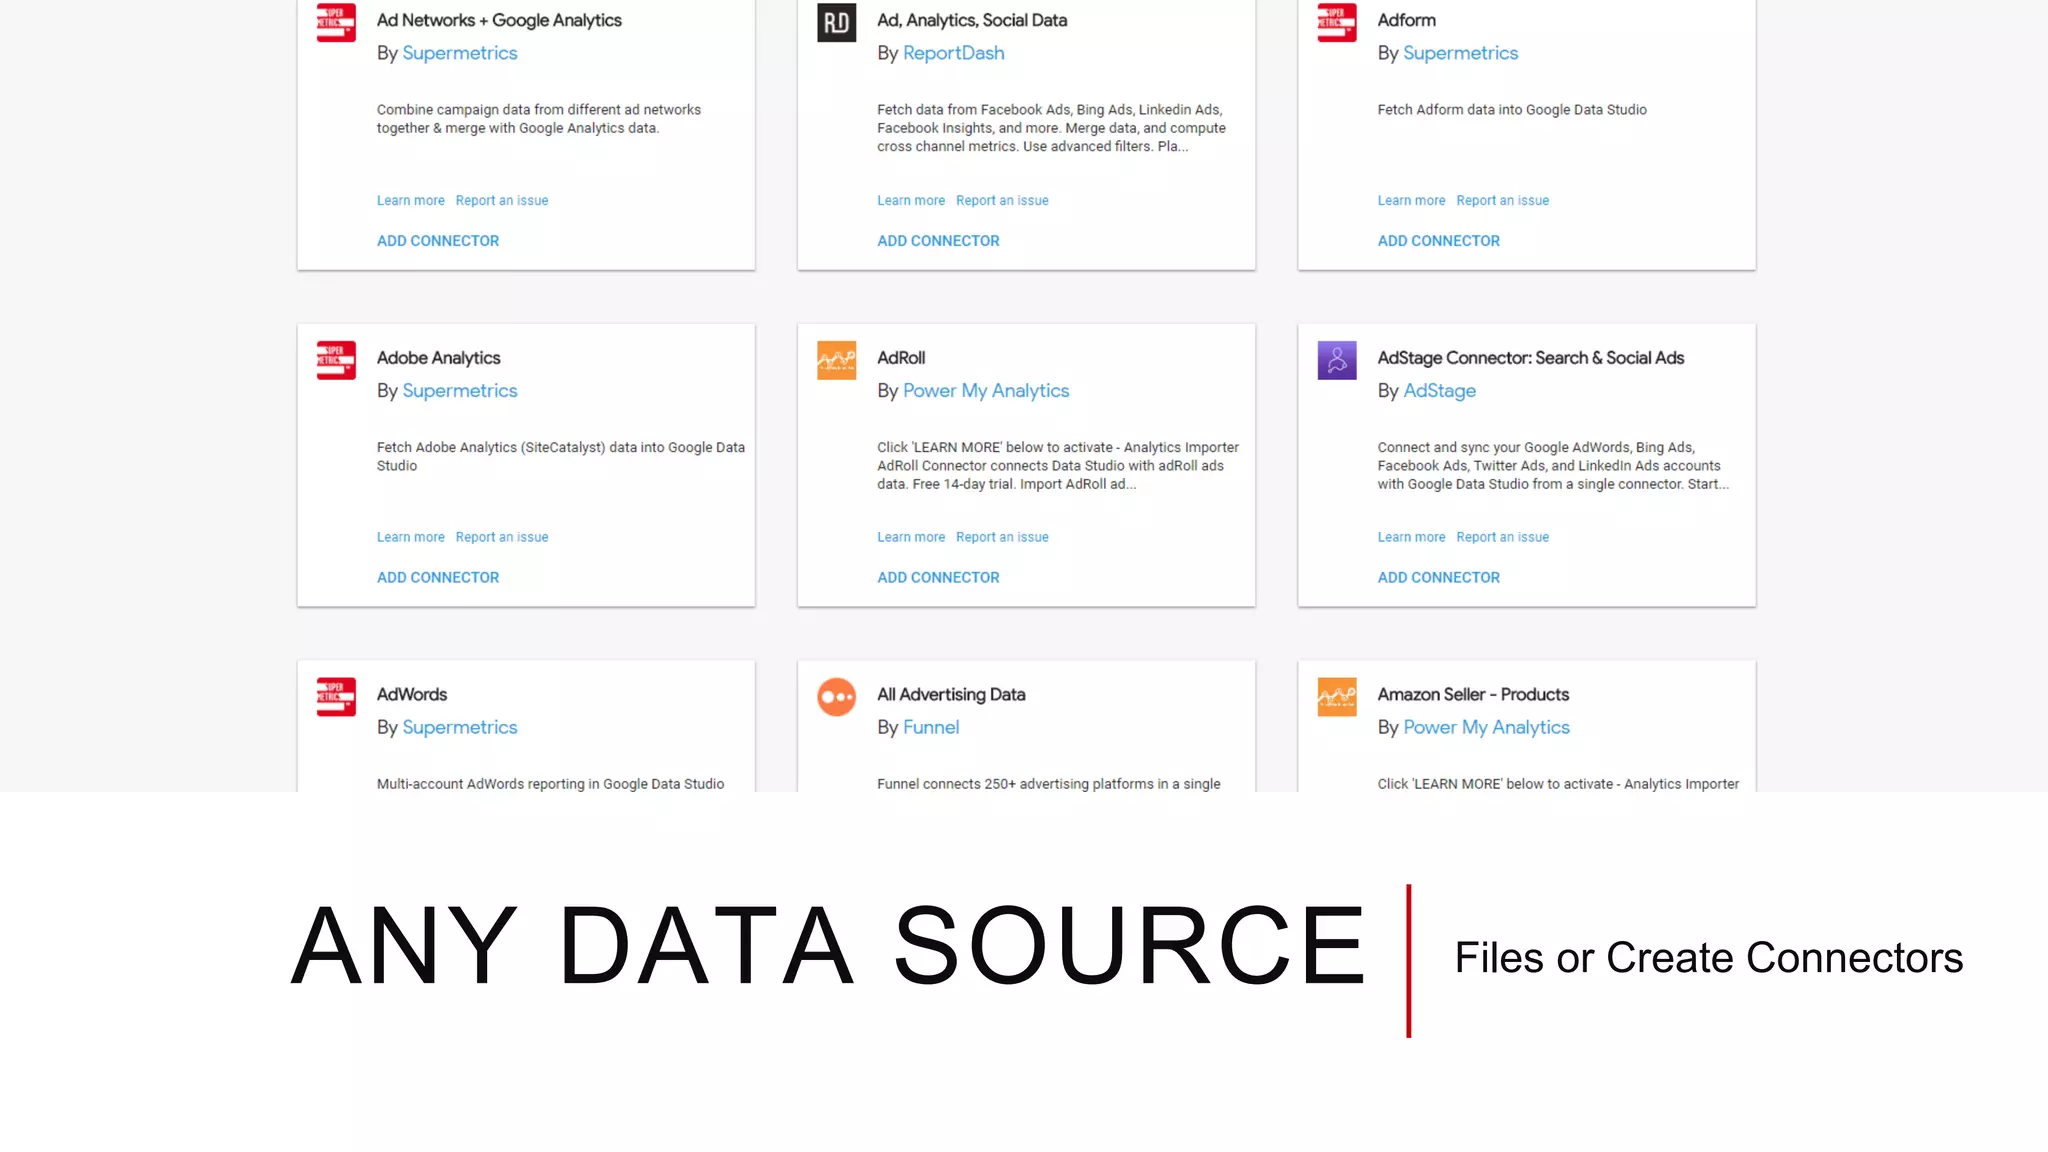


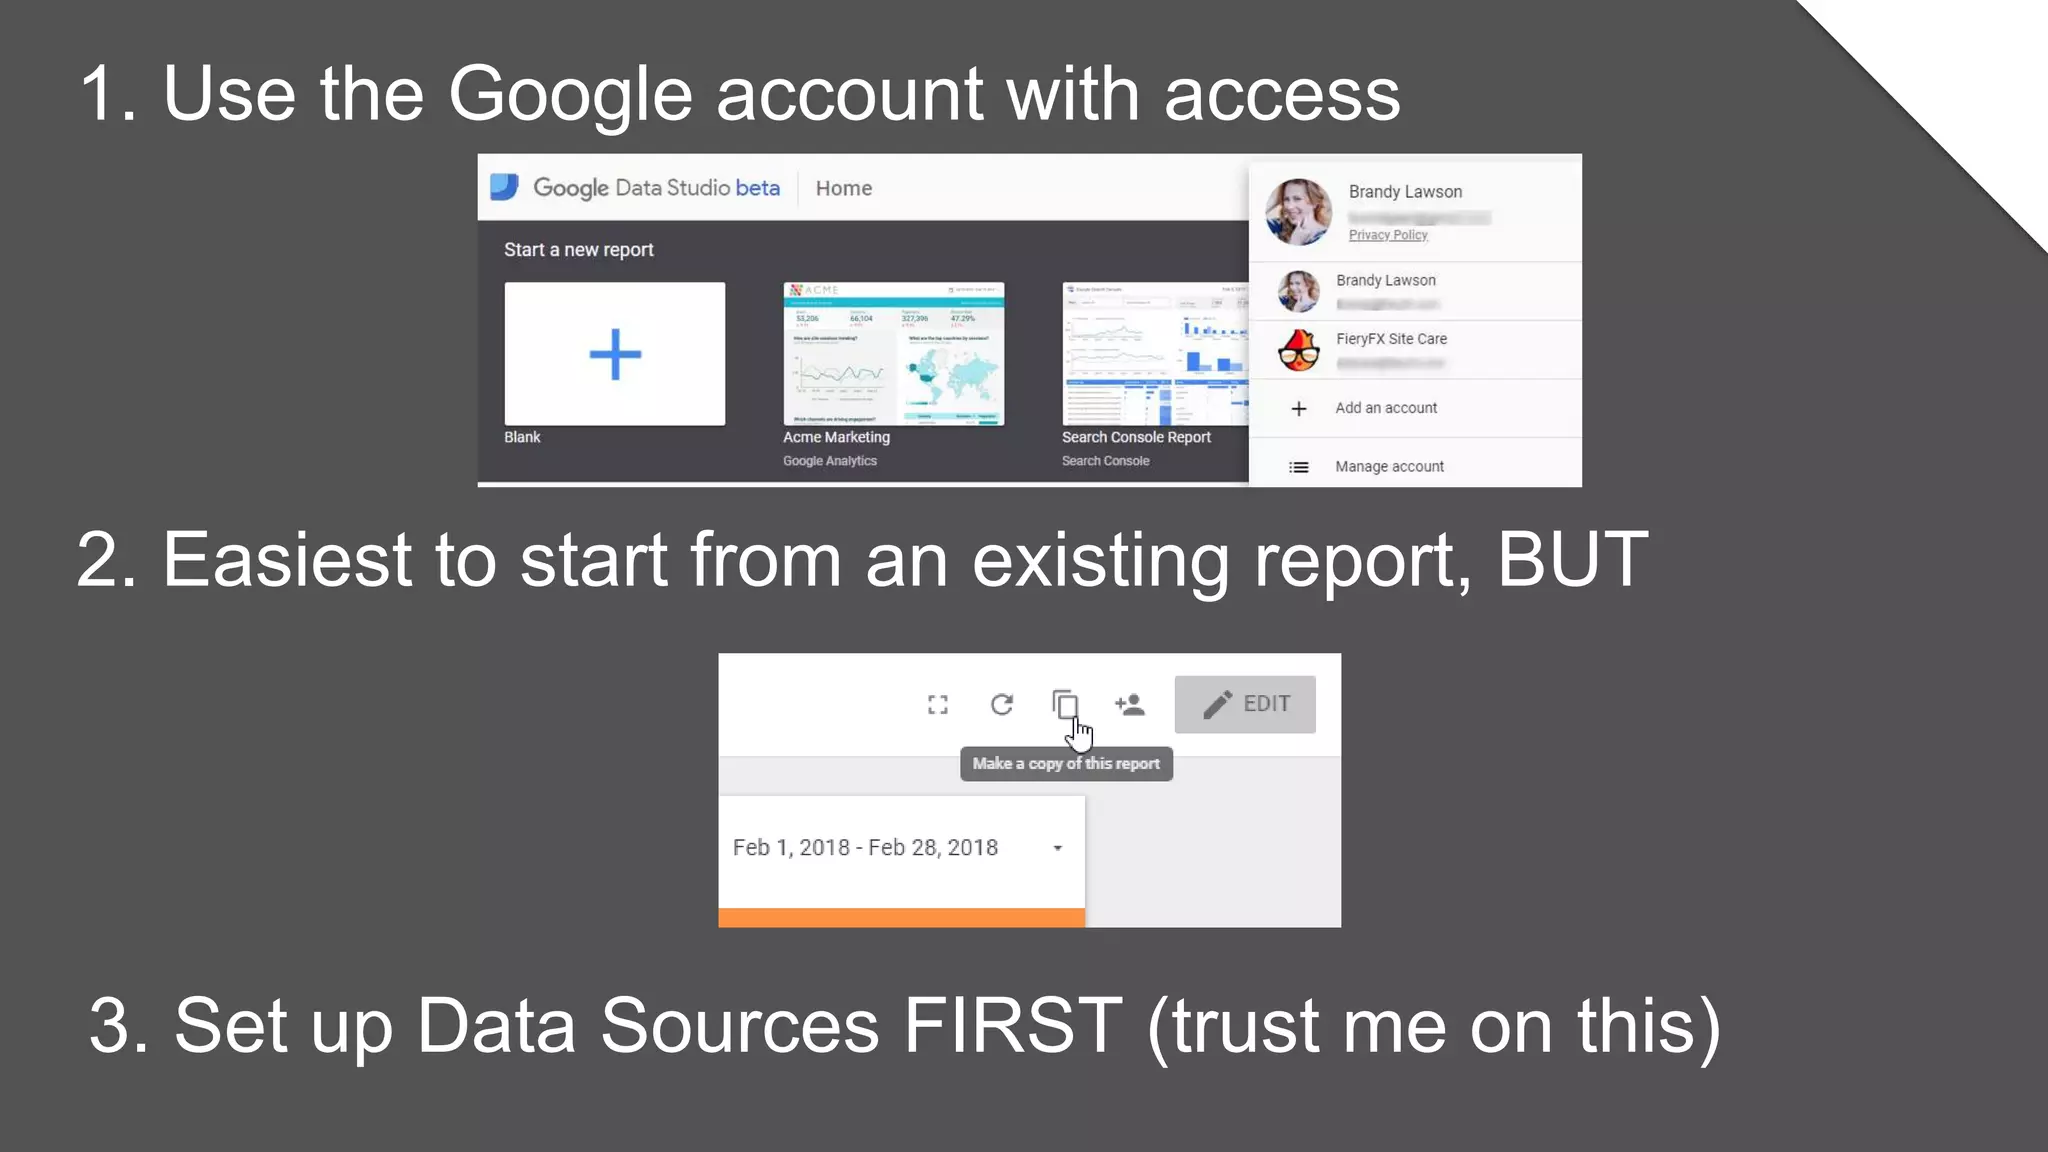
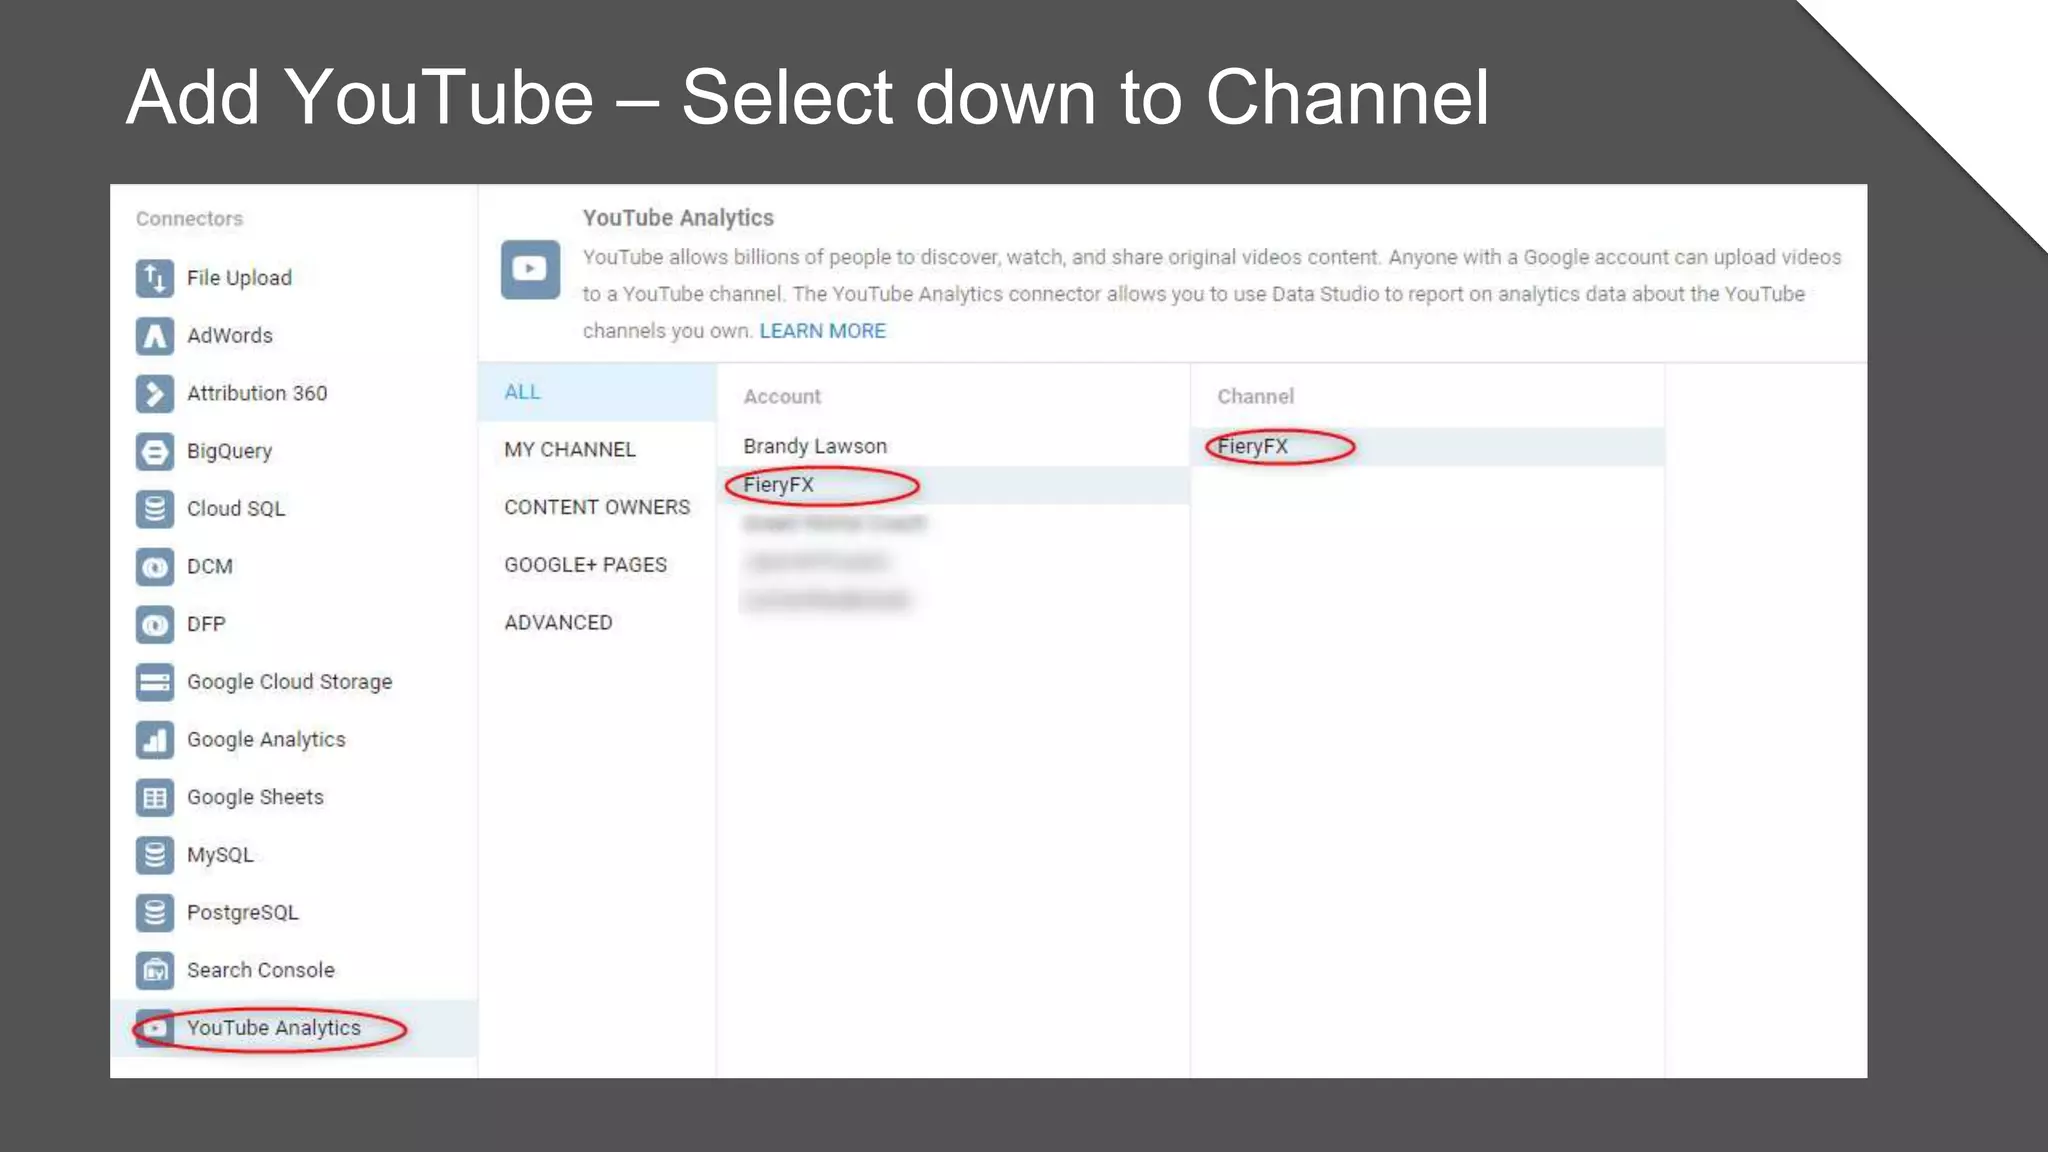
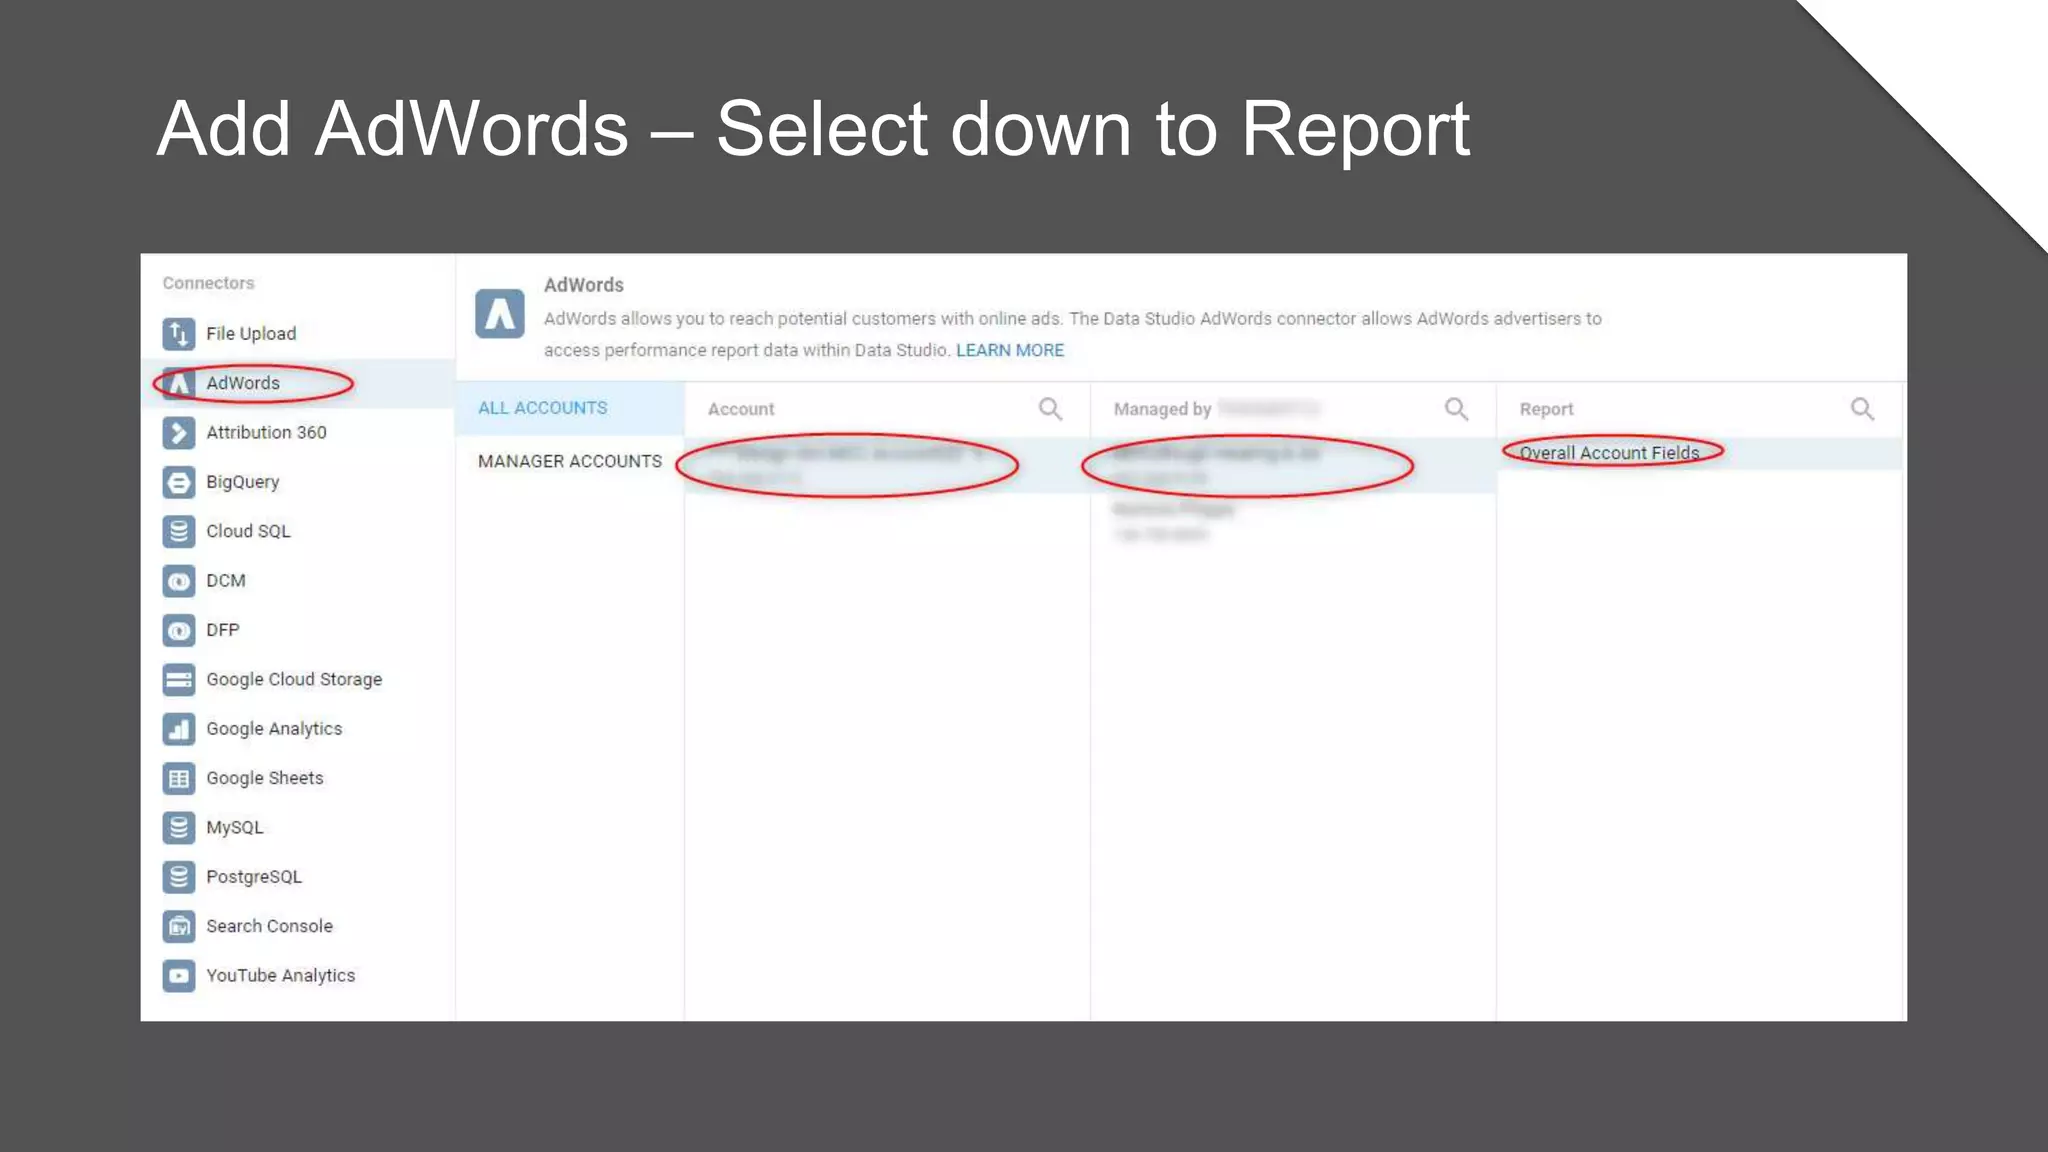
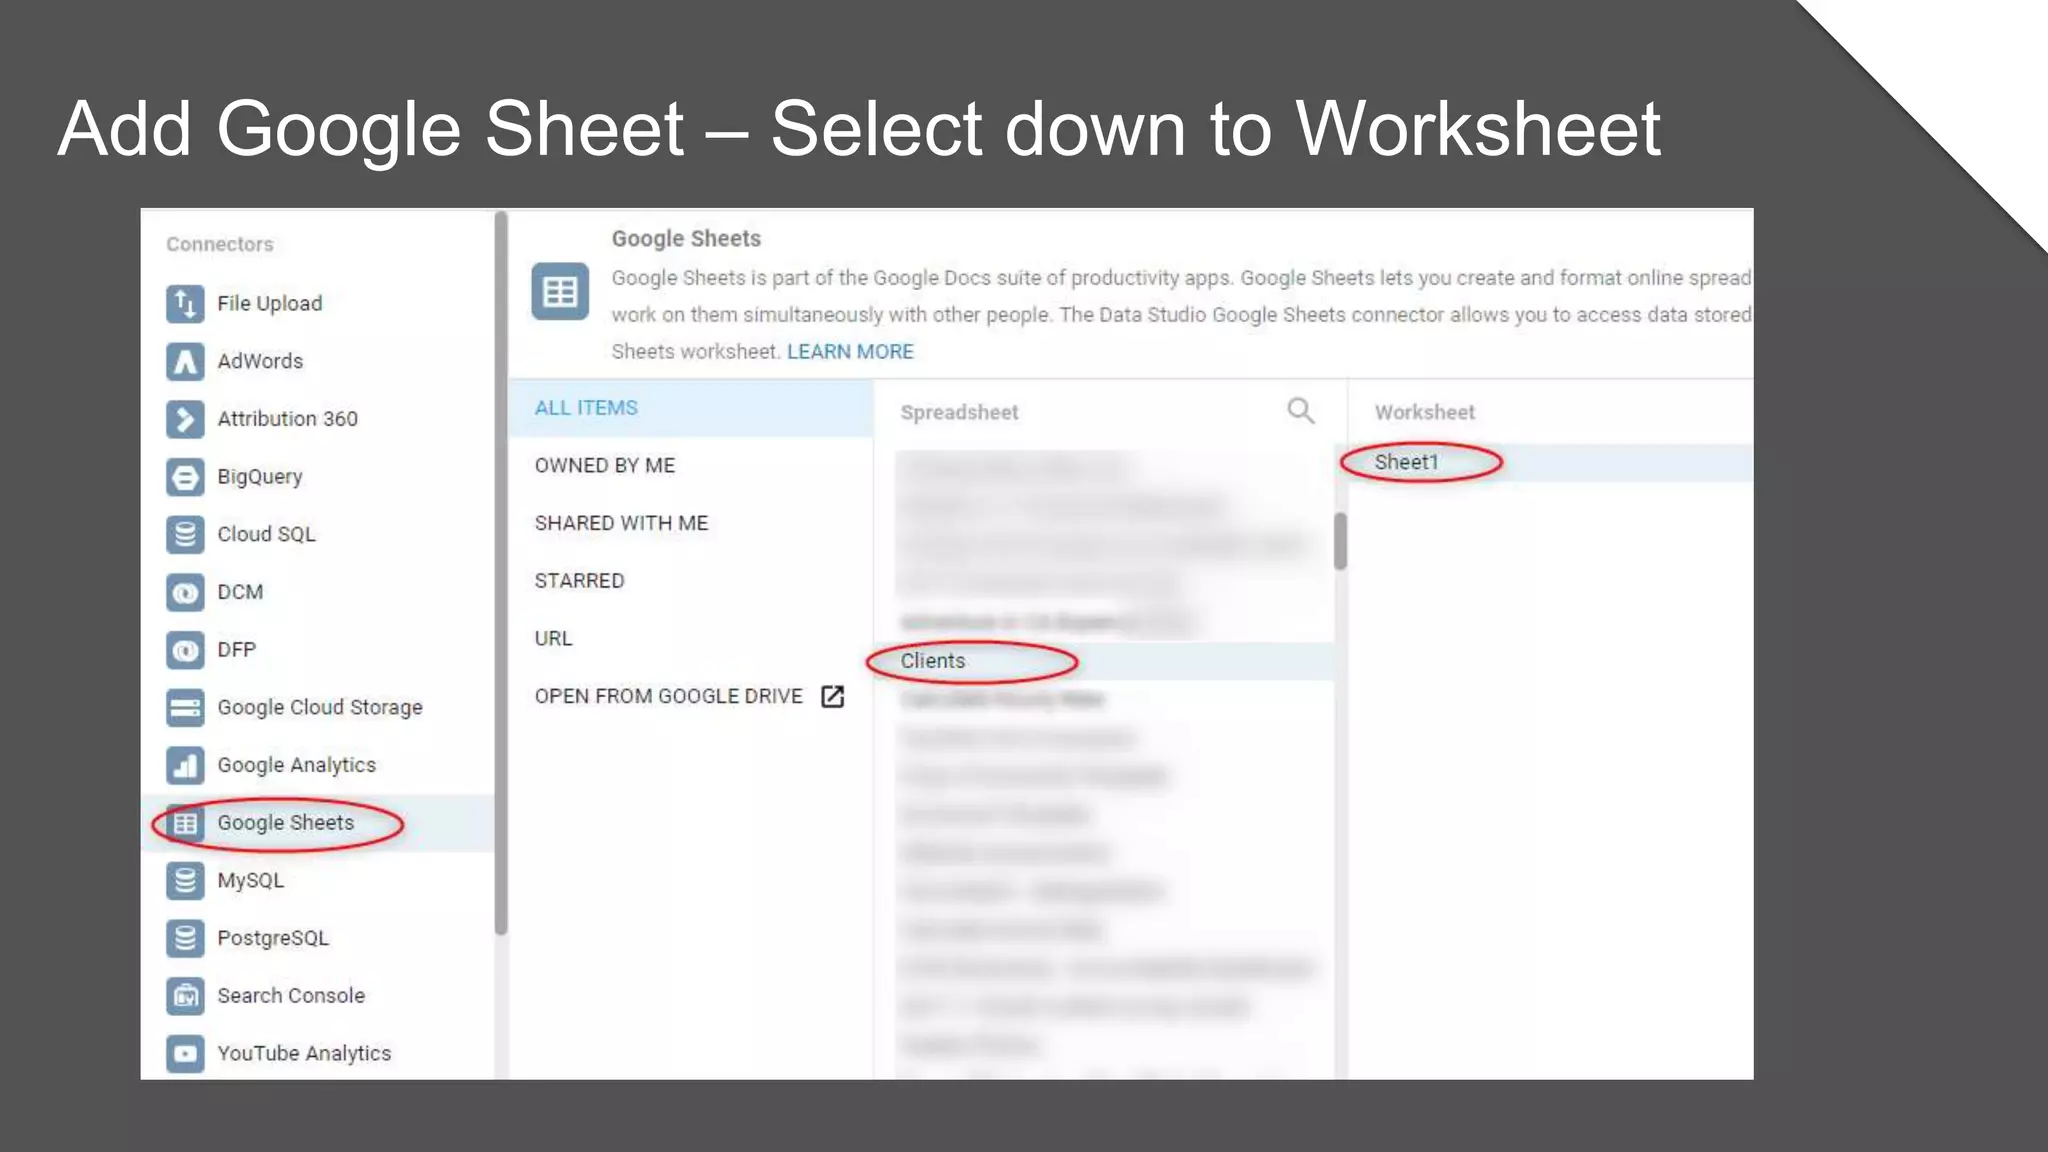
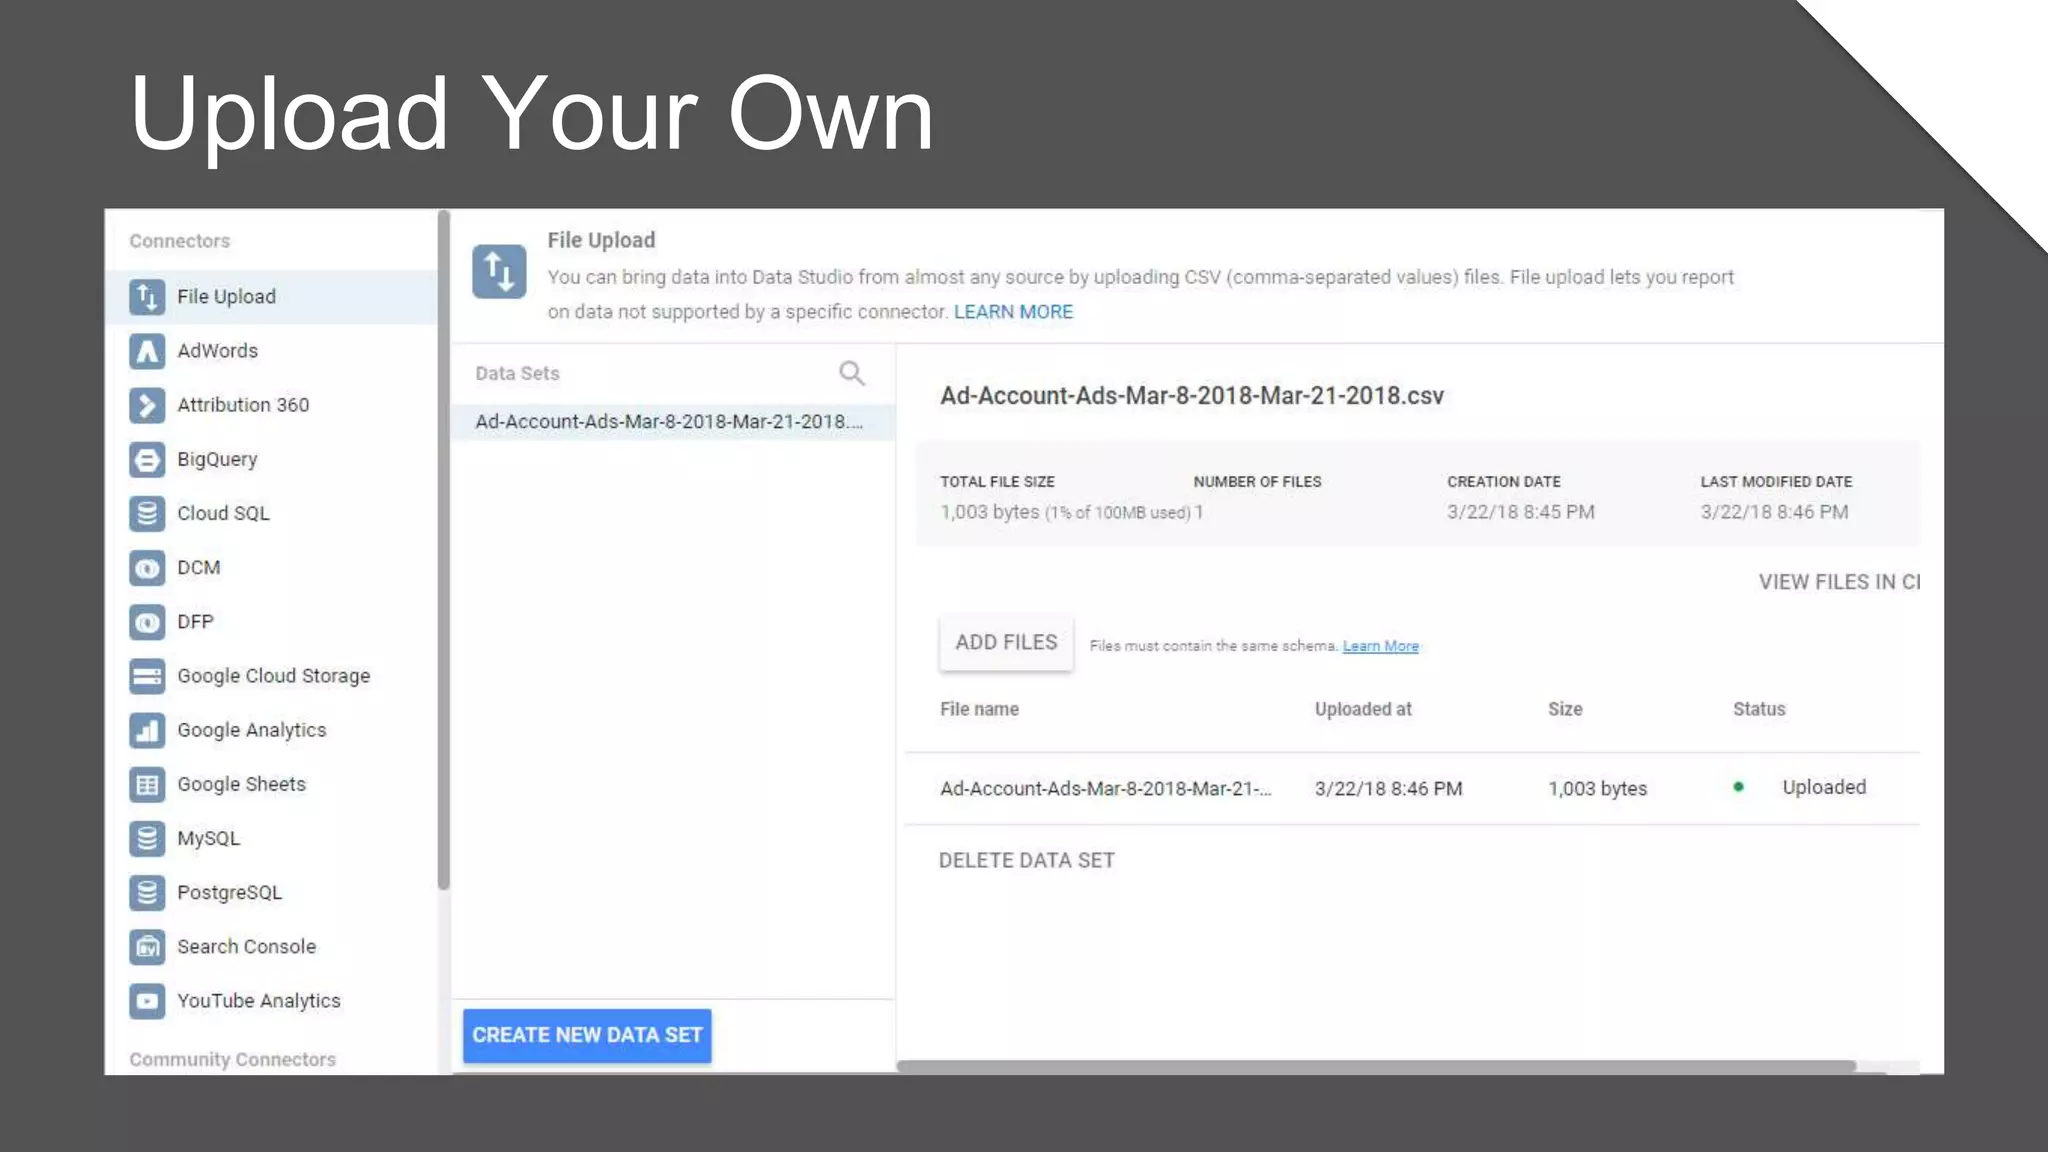
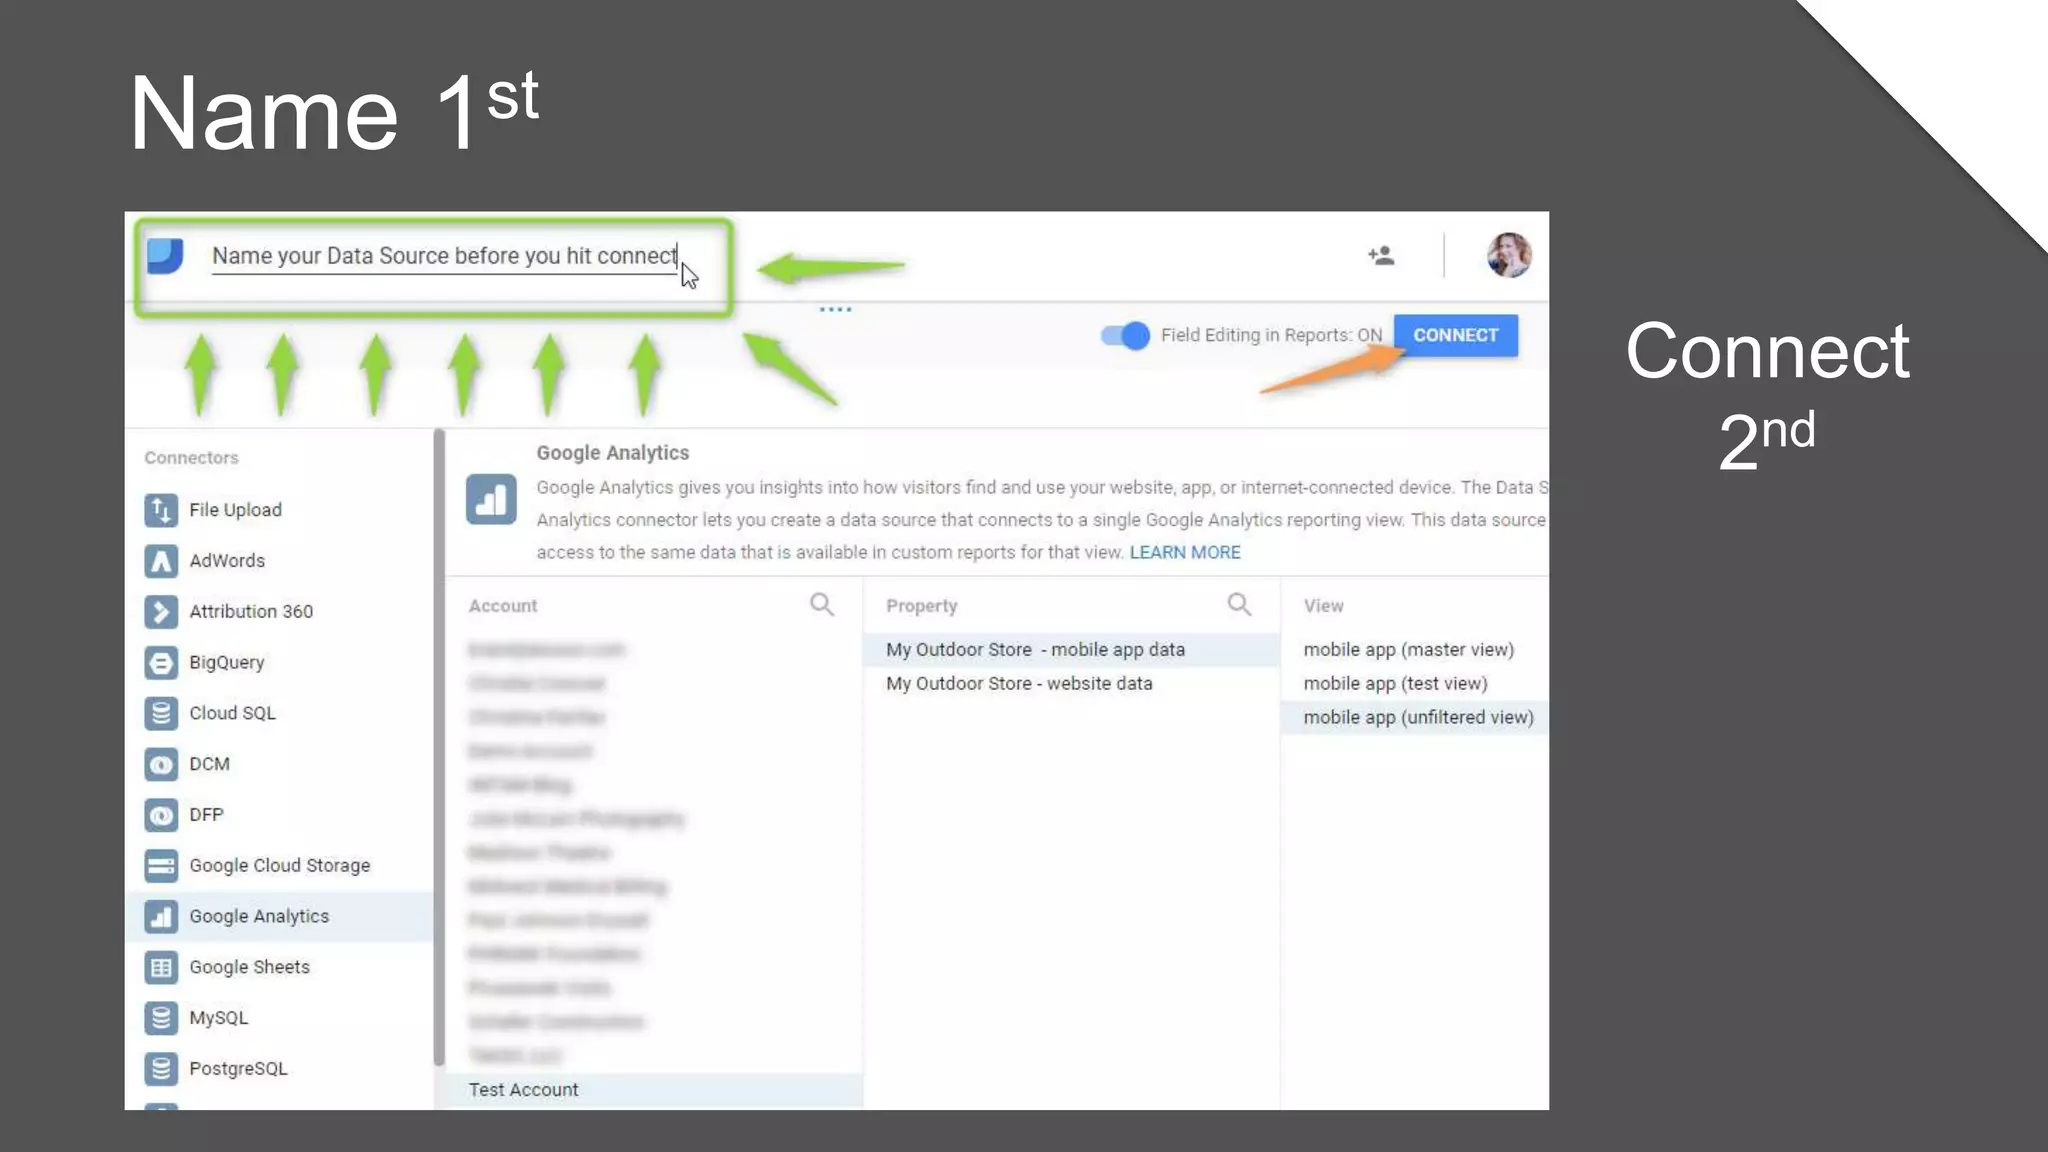
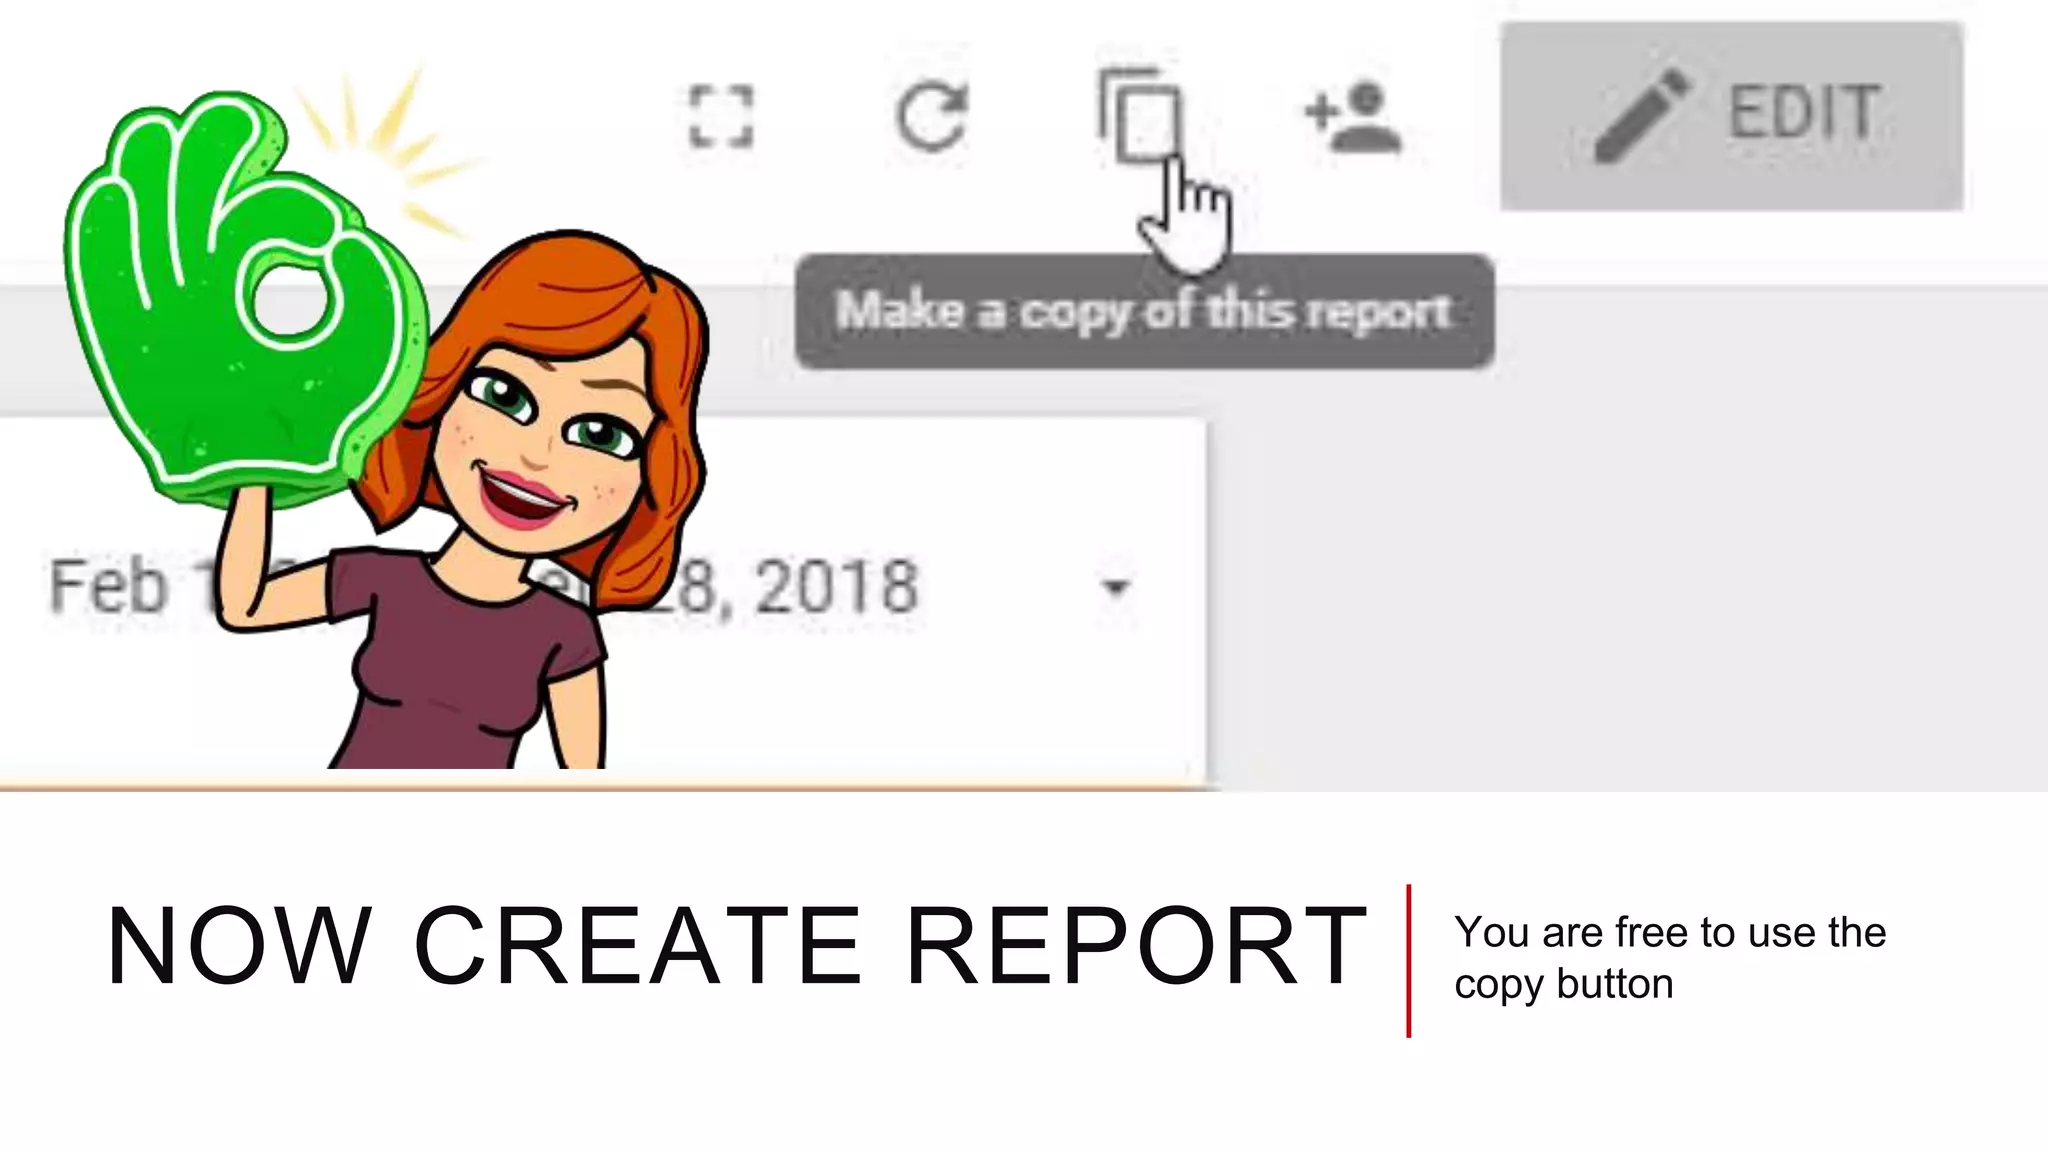
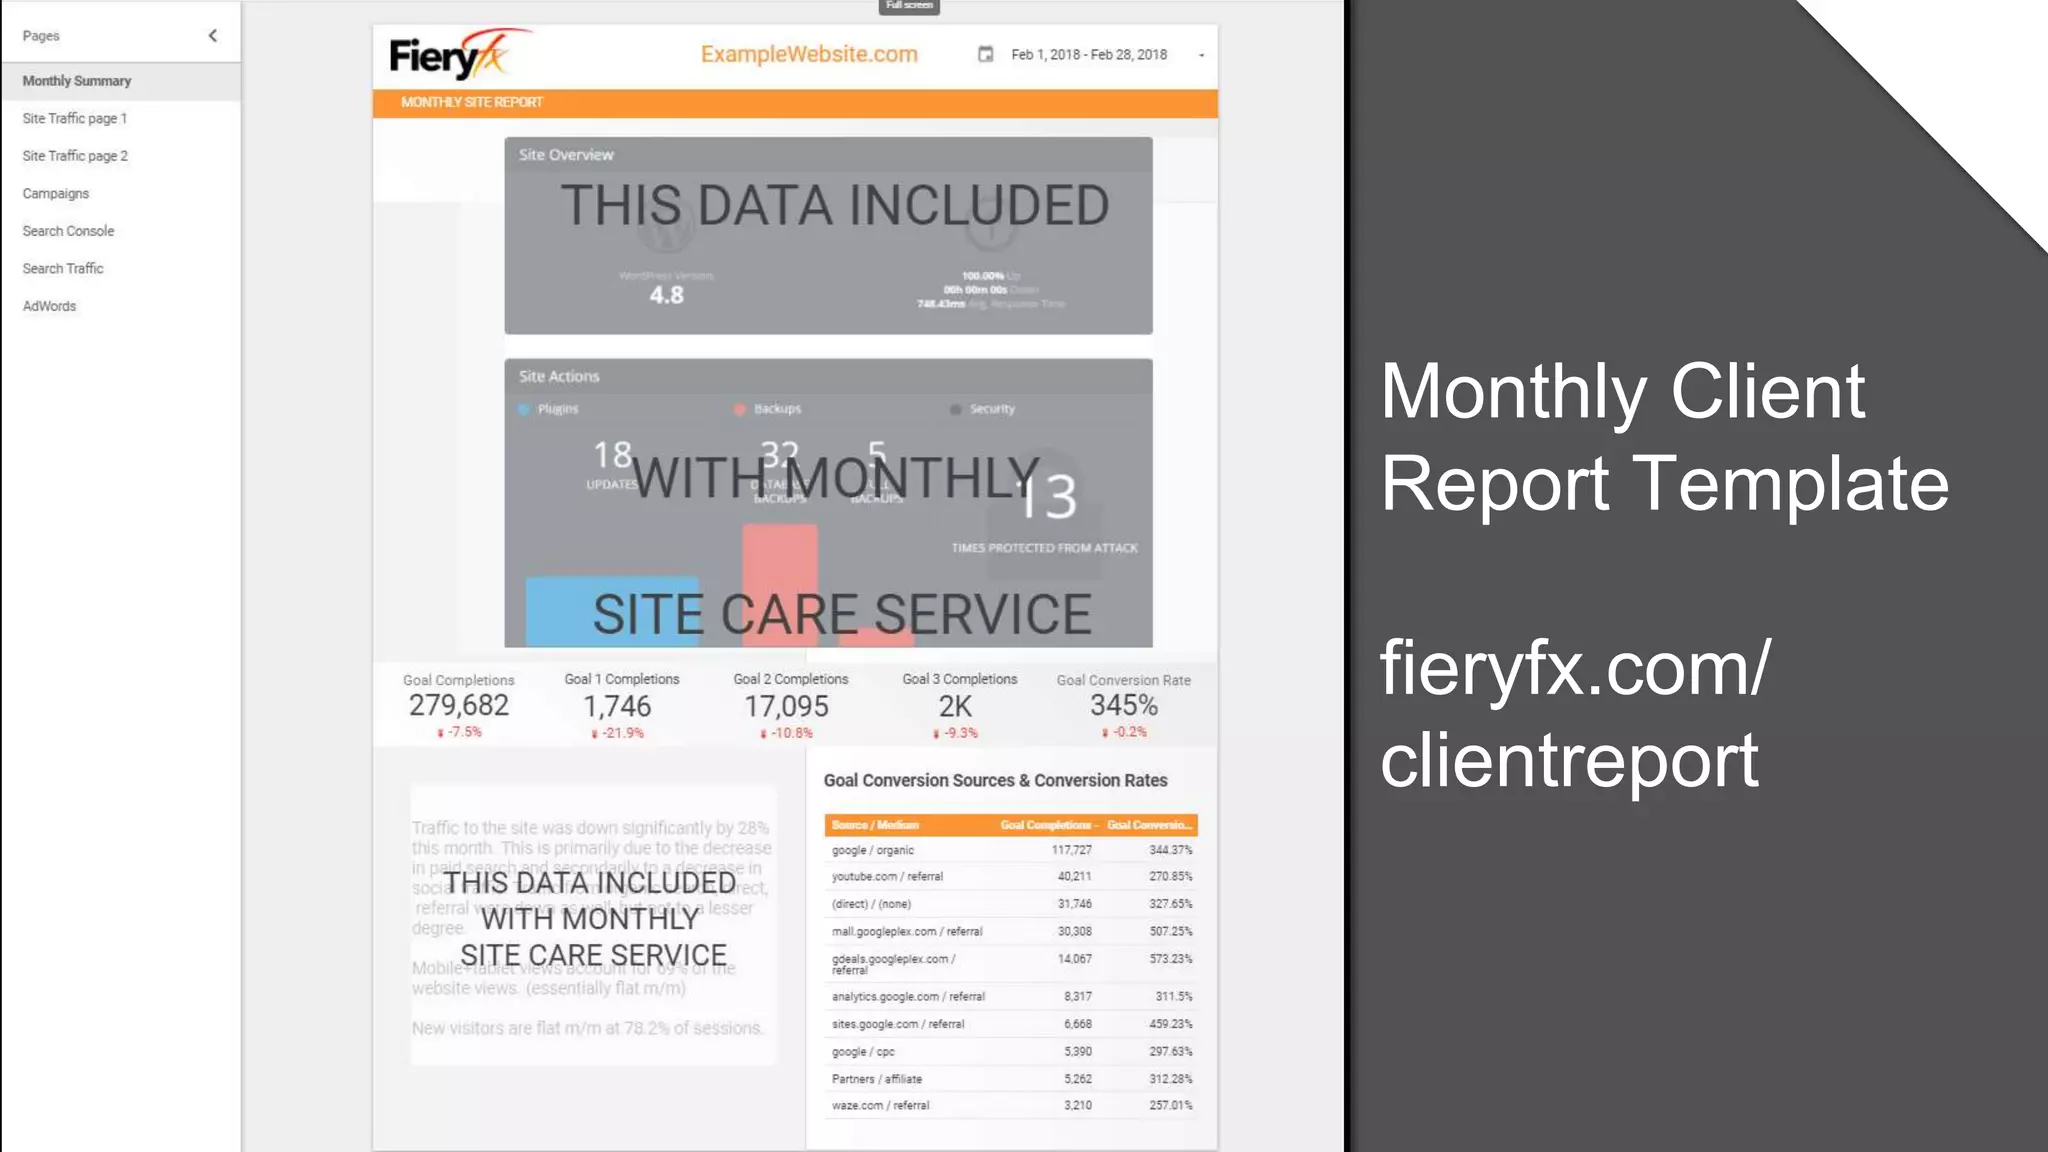
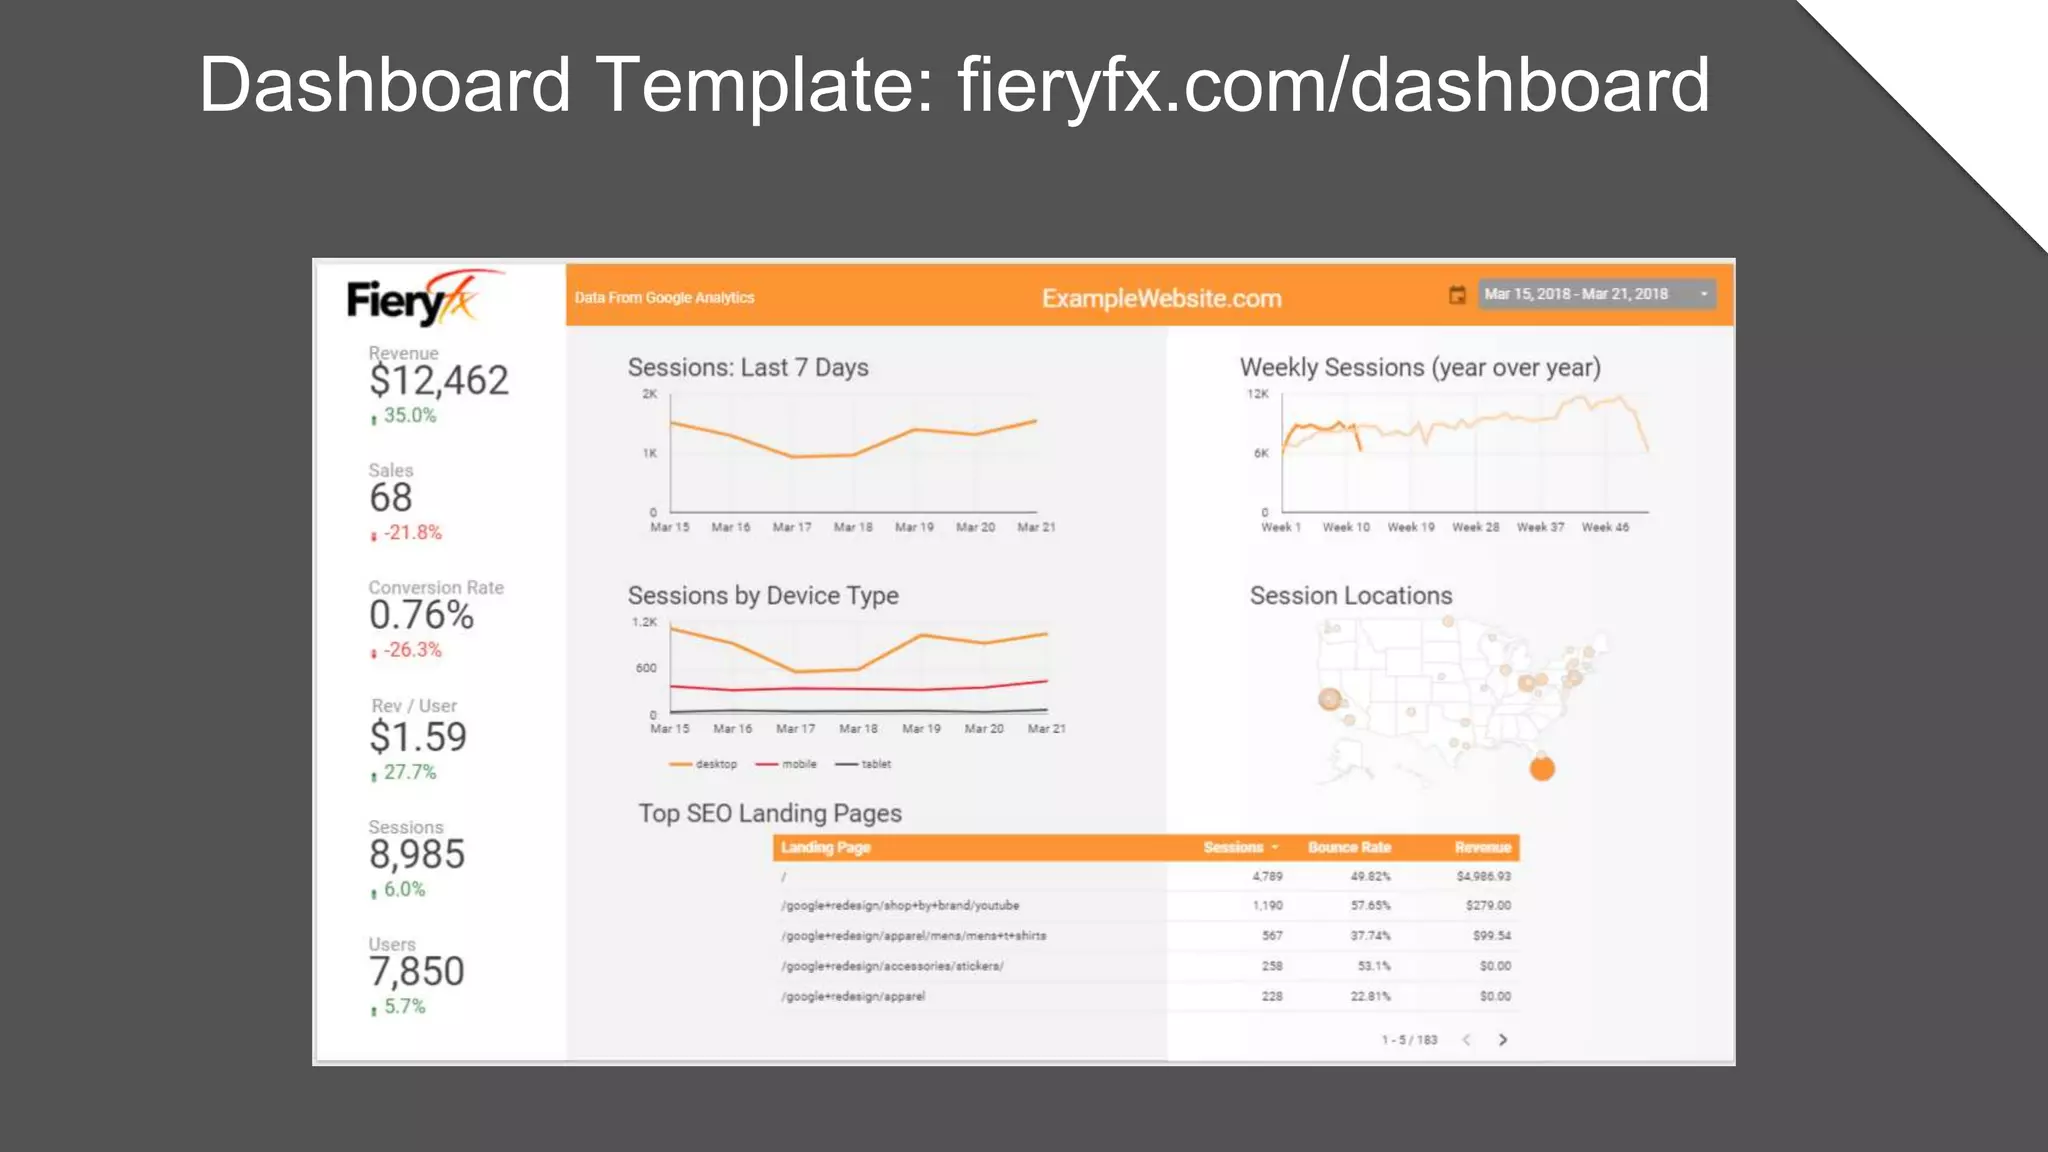
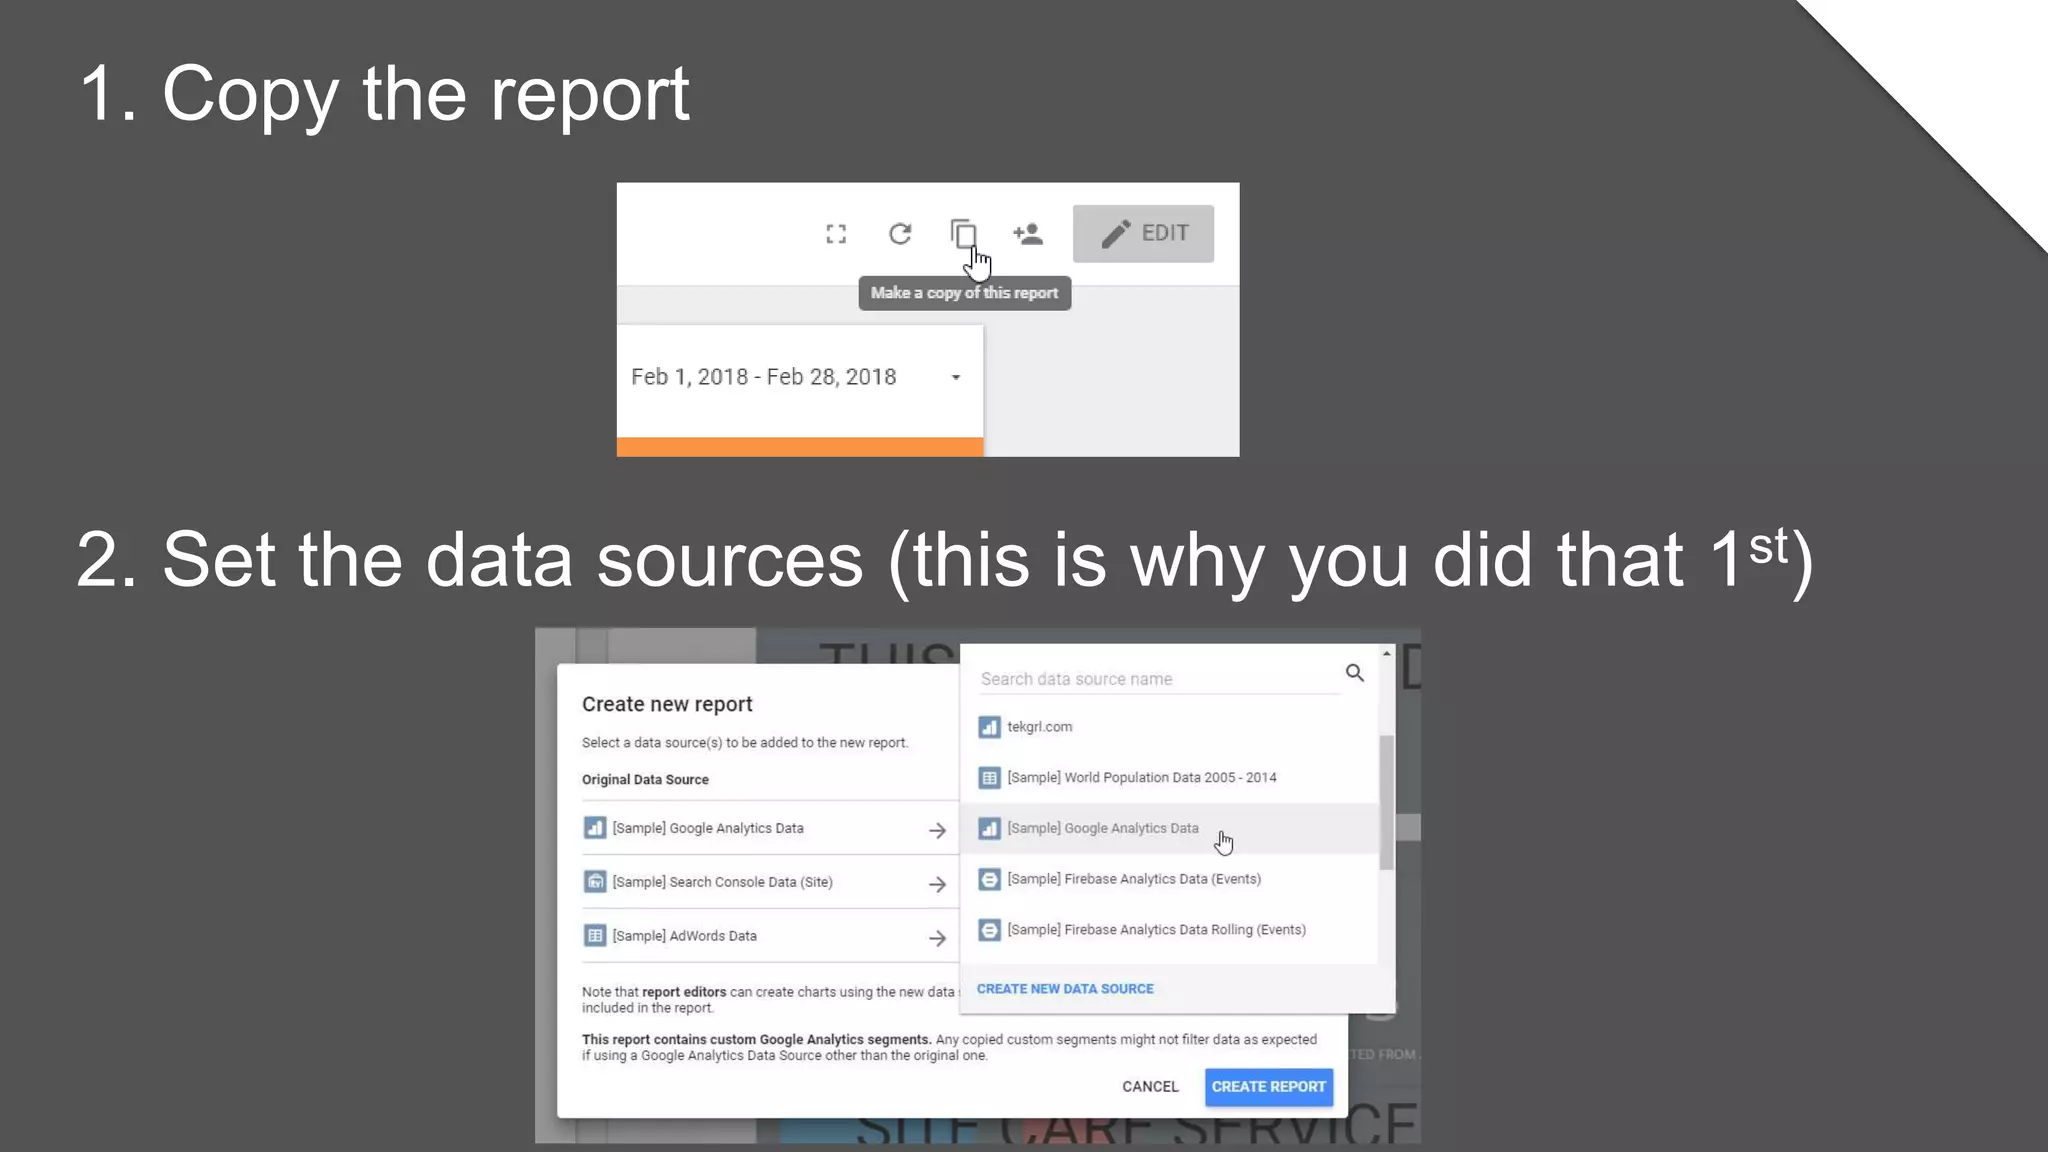


The document discusses the challenges and benefits of using Google Data Studio for reporting, highlighting how traditional reports can be time-consuming and often underutilized. It emphasizes the importance of real-time data visualization and automatic updates, allowing clients to engage more effectively with their reports. The author shares a step-by-step approach to setting up reports in Data Studio, encouraging users to use existing templates and data sources for efficiency.


