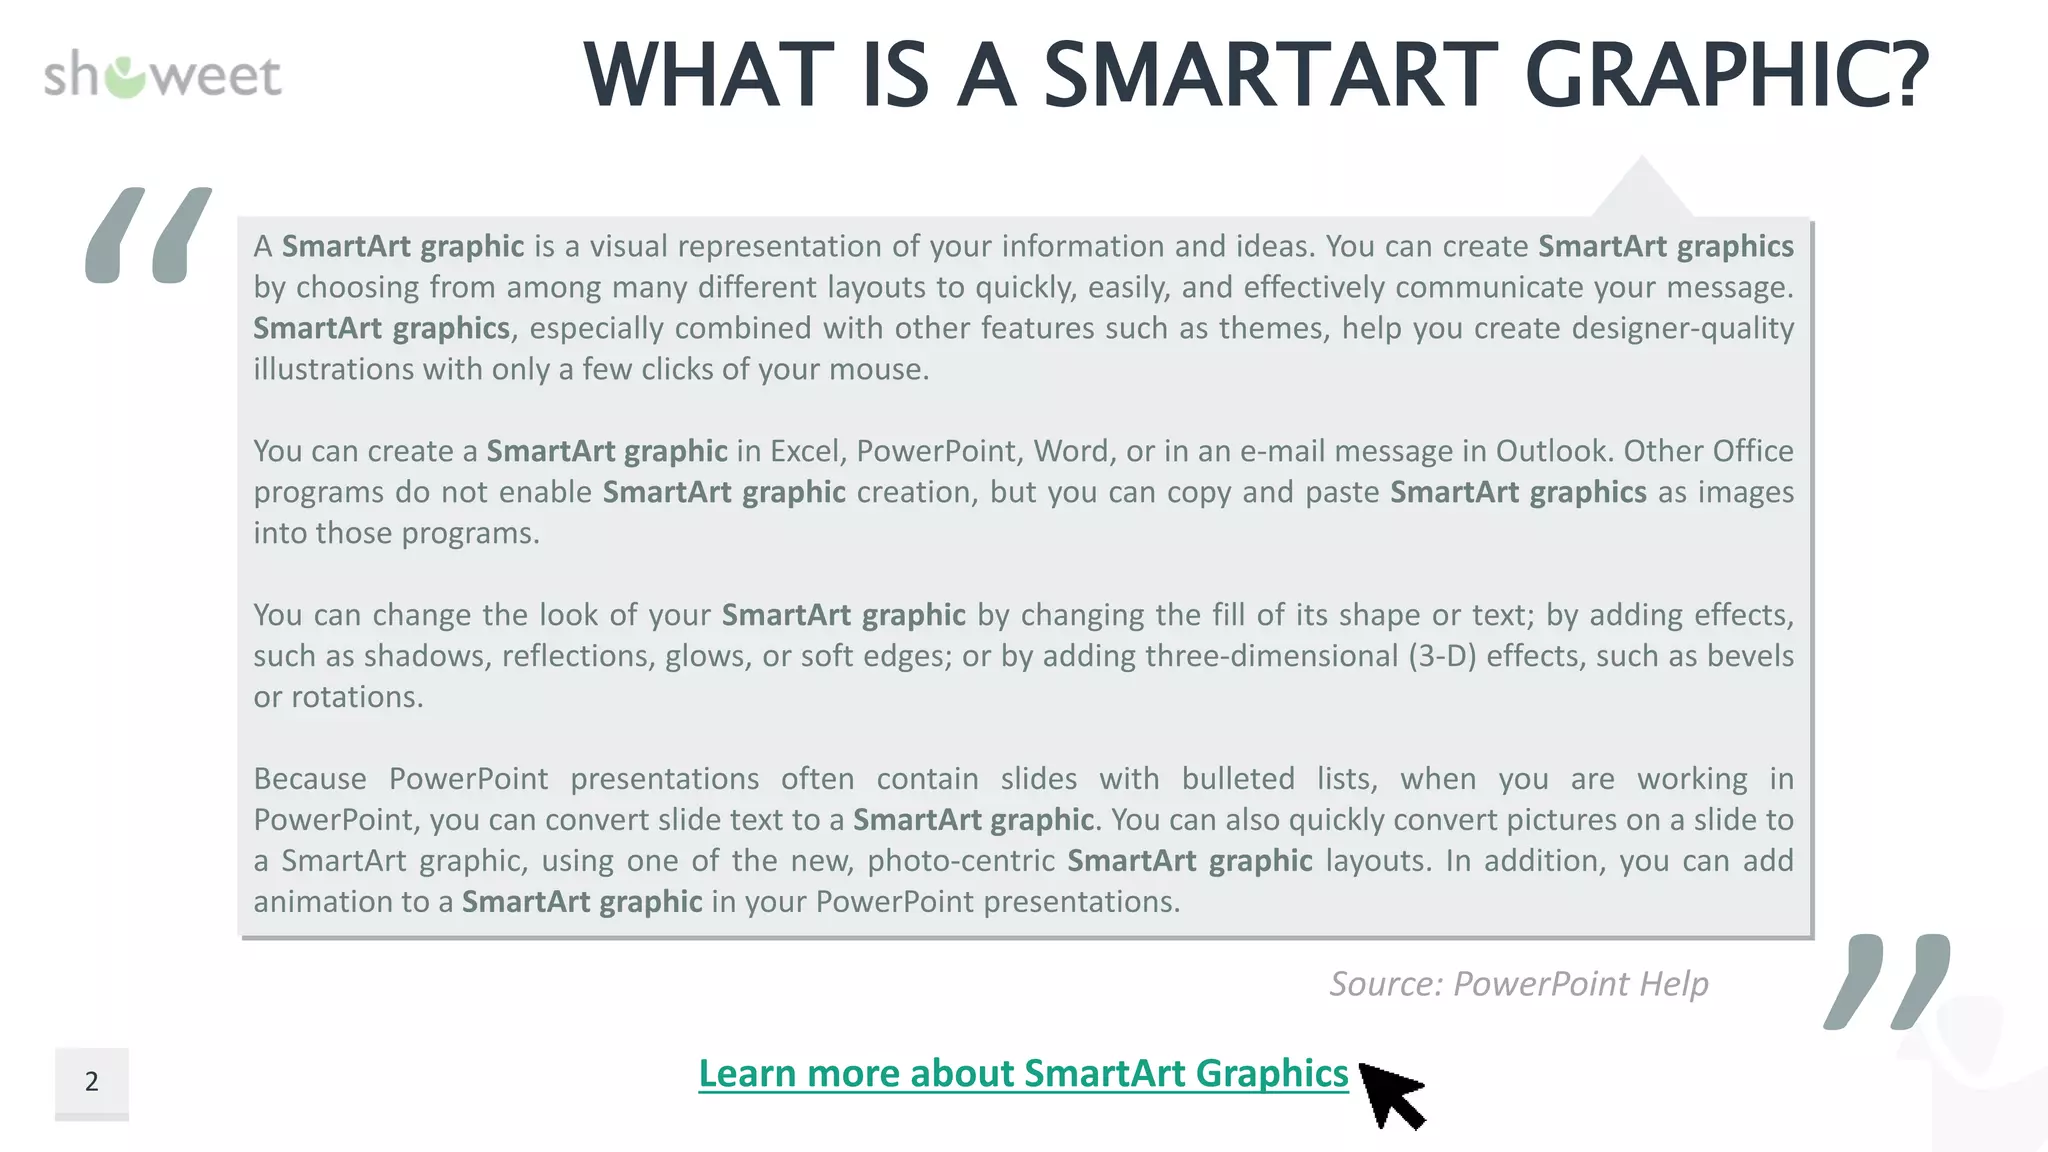
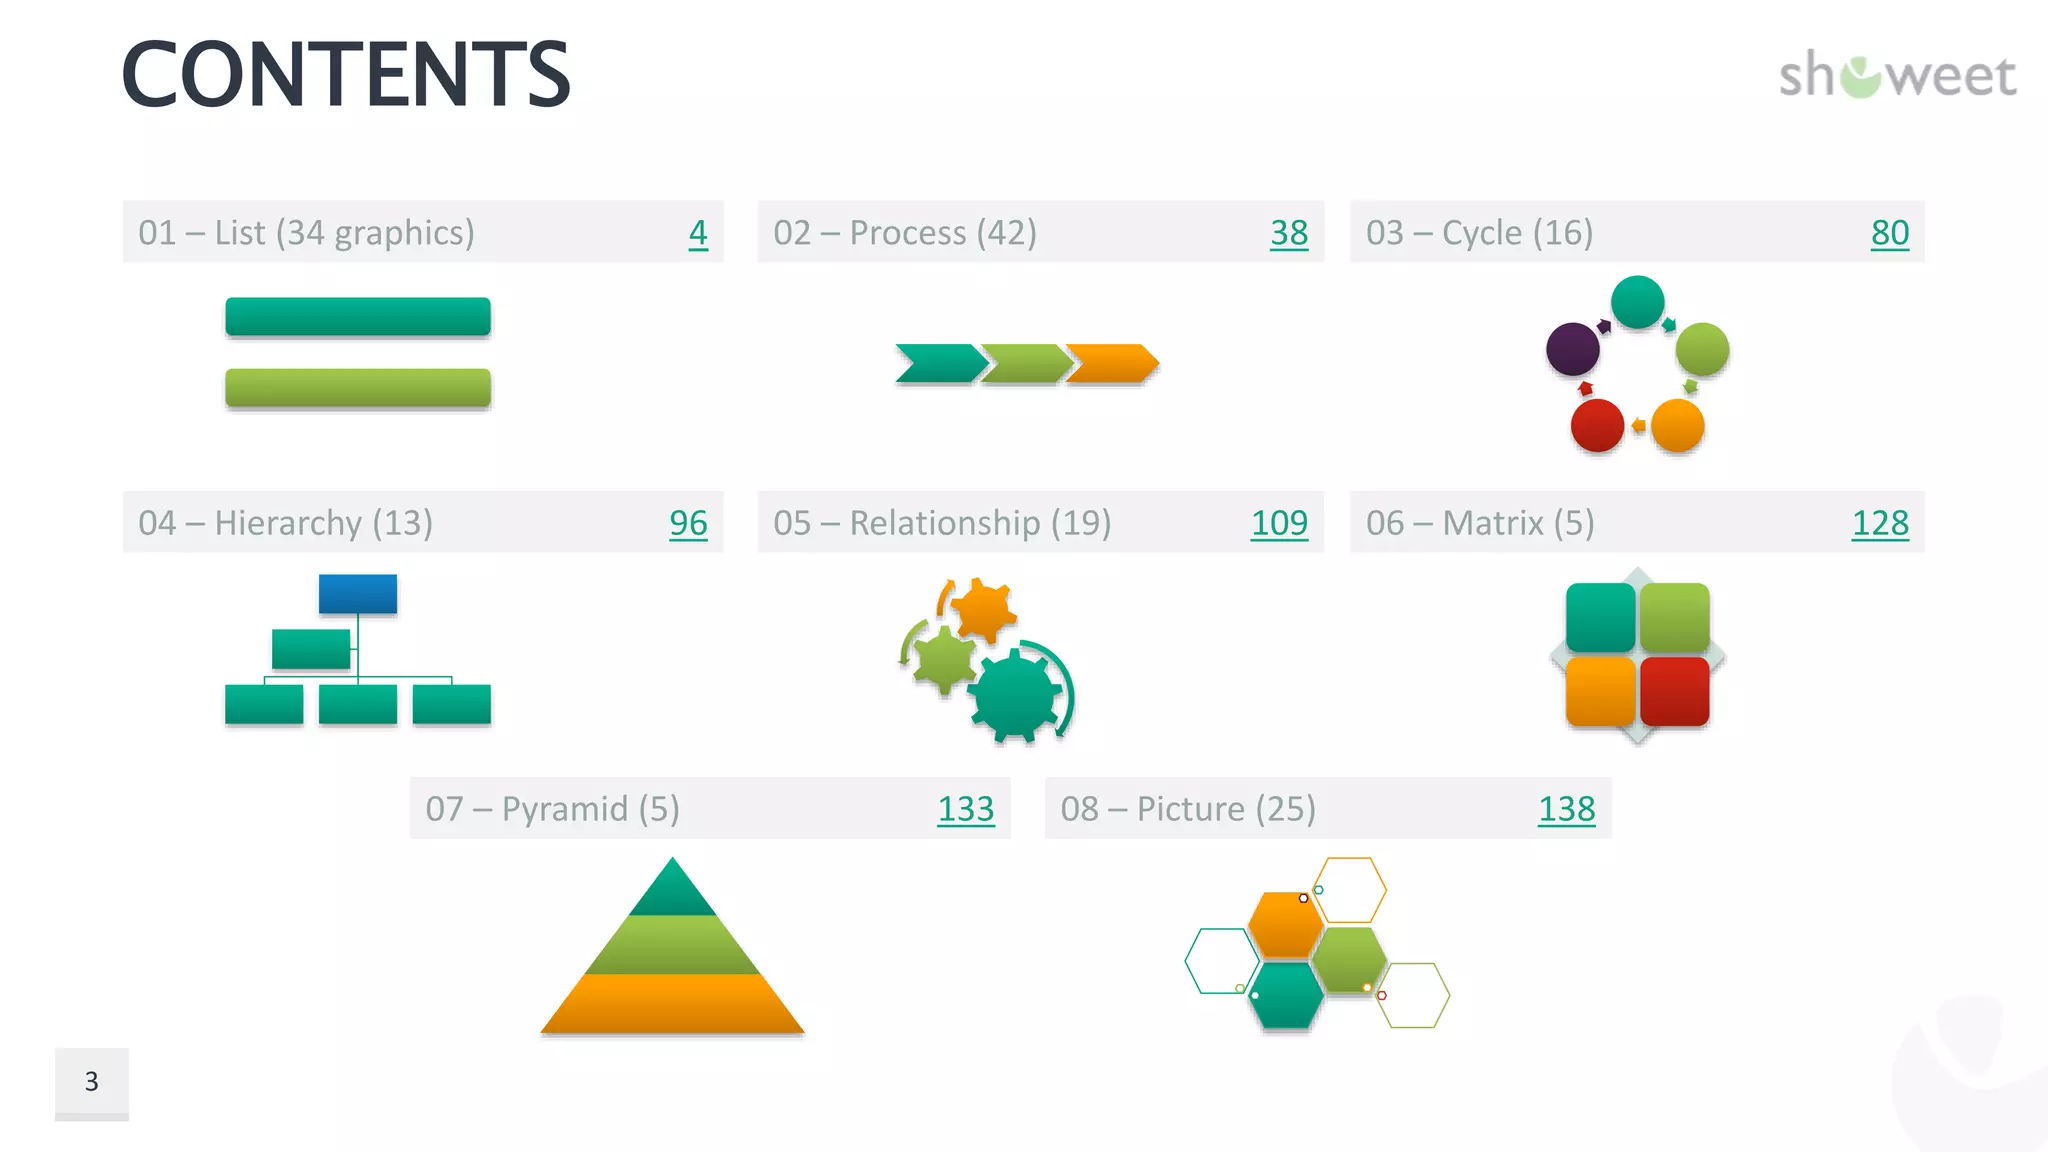
This document provides an overview of SmartArt graphics in Microsoft PowerPoint. It describes what SmartArt graphics are, which are visual representations of information that can be created by choosing different layouts. The document also includes examples of different types of SmartArt graphic layouts for lists, processes, cycles, hierarchies, relationships, matrices, and pictures. It demonstrates how SmartArt graphics can be used to effectively communicate messages and information in PowerPoint presentations.
![Made with by
LIST
- 01 -
PowerPoint SmartArt Graphics - The Complete Ready-to-use Collection [2020 updated version]](https://image.slidesharecdn.com/smartart-graphics-complete-collection-2020widescreen-221119174110-d766c0e9/75/SmartArt-Graphics-Complete-Collection-2020-widescreen-pptx-4-2048.jpg)
![List //
5
Use to show non-
sequential or
grouped blocks of
information.
Maximizes both
horizontal and
vertical display space
for shapes.
PowerPoint SmartArt Graphics - The Complete Ready-to-use Collection [2020 updated version]
BASIC BLOCK LIST
Lorem
Ipsum
Lorem
Ipsum
Lorem
Ipsum
Lorem
Ipsum
Lorem
Ipsum
Lorem
Ipsum
Lorem
Ipsum
Lorem
Ipsum
Lorem
Ipsum](https://image.slidesharecdn.com/smartart-graphics-complete-collection-2020widescreen-221119174110-d766c0e9/75/SmartArt-Graphics-Complete-Collection-2020-widescreen-pptx-5-2048.jpg)
![List //
6
Use to represent a
series of
interconnected
ideas. Level 1 text
appears inside the
hexagons. Level 2
text appears outside
the shapes.
PowerPoint SmartArt Graphics - The Complete Ready-to-use Collection [2020 updated version]
ALTERNATING HEXAGONS
Lorem
Ipsum
Lorem Ipsum
Lorem
Ipsum
Lorem
Ipsum
Lorem
Ipsum
Lorem Ipsum](https://image.slidesharecdn.com/smartart-graphics-complete-collection-2020widescreen-221119174110-d766c0e9/75/SmartArt-Graphics-Complete-Collection-2020-widescreen-pptx-6-2048.jpg)
![List //
7
Use to show non-
sequential or
grouped blocks of
information. The top
shapes are designed
to contain pictures
and pictures are
emphasized over
text. Works well for
pictures with short
text captions.
PowerPoint SmartArt Graphics - The Complete Ready-to-use Collection [2020 updated version]
PICTURE CAPTION LIST
Lorem Ipsum Lorem Ipsum Lorem Ipsum
Lorem Ipsum Lorem Ipsum](https://image.slidesharecdn.com/smartart-graphics-complete-collection-2020widescreen-221119174110-d766c0e9/75/SmartArt-Graphics-Complete-Collection-2020-widescreen-pptx-7-2048.jpg)
![List //
8
Use to show large
amounts of text
divided into
categories and
subcategories.
Works well with
multiple levels of
text. Text at the
same level is
separated by lines.
PowerPoint SmartArt Graphics - The Complete Ready-to-use Collection [2020 updated version]
LINED LIST
Lorem
Ipsum
Some text here Some text here
Some text here
Lorem
Ipsum
Some text here
Some text here
Lorem
Ipsum
Some text here
Some text here
Lorem
Ipsum
Some text here
Some text here](https://image.slidesharecdn.com/smartart-graphics-complete-collection-2020widescreen-221119174110-d766c0e9/75/SmartArt-Graphics-Complete-Collection-2020-widescreen-pptx-8-2048.jpg)
![List //
9
Use to show non-
sequential or
grouped blocks of
information. Works
well for lists with
long headings or top
level information.
PowerPoint SmartArt Graphics - The Complete Ready-to-use Collection [2020 updated version]
VERTICAL BULLET LIST
Lorem Ipsum
• Some text here
• Some text here
Lorem Ipsum
• Some text here
• Some text here
Lorem Ipsum
• Some text here
• Some text here
Lorem Ipsum
• Some text here
• Some text here](https://image.slidesharecdn.com/smartart-graphics-complete-collection-2020widescreen-221119174110-d766c0e9/75/SmartArt-Graphics-Complete-Collection-2020-widescreen-pptx-9-2048.jpg)
![List //
10
Use to show several
groups of
information,
especially groups
with large amounts
of Level 2 text. A
good choice for
bulleted lists of
information.
PowerPoint SmartArt Graphics - The Complete Ready-to-use Collection [2020 updated version]
VERTICAL BOX LIST
• Some text here
• Some text here
Lorem Ipsum
• Some text here
• Some text here
Lorem Ipsum
• Some text here
• Some text here
Lorem Ipsum
• Some text here
• Some text here
Lorem Ipsum](https://image.slidesharecdn.com/smartart-graphics-complete-collection-2020widescreen-221119174110-d766c0e9/75/SmartArt-Graphics-Complete-Collection-2020-widescreen-pptx-10-2048.jpg)
![List //
11
Use to show
grouped blocks of
information. Works
well with large
amounts of Level 2
text.
PowerPoint SmartArt Graphics - The Complete Ready-to-use Collection [2020 updated version]
VERTICAL BRACKET LIST
Lorem Ipsum
• Some text here
• Some text here
Lorem Ipsum
• Some text here
• Some text here
Lorem Ipsum
• Some text here
• Some text here
Lorem Ipsum
• Some text here
• Some text here
Lorem Ipsum
• Some text here
• Some text here](https://image.slidesharecdn.com/smartart-graphics-complete-collection-2020widescreen-221119174110-d766c0e9/75/SmartArt-Graphics-Complete-Collection-2020-widescreen-pptx-11-2048.jpg)
![List //
12
Use for emphasizing
items of different
weights. Good for
large amounts of
Level 1 text. The
width of each shape
is independently
determined based
on its text.
PowerPoint SmartArt Graphics - The Complete Ready-to-use Collection [2020 updated version]
VARYING WIDTH LIST
Lorem Ipsum with very large width
Lorem Ipsum with large width
Lorem Ipsum medium
Lorem Ipsum lower
Lorem Ipsum](https://image.slidesharecdn.com/smartart-graphics-complete-collection-2020widescreen-221119174110-d766c0e9/75/SmartArt-Graphics-Complete-Collection-2020-widescreen-pptx-12-2048.jpg)
![List //
13
Use to show non-
sequential or
grouped blocks of
information. Works
well for lists with a
small amount of
Level 1 text. The first
Level 2 displays next
to the Level 1 text
and the remaining
Level 2 text appears
beneath the Level 1
text.
PowerPoint SmartArt Graphics - The Complete Ready-to-use Collection [2020 updated version]
TAB LIST
Some headline here
Lorem Ipsum
• Some text here
• Some text here
• And again here
Lorem Ipsum
Lorem Ipsum
Lorem Ipsum
Lorem Ipsum](https://image.slidesharecdn.com/smartart-graphics-complete-collection-2020widescreen-221119174110-d766c0e9/75/SmartArt-Graphics-Complete-Collection-2020-widescreen-pptx-13-2048.jpg)
![List //
14
Use to show non-
sequential or
grouped lists of
information. Works
well with large
amounts of text. All
text has the same
level of emphasis,
and direction is not
implied.
PowerPoint SmartArt Graphics - The Complete Ready-to-use Collection [2020 updated version]
HORIZONTAL BULLET LIST
Lorem Ipsum
• Some text
here
• Some text
here
• Some text
here
• Some text
here
Lorem Ipsum
• Some text
here
• Some text
here
• Some text
here
• Some text
here
Lorem Ipsum
• Some text
here
• Some text
here
• Some text
here
• Some text
here
Lorem Ipsum
• Some text
here
• Some text
here
• Some text
here
• Some text
here](https://image.slidesharecdn.com/smartart-graphics-complete-collection-2020widescreen-221119174110-d766c0e9/75/SmartArt-Graphics-Complete-Collection-2020-widescreen-pptx-14-2048.jpg)
![List //
15
Use to show lists of
information divided
into categories.
Level 2 text appears
beside a small
square shape. Works
well with large
amounts of Level 2
text.
PowerPoint SmartArt Graphics - The Complete Ready-to-use Collection [2020 updated version]
SQUARE ACCENT LIST
Lorem Ipsum
Some text here
Some text here
Some text here
Some text here
Some text here
Some text here
Lorem Ipsum
Some text here
Some text here
Some text here
Some text here
Lorem Ipsum
Some text here
Some text here
Some text here
Some text here
Some text here](https://image.slidesharecdn.com/smartart-graphics-complete-collection-2020widescreen-221119174110-d766c0e9/75/SmartArt-Graphics-Complete-Collection-2020-widescreen-pptx-15-2048.jpg)
![List //
16
Use to show
grouped or related
information. The
small shapes on the
upper corners are
designed to contain
pictures. Emphasizes
Level 2 text over
Level 1 text, and is a
good choice for large
amounts of Level 2
text.
PowerPoint SmartArt Graphics - The Complete Ready-to-use Collection [2020 updated version]
PICTURE ACCENT LIST
Lorem
Ipsum
• Some
text here
• Some
text here
• Some
text here
• Some
text here
Lorem
Ipsum
• Some
text here
• Some
text here
• Some
text here
• Some
text here
Lorem
Ipsum
• Some
text here
• Some
text here
• Some
text here
• Some
text here
Lorem
Ipsum
• Some
text here
• Some
text here
• Some
text here
• Some
text here](https://image.slidesharecdn.com/smartart-graphics-complete-collection-2020widescreen-221119174110-d766c0e9/75/SmartArt-Graphics-Complete-Collection-2020-widescreen-pptx-16-2048.jpg)
![List //
17
Use to show non-
sequential or
grouped blocks of
information. The
small circular shapes
are designed to
contain pictures.
Works well for
illustrating both
Level 1 and Level 2
text. Maximizes both
horizontal and
vertical display space
for shapes.
PowerPoint SmartArt Graphics - The Complete Ready-to-use Collection [2020 updated version]
BENDING PICTURE ACCENT LIST
• Some text
here
• Some text
here
Lorem
Ipsum
• Some text
here
• Some text
here
Lorem
Ipsum
• Some text
here
• Some text
here
Lorem
Ipsum
• Some text
here
• Some text
here
Lorem
Ipsum
• Some text
here
• Some text
here
Lorem
Ipsum](https://image.slidesharecdn.com/smartart-graphics-complete-collection-2020widescreen-221119174110-d766c0e9/75/SmartArt-Graphics-Complete-Collection-2020-widescreen-pptx-17-2048.jpg)
![List //
18
Use to show groups
of information or
steps in a task,
process, or
workflow. Circular
shapes contain Level
1 text, and the
corresponding
rectangles contain
Level 2 text. Works
well for numerous
details and minimal
Level 1 text.
PowerPoint SmartArt Graphics - The Complete Ready-to-use Collection [2020 updated version]
STACKED LIST
Some
text here
Some
text here
Some
text here
Some
text here
Lorem
Ipsum Some
text here
Some
text here
Some
text here
Some
text here
Lorem
Ipsum Some
text here
Some
text here
Some
text here
Some
text here
Lorem
Ipsum Some
text here
Some
text here
Some
text here
Some
text here
Lorem
Ipsum](https://image.slidesharecdn.com/smartart-graphics-complete-collection-2020widescreen-221119174110-d766c0e9/75/SmartArt-Graphics-Complete-Collection-2020-widescreen-pptx-18-2048.jpg)
![List //
19
Use to show groups and
sub-groups of
information, or steps
and sub-steps in a task,
process, or workflow.
Level 1 text
corresponds to the top
level horizontal shapes,
and Level 2 text
corresponds to vertical
sub-steps under each
related top level shape.
Works well for
emphasizing sub-
groups or sub-steps,
hierarchical
information, or multiple
lists of information.
PowerPoint SmartArt Graphics - The Complete Ready-to-use Collection [2020 updated version]
GROUPED LIST
Lorem
Ipsum
Some text
here
Some text
here
Some text
here
Lorem
Ipsum
Some text
here
Some text
here
Lorem
Ipsum
Some text
here
Lorem
Ipsum
Some text
here
Some text
here
Some text
here
Some text
here
Lorem
Ipsum
Some text
here
Some text
here](https://image.slidesharecdn.com/smartart-graphics-complete-collection-2020widescreen-221119174110-d766c0e9/75/SmartArt-Graphics-Complete-Collection-2020-widescreen-pptx-19-2048.jpg)
![List //
20
Use to show non-
sequential or
grouped information
with an emphasis on
related pictures. The
top shapes are
designed to contain
pictures.
PowerPoint SmartArt Graphics - The Complete Ready-to-use Collection [2020 updated version]
HORIZONTAL PICTURE LIST
Lorem
Ipsum
• Some
text here
• Some
text here
Lorem
Ipsum
• Some
text here
• Some
text here
Lorem
Ipsum
• Some
text here
• Some
text here
Lorem
Ipsum
• Some
text here
• Some
text here
Lorem
Ipsum
• Some
text here
• Some
text here](https://image.slidesharecdn.com/smartart-graphics-complete-collection-2020widescreen-221119174110-d766c0e9/75/SmartArt-Graphics-Complete-Collection-2020-widescreen-pptx-20-2048.jpg)
![List //
21
Use to show groups
of interconnected
information. The
circular shapes are
designed to contain
pictures.
PowerPoint SmartArt Graphics - The Complete Ready-to-use Collection [2020 updated version]
CONTINUOUS PICTURE LIST
Lorem Ipsum
•Some text here
•Some text here
Lorem Ipsum
•Some text here
•Some text here
Lorem Ipsum
•Some text here
•Some text here
Lorem Ipsum
•Some text here
•Some text here
Lorem Ipsum
•Some text here
•Some text here](https://image.slidesharecdn.com/smartart-graphics-complete-collection-2020widescreen-221119174110-d766c0e9/75/SmartArt-Graphics-Complete-Collection-2020-widescreen-pptx-21-2048.jpg)
![Picture //
22
PICTURE STRIPS
Use to show a series
of pictures from top
to bottom with Level
1 text beside each.
Lorem Ipsum
• Lorem Ipsum
• Lorem Ipsum
• Lorem Ipsum
Lorem Ipsum
• Lorem Ipsum
• Lorem Ipsum
Lorem Ipsum Lorem Ipsum
Lorem Ipsum
• Lorem Ipsum
• Lorem Ipsum
PowerPoint SmartArt Graphics - The Complete Ready-to-use Collection [2020 updated version]](https://image.slidesharecdn.com/smartart-graphics-complete-collection-2020widescreen-221119174110-d766c0e9/75/SmartArt-Graphics-Complete-Collection-2020-widescreen-pptx-22-2048.jpg)
![List //
23
Use to show non-
sequential or
grouped blocks of
information. The
small shapes on the
left are designed to
contain pictures.
PowerPoint SmartArt Graphics - The Complete Ready-to-use Collection [2020 updated version]
VERTICAL PICTURE LIST
Lorem Ipsum
•Some text here
•Some text here
Lorem Ipsum
•Some text here
•Some text here
Lorem Ipsum
•Some text here
•Some text here
Lorem Ipsum
•Some text here
•Some text here](https://image.slidesharecdn.com/smartart-graphics-complete-collection-2020widescreen-221119174110-d766c0e9/75/SmartArt-Graphics-Complete-Collection-2020-widescreen-pptx-23-2048.jpg)
![List //
24
Use to show a series
of pictures from top
to bottom. Text
appears alternately
on the right or left of
the picture.
PowerPoint SmartArt Graphics - The Complete Ready-to-use Collection [2020 updated version]
ALTERNATING PICTURE BLOCKS
Lorem Ipsum
•Some text here
•Some text here
Lorem Ipsum
•Some text here
•Some text here
Lorem Ipsum
•Some text here
•Some text here
Lorem Ipsum
•Some text here
•Some text here
•Lorem Ipsum
•Some text here
•Some text here](https://image.slidesharecdn.com/smartart-graphics-complete-collection-2020widescreen-221119174110-d766c0e9/75/SmartArt-Graphics-Complete-Collection-2020-widescreen-pptx-24-2048.jpg)
![List //
25
Use to show non-
sequential or
grouped blocks of
information. The
small circles are
designed to contain
pictures.
PowerPoint SmartArt Graphics - The Complete Ready-to-use Collection [2020 updated version]
VERTICAL PICTURE ACCENT LIST
Lorem Ipsum
•Some text here
•Some text here
Lorem Ipsum
•Some text here
•Some text here
Lorem Ipsum
•Some text here
•Some text here
Lorem Ipsum
•Some text here
•Some text here
Lorem Ipsum
•Some text here
•Some text here](https://image.slidesharecdn.com/smartart-graphics-complete-collection-2020widescreen-221119174110-d766c0e9/75/SmartArt-Graphics-Complete-Collection-2020-widescreen-pptx-25-2048.jpg)
![List //
26
Use to show lists of
information with an
accent picture for
each Level 2 text.
Level 1 text displays
in a separate box at
the top of the list.
PowerPoint SmartArt Graphics - The Complete Ready-to-use Collection [2020 updated version]
TITLE PICTURE ACCENT LIST
Lorem Ipsum
Some text here
Some text here
Some text here
Some text here
Lorem Ipsum
Some text here
Some text here
Some text here
Some text here](https://image.slidesharecdn.com/smartart-graphics-complete-collection-2020widescreen-221119174110-d766c0e9/75/SmartArt-Graphics-Complete-Collection-2020-widescreen-pptx-26-2048.jpg)
![List //
27
Use to show groups
of information or
steps in a task,
process, or
workflow. Works
well with large
amounts of Level 2
text. A good choice
for text with a main
point and multiple
sub-points.
PowerPoint SmartArt Graphics - The Complete Ready-to-use Collection [2020 updated version]
VERTICAL BLOCK LIST
• Some text here
• Some text here
Lorem Ipsum
• Some text here
• Some text here
Lorem Ipsum
• Some text here
• Some text here
Lorem Ipsum
• Some text here
• Some text here
Lorem Ipsum
• Some text here
• Some text here
Lorem Ipsum](https://image.slidesharecdn.com/smartart-graphics-complete-collection-2020widescreen-221119174110-d766c0e9/75/SmartArt-Graphics-Complete-Collection-2020-widescreen-pptx-27-2048.jpg)
![List //
28
Use to show lists of
information. Level 2
text appears in
rectangular shapes
over vertical
chevrons.
Emphasizes Level 2
text over Level 1
text, and is a good
choice for medium
amounts of Level 2
text.
PowerPoint SmartArt Graphics - The Complete Ready-to-use Collection [2020 updated version]
VERTICAL ACCENT LIST
Lorem Ipsum
Some text here
Some text here
Lorem Ipsum
Some text here
Some text here
Lorem Ipsum
Some text here
Some text here](https://image.slidesharecdn.com/smartart-graphics-complete-collection-2020widescreen-221119174110-d766c0e9/75/SmartArt-Graphics-Complete-Collection-2020-widescreen-pptx-28-2048.jpg)
![List //
29
Use to show a
progression or
sequential steps in a
task, process, or
workflow that move
toward a common
goal. Works well for
bulleted lists of
information.
PowerPoint SmartArt Graphics - The Complete Ready-to-use Collection [2020 updated version]
VERTICAL ARROW LIST
• Some text here
• Some text here
Lorem Ipsum
• Some text here
• Some text here
Lorem Ipsum
• Some text here
• Some text here
Lorem Ipsum
• Some text here
• Some text here
Lorem Ipsum
• Some text here
• Some text here
Lorem Ipsum](https://image.slidesharecdn.com/smartart-graphics-complete-collection-2020widescreen-221119174110-d766c0e9/75/SmartArt-Graphics-Complete-Collection-2020-widescreen-pptx-29-2048.jpg)
![List //
30
Use to show
grouped or related
information of equal
value. Works well
with large amounts
of text.
PowerPoint SmartArt Graphics - The Complete Ready-to-use Collection [2020 updated version]
TRAPEZOID LIST
Lorem Ipsum
•Some text here
•Some text here
•Some text here
•Some text here
Lorem Ipsum
•Some text here
•Some text here
•Some text here
•Some text here
Lorem Ipsum
•Some text here
•Some text here
•Some text here
•Some text here
Lorem Ipsum
•Some text here
•Some text here
•Some text here
•Some text here
Lorem Ipsum
•Some text here
•Some text here
•Some text here
•Some text here](https://image.slidesharecdn.com/smartart-graphics-complete-collection-2020widescreen-221119174110-d766c0e9/75/SmartArt-Graphics-Complete-Collection-2020-widescreen-pptx-30-2048.jpg)
![List //
31
Use to show groups
of related ideas or
lists of information.
The text shapes
decrease in height
sequentially, and the
Level 1 text displays
vertically.
PowerPoint SmartArt Graphics - The Complete Ready-to-use Collection [2020 updated version]
DESCENDING BLOCK LIST
Lorem
Ipsum
Lorem
Ipsum
Lorem
Ipsum
Lorem
Ipsum
Lorem
Ipsum
Some
text here
Some
text here
Some
text here
Some
text here
Some
text here
Some
text here
Some
text here
Some
text here
Some
text here
Some
text here
Some
text here
Some
text here
Some
text here
Some
text here
Some
text here
Some
text here](https://image.slidesharecdn.com/smartart-graphics-complete-collection-2020widescreen-221119174110-d766c0e9/75/SmartArt-Graphics-Complete-Collection-2020-widescreen-pptx-31-2048.jpg)
![List //
32
Use to show
grouped or related
information of equal
value. The first Level
1 line of text
corresponds to the
top shape and its
Level 2 text is used
for the subsequent
lists.
PowerPoint SmartArt Graphics - The Complete Ready-to-use Collection [2020 updated version]
TABLE LIST
LOREM IPSUM
Level 2
• Level 3
Level 2
• Level 3
Level 2
• Level 3
• Level 3
Level 2
• Level 3
• Level 3
Level 2
• Level 3
• Level 3](https://image.slidesharecdn.com/smartart-graphics-complete-collection-2020widescreen-221119174110-d766c0e9/75/SmartArt-Graphics-Complete-Collection-2020-widescreen-pptx-32-2048.jpg)
![List //
33
Use to show a
curved list of
information. To add
pictures to the
accent circle shapes,
apply a picture fill.
PowerPoint SmartArt Graphics - The Complete Ready-to-use Collection [2020 updated version]
VERTICAL CURVED LIST
Lorem Ipsum
•Some text here
•Some text here
Lorem Ipsum
•Some text here
•Some text here
Lorem Ipsum
•Some text here
•Some text here
Lorem Ipsum
•Some text here
•Some text here
Lorem Ipsum
•Some text here
•Some text here](https://image.slidesharecdn.com/smartart-graphics-complete-collection-2020widescreen-221119174110-d766c0e9/75/SmartArt-Graphics-Complete-Collection-2020-widescreen-pptx-33-2048.jpg)
![List //
34
Use to show
interrelated or
overlapping
information. Each of
the first seven lines
of Level 1 text
appears in the
rectangular shape.
Unused text does
not appear, but
remains available if
you switch layouts.
Works well with
both Level 1 and
Level 2 text.
PowerPoint SmartArt Graphics - The Complete Ready-to-use Collection [2020 updated version]
TARGET LIST
Lorem Ipsum
Lorem Ipsum
Lorem Ipsum
Lorem Ipsum
Lorem Ipsum
• Some text here
• Some text here
• Some text here
• Some text here
• Some text here
• Some text here
• Some text here
• Some text here
• Some text here
• Some text here](https://image.slidesharecdn.com/smartart-graphics-complete-collection-2020widescreen-221119174110-d766c0e9/75/SmartArt-Graphics-Complete-Collection-2020-widescreen-pptx-34-2048.jpg)
![List //
35
Use to show
hierarchical
relationships
progressing across
groups. Can also be
used to group or list
information.
PowerPoint SmartArt Graphics - The Complete Ready-to-use Collection [2020 updated version]
HIERARCHY LIST
Lorem
Ipsum
Some
text here
Some
text here
Some
text here
Some
text here
Lorem
Ipsum
Some
text here
Some
text here
Some
text here
Lorem
Ipsum
Some
text here
Some
text here
Some
text here
Lorem
Ipsum
Some
text here
Some
text here
Some
text here
Lorem
Ipsum
Some
text here
Some
text here
Some
text here](https://image.slidesharecdn.com/smartart-graphics-complete-collection-2020widescreen-221119174110-d766c0e9/75/SmartArt-Graphics-Complete-Collection-2020-widescreen-pptx-35-2048.jpg)
![List //
36
Use to show
sequential or
grouped data. Works
best for Level 1 text,
which displays next
to a large circular
shape. Lower levels
of text are separated
with smaller circular
shapes.
PowerPoint SmartArt Graphics - The Complete Ready-to-use Collection [2020 updated version]
VERTICAL CIRCLE LIST
Lorem Ipsum
Some text here
Some text here
Lorem Ipsum
Some text here
Some text here
Lorem Ipsum
Some text here
Some text here](https://image.slidesharecdn.com/smartart-graphics-complete-collection-2020widescreen-221119174110-d766c0e9/75/SmartArt-Graphics-Complete-Collection-2020-widescreen-pptx-36-2048.jpg)
![List //
37
Use to show
hierarchical
relationships that
build from the
bottom up. This
layout works well for
showing
architectural
components or
objects that build on
other objects.
PowerPoint SmartArt Graphics - The Complete Ready-to-use Collection [2020 updated version]
ARCHITECTURE LAYOUT
Lorem
Ipsum
Level
2
Level
3
Level 2
Level
3
Level
3
Lorem
Ipsum
Level
2
Level
3
Level 2
Level
3
Level
3
Lorem
Ipsum
Level
2
Level
3
Level 2
Level
3
Level
3
Lorem
Ipsum
Level
2
Level
3
Level 2
Level
3
Level
3](https://image.slidesharecdn.com/smartart-graphics-complete-collection-2020widescreen-221119174110-d766c0e9/75/SmartArt-Graphics-Complete-Collection-2020-widescreen-pptx-37-2048.jpg)
![Made with by
PROCESS
- 02 -
PowerPoint SmartArt Graphics - The Complete Ready-to-use Collection [2020 updated version]](https://image.slidesharecdn.com/smartart-graphics-complete-collection-2020widescreen-221119174110-d766c0e9/75/SmartArt-Graphics-Complete-Collection-2020-widescreen-pptx-38-2048.jpg)
![Process //
39
BASIC PROCESS
Use to show a
progression or
sequential steps in a
task, process, or
workflow.
PowerPoint SmartArt Graphics - The Complete Ready-to-use Collection [2020 updated version]
Lorem
Ipsum
•Some text
here
•Some text
here
Lorem
Ipsum
•Some text
here
•Some text
here
Lorem
Ipsum
•Some text
here
•Some text
here
Lorem
Ipsum
•Some text
here
•Some text
here
Lorem
Ipsum
•Some text
here
•Some text
here](https://image.slidesharecdn.com/smartart-graphics-complete-collection-2020widescreen-221119174110-d766c0e9/75/SmartArt-Graphics-Complete-Collection-2020-widescreen-pptx-39-2048.jpg)
![Process //
40
STEP UP PROCESS
Use to show an
ascending series of
steps or lists of
information.
Lorem Ipsum
•Some text here
•Some text here
Lorem Ipsum
•Some text here
•Some text here
Lorem Ipsum
•Some text here
•Some text here
Lorem Ipsum
•Some text here
•Some text here
Lorem Ipsum
•Some text here
•Some text here
PowerPoint SmartArt Graphics - The Complete Ready-to-use Collection [2020 updated version]](https://image.slidesharecdn.com/smartart-graphics-complete-collection-2020widescreen-221119174110-d766c0e9/75/SmartArt-Graphics-Complete-Collection-2020-widescreen-pptx-40-2048.jpg)
![Process //
41
STEP DOWN PROCESS
Use to show a
descending process
with multiple steps
and sub-steps.
Works best with
small amounts of
text.
Lorem
Ipsum
•Some text
here
•Some text
here
Lorem
Ipsum
•Some text
here
•Some text
here
Lorem
Ipsum
•Some text
here
•Some text
here
Lorem
Ipsum
•Some text
here
•Some text
here
Lorem
Ipsum
•Some text
here
•Some text
here
PowerPoint SmartArt Graphics - The Complete Ready-to-use Collection [2020 updated version]](https://image.slidesharecdn.com/smartart-graphics-complete-collection-2020widescreen-221119174110-d766c0e9/75/SmartArt-Graphics-Complete-Collection-2020-widescreen-pptx-41-2048.jpg)
![Process //
42
ACCENT PROCESS
Use to show a
progression, a
timeline, or
sequential steps in a
task, process, or
workflow. Works
well for illustrating
both Level 1 and
Level 2 text.
Lorem Ipsum
• Some text
here
• Some text
here
Lorem Ipsum
• Some text
here
• Some text
here
Lorem Ipsum
• Some text
here
• Some text
here
Lorem Ipsum
• Some text
here
• Some text
here
Lorem Ipsum
• Some text
here
• Some text
here
PowerPoint SmartArt Graphics - The Complete Ready-to-use Collection [2020 updated version]](https://image.slidesharecdn.com/smartart-graphics-complete-collection-2020widescreen-221119174110-d766c0e9/75/SmartArt-Graphics-Complete-Collection-2020-widescreen-pptx-42-2048.jpg)
![Process //
43
PICTURE ACCENT PROCESS
Use to show
sequential steps in a
task, process, or
workflow. The
rectangular shapes
in the background
are designed to
contain pictures.
Lorem Ipsum
•Some text here
•Some text here
Lorem Ipsum
•Some text here
•Some text here
Lorem Ipsum
•Some text here
•Some text here
Lorem Ipsum
•Some text here
•Some text here
Lorem Ipsum
•Some text here
•Some text here
PowerPoint SmartArt Graphics - The Complete Ready-to-use Collection [2020 updated version]](https://image.slidesharecdn.com/smartart-graphics-complete-collection-2020widescreen-221119174110-d766c0e9/75/SmartArt-Graphics-Complete-Collection-2020-widescreen-pptx-43-2048.jpg)
![Process //
44
ALTERNATING FLOW
Use to show groups
of information or
sequential steps in a
task, process, or
workflow.
Emphasizes the
interaction or
relationships among
the groups of
information.
• Some text here
• Some text here
• Some text here
Lorem Ipsum
• Some text here
• Some text here
Lorem Ipsum
• Some text here
• Some text here
Lorem Ipsum
• Some text here
• Some text here
Lorem Ipsum
• Some text here
• Some text here
• Some text here
Lorem Ipsum
PowerPoint SmartArt Graphics - The Complete Ready-to-use Collection [2020 updated version]](https://image.slidesharecdn.com/smartart-graphics-complete-collection-2020widescreen-221119174110-d766c0e9/75/SmartArt-Graphics-Complete-Collection-2020-widescreen-pptx-44-2048.jpg)
![Process //
45
INCREASING CIRCLE PROCESS
Use to show a series
of steps, with the
interior of the circle
increasing with each
step. Limited to
seven Level 1 steps
but unlimited Level 2
items. Works well
with large amounts
of Level 2 text.
Some text here
Some text here
Some text here
Some text here
Some text here
Lorem Ipsum
Some text here
Some text here
Some text here
Some text here
Lorem Ipsum
Some text here
Some text here
Some text here
Some text here
Lorem Ipsum
Some text here
Some text here
Some text here
Some text here
Lorem Ipsum
PowerPoint SmartArt Graphics - The Complete Ready-to-use Collection [2020 updated version]](https://image.slidesharecdn.com/smartart-graphics-complete-collection-2020widescreen-221119174110-d766c0e9/75/SmartArt-Graphics-Complete-Collection-2020-widescreen-pptx-45-2048.jpg)
![Process //
46
PIE PROCESS
Use to show steps in
a process with each
pie slice increasing in
size up to seven
shapes. Level 1 text
displays vertically.
Lorem
Ipsum
Some text
here
Some text
here
Lorem
Ipsum
Some text
here
Some text
here
Lorem
Ipsum
Some text
here
Some text
here
Lorem
Ipsum
Some text
here
Some text
here
Lorem
Ipsum
Some text
here
Some text
here
PowerPoint SmartArt Graphics - The Complete Ready-to-use Collection [2020 updated version]](https://image.slidesharecdn.com/smartart-graphics-complete-collection-2020widescreen-221119174110-d766c0e9/75/SmartArt-Graphics-Complete-Collection-2020-widescreen-pptx-46-2048.jpg)
![Process //
47
CONTINUOUS BLOCK PROCESS
Use to show a
progression or
sequential steps in a
task, process, or
workflow. Works
best with minimal
Level 1 and Level 2
text.
Lorem Ipsum
•Some text here
•Some text here
Lorem Ipsum
•Some text here
•Some text here
Lorem Ipsum
•Some text here
•Some text here
Lorem Ipsum
•Some text here
•Some text here
Lorem Ipsum
•Some text here
•Some text here
PowerPoint SmartArt Graphics - The Complete Ready-to-use Collection [2020 updated version]](https://image.slidesharecdn.com/smartart-graphics-complete-collection-2020widescreen-221119174110-d766c0e9/75/SmartArt-Graphics-Complete-Collection-2020-widescreen-pptx-47-2048.jpg)
![Process //
48
INCREASING ARROWS PROCESS
Use to show
sequential and
overlapping steps in
a process. Limited to
five Level 1 items.
Level 2 can contain
large amounts of
text.
Lorem Ipsum
Some text
here
Some text
here
Some text
here
Lorem Ipsum
Some text
here
Some text
here
Lorem Ipsum
Some text
here
Some text
here
Lorem Ipsum
Some text
here
Some text
here
Some text
here
Lorem Ipsum
Some text
here
Some text
here
PowerPoint SmartArt Graphics - The Complete Ready-to-use Collection [2020 updated version]](https://image.slidesharecdn.com/smartart-graphics-complete-collection-2020widescreen-221119174110-d766c0e9/75/SmartArt-Graphics-Complete-Collection-2020-widescreen-pptx-48-2048.jpg)
![Process //
49
INTERCONNECTEDBLOCK
PROCESS
Use to show
sequential steps in a
process. Works best
with small amounts
of Level 1 text and
medium amounts of
Level 2 text.
Some text
here
Some text
here
Some text
here
Some text
here
Lorem Ipsum
Some text
here
Some text
here
Some text
here
Some text
here
Lorem Ipsum
Some text
here
Some text
here
Some text
here
Some text
here
Lorem Ipsum
Some text
here
Some text
here
Some text
here
Some text
here
Lorem Ipsum
Some text
here
Some text
here
Some text
here
Some text
here
Lorem Ipsum
PowerPoint SmartArt Graphics - The Complete Ready-to-use Collection [2020 updated version]](https://image.slidesharecdn.com/smartart-graphics-complete-collection-2020widescreen-221119174110-d766c0e9/75/SmartArt-Graphics-Complete-Collection-2020-widescreen-pptx-49-2048.jpg)
![Process //
50
CONTINUOUS ARROW PROCESS
Use to show a
timeline or
sequential steps in a
task, process, or
workflow. Works
best with Level 1
text because each
line of Level 1 text
appears inside the
arrow shape. Level 2
text appears outside
the arrow shape.
• Some
text here
• Some
text here
• Some
text here
Lorem
Ipsum
• Some
text here
• Some
text here
• Some
text here
Lorem
Ipsum
• Some
text here
• Some
text here
Lorem
Ipsum
• Some
text here
• Some
text here
Lorem
Ipsum
• Some
text here
• Some
text here
• Some
text here
• Some
text here
Lorem
Ipsum
PowerPoint SmartArt Graphics - The Complete Ready-to-use Collection [2020 updated version]](https://image.slidesharecdn.com/smartart-graphics-complete-collection-2020widescreen-221119174110-d766c0e9/75/SmartArt-Graphics-Complete-Collection-2020-widescreen-pptx-50-2048.jpg)
![Process //
51
CONVERGING TEXT
Use to show
multiple steps or
parts that merge
into a whole. Limited
to one Level 1 shape
that contains text
and a maximum of
five Level 2 shapes.
Lorem
Ipsum
Some text
here
Some text
here
Lorem
Ipsum
Some text
here
Some text
here
Lorem
Ipsum
Some text
here
Some text
here
PowerPoint SmartArt Graphics - The Complete Ready-to-use Collection [2020 updated version]](https://image.slidesharecdn.com/smartart-graphics-complete-collection-2020widescreen-221119174110-d766c0e9/75/SmartArt-Graphics-Complete-Collection-2020-widescreen-pptx-51-2048.jpg)
![Process //
52
PROCESS ARROWS
Use to show
information
illustrating a process
or workflow. Level 1
text appears in the
circular shapes and
Level 2 text appears
in the arrow shapes.
Works best for
minimal text and to
emphasize
movement or
direction.
•Some
text here
•Some
text here
Lorem
Ipsum
•Some
text here
•Some
text here
Lorem
Ipsum
•Some
text here
•Some
text here
Lorem
Ipsum
•Some
text here
•Some
text here
Lorem
Ipsum
•Some
text here
•Some
text here
Lorem
Ipsum
PowerPoint SmartArt Graphics - The Complete Ready-to-use Collection [2020 updated version]](https://image.slidesharecdn.com/smartart-graphics-complete-collection-2020widescreen-221119174110-d766c0e9/75/SmartArt-Graphics-Complete-Collection-2020-widescreen-pptx-52-2048.jpg)
![Process //
53
CIRCLE ACCENT TIMELINE
Use to show a series
of events or timeline
information. Level 1
text appears next to
larger circular
shapes. Level 2 text
appears next to
smaller circular
shapes.
PowerPoint SmartArt Graphics - The Complete Ready-to-use Collection [2020 updated version]](https://image.slidesharecdn.com/smartart-graphics-complete-collection-2020widescreen-221119174110-d766c0e9/75/SmartArt-Graphics-Complete-Collection-2020-widescreen-pptx-53-2048.jpg)
![Process //
54
BASIC TIMELINE
Use to show
sequential steps in a
task, process, or
workflow, or to
show timeline
information. Works
well with both Level
1 and Level 2 text.
Lorem
Ipsum
•Some text
here
•Some text
here
Lorem
Ipsum
•Some text
here
•Some text
here
Lorem
Ipsum
•Some text
here
•Some text
here
Lorem
Ipsum
•Some text
here
•Some text
here
Lorem
Ipsum
•Some text
here
•Some text
here
PowerPoint SmartArt Graphics - The Complete Ready-to-use Collection [2020 updated version]](https://image.slidesharecdn.com/smartart-graphics-complete-collection-2020widescreen-221119174110-d766c0e9/75/SmartArt-Graphics-Complete-Collection-2020-widescreen-pptx-54-2048.jpg)
![Process //
55
CIRCLE PROCESS
Use to show
sequential steps in a
process. Limited to
eleven Level 1
shapes with an
unlimited number of
Level 2 shapes.
Works best with
small amounts of
text. Unused text
does not appear, but
remains available if
you switch layouts.
Lorem
Ipsum
•Some text here
•Some text here
Lorem
Ipsum
•Some text here
•Some text here
Lorem
Ipsum
•Some text here
•Some text here
Lorem
Ipsum
•Some text here
•Some text here
Lorem
Ipsum
•Some text here
•Some text here
PowerPoint SmartArt Graphics - The Complete Ready-to-use Collection [2020 updated version]](https://image.slidesharecdn.com/smartart-graphics-complete-collection-2020widescreen-221119174110-d766c0e9/75/SmartArt-Graphics-Complete-Collection-2020-widescreen-pptx-55-2048.jpg)
![Process //
56
BASIC CHEVRON PROCESS
Use to show a
progression; a
timeline; sequential
steps in a task,
process, or
workflow; or to
emphasize
movement or
direction. Level 1
text appears inside
an arrow shape
while Level 2 text
appears below the
arrow shapes.
Lorem
Ipsum
• Some text
here
• Some text
here
Lorem
Ipsum
• Some text
here
• Some text
here
• Some text
here
Lorem
Ipsum
• Some text
here
• Some text
here
Lorem
Ipsum
• Some text
here
• Some text
here
Lorem
Ipsum
• Some text
here
• Some text
here
PowerPoint SmartArt Graphics - The Complete Ready-to-use Collection [2020 updated version]](https://image.slidesharecdn.com/smartart-graphics-complete-collection-2020widescreen-221119174110-d766c0e9/75/SmartArt-Graphics-Complete-Collection-2020-widescreen-pptx-56-2048.jpg)
![Process //
57
CHEVRON ACCENT PROCESS
Use to show
sequential steps in a
task, process, or
workflow, or to
emphasize
movement or
direction. Works
best with minimal
Level 1 and Level 2
text.
Lorem Ipsum
•Some text here
•Some text here
Lorem Ipsum
•Some text here
•Some text here
Lorem Ipsum
•Some text here
•Some text here
Lorem Ipsum
•Some text here
•Some text here
PowerPoint SmartArt Graphics - The Complete Ready-to-use Collection [2020 updated version]](https://image.slidesharecdn.com/smartart-graphics-complete-collection-2020widescreen-221119174110-d766c0e9/75/SmartArt-Graphics-Complete-Collection-2020-widescreen-pptx-57-2048.jpg)
![Process //
58
CLOSED CHEVRON PROCESS
Use to show a
progression, a
timeline, or
sequential steps in a
task, process, or
workflow, or to
emphasize
movement or
direction. Can be
used to emphasize
information in the
starting shape.
Works best with
Level 1 text only.
Lorem Ipsum
•Some text here
•Some text here
Lorem
Ipsum
•Some text
here
•Some text
here
Lorem
Ipsum
•Some text
here
•Some text
here
Lorem
Ipsum
•Some text
here
•Some text
here
Lorem
Ipsum
•Some text
here
•Some text
here
PowerPoint SmartArt Graphics - The Complete Ready-to-use Collection [2020 updated version]](https://image.slidesharecdn.com/smartart-graphics-complete-collection-2020widescreen-221119174110-d766c0e9/75/SmartArt-Graphics-Complete-Collection-2020-widescreen-pptx-58-2048.jpg)
![Process //
59
CHEVRON LIST
Use to show a
progression through
several processes
that make up an
overall workflow.
Also works for
illustrating
contrasting
processes. The Level
1 text corresponds
to the first arrow
shape on the left,
while the Level 2
text corresponds to
horizontal sub-steps
for each shape that
contains Level 1 text.
Lorem
Ipsum
Some
text here
Some
text here
Lorem
Ipsum
Some
text here
Some
text here
Lorem
Ipsum
Some
text here
Some
text here
Lorem
Ipsum
Some
text here
Some
text here
Lorem
Ipsum
Some
text here
Some
text here
PowerPoint SmartArt Graphics - The Complete Ready-to-use Collection [2020 updated version]](https://image.slidesharecdn.com/smartart-graphics-complete-collection-2020widescreen-221119174110-d766c0e9/75/SmartArt-Graphics-Complete-Collection-2020-widescreen-pptx-59-2048.jpg)
![Process //
60
VERTICAL CHEVRON LIST
Use to show a
progression or
sequential steps in a
task, process, or
workflow, or to
emphasize
movement or
direction.
Emphasizes Level 2
text over Level 1
text, and is a good
choice for large
amounts of Level 2
text.
Lorem Ipsum
• Some text here
• Some text here
Lorem Ipsum
• Some text here
• Some text here
Lorem Ipsum
• Some text here
• Some text here
Lorem Ipsum
• Some text here
• Some text here
Lorem Ipsum
• Some text here
• Some text here
PowerPoint SmartArt Graphics - The Complete Ready-to-use Collection [2020 updated version]](https://image.slidesharecdn.com/smartart-graphics-complete-collection-2020widescreen-221119174110-d766c0e9/75/SmartArt-Graphics-Complete-Collection-2020-widescreen-pptx-60-2048.jpg)
![Process //
61
SUB-STEP PROCESS
Use to show a multi-
step process with
sub-steps between
each instance of
Level 1 text. Works
best with small
amounts of text and
is limited to seven
Level 1 steps. Each
Level 1 step can
have unlimited sub-
steps.
Lorem
Ipsum
Some text
here
Some text
here
Some text
here
Some text
here
Lorem
Ipsum
Some text
here
Some text
here
Some text
here
Lorem
Ipsum
Some text
here
Some text
here
PowerPoint SmartArt Graphics - The Complete Ready-to-use Collection [2020 updated version]](https://image.slidesharecdn.com/smartart-graphics-complete-collection-2020widescreen-221119174110-d766c0e9/75/SmartArt-Graphics-Complete-Collection-2020-widescreen-pptx-61-2048.jpg)
![Process //
62
PHASED PROCESS
Use to show three
phases of a process.
Limited to three
Level 1 items. The
first two Level 1
items can each
contain four Level 2
items, and the third
Level 1 item can
contain an unlimited
number of Level 2
items. Works best
with small amounts
of text. Lorem Ipsum Lorem Ipsum
Some
text
here
Some
text
here
Some
text
here
Some
text
here
Some text
here
Some text
here
Lorem Ipsum
PowerPoint SmartArt Graphics - The Complete Ready-to-use Collection [2020 updated version]](https://image.slidesharecdn.com/smartart-graphics-complete-collection-2020widescreen-221119174110-d766c0e9/75/SmartArt-Graphics-Complete-Collection-2020-widescreen-pptx-62-2048.jpg)
![Process //
63
RANDOM TO RESULT PROCESS
Use to show,
through a series of
steps, how several
chaotic ideas can
result in a unified
goal or idea.
Supports multiple
items of Level 1 text,
but the first and last
Level 1
corresponding
shapes are fixed.
Works best with
small amounts of
Level 1 text and
medium amounts of
Level 2 text.
Lorem Ipsum
• Some text here
• Some text here
Lorem Ipsum
• Some text here
• Some text here
Lorem Ipsum
• Some text here
• Some text here
Lorem Ipsum
• Some text here
• Some text here
Lorem
Ipsum
• Some text here
• Some text here
PowerPoint SmartArt Graphics - The Complete Ready-to-use Collection [2020 updated version]](https://image.slidesharecdn.com/smartart-graphics-complete-collection-2020widescreen-221119174110-d766c0e9/75/SmartArt-Graphics-Complete-Collection-2020-widescreen-pptx-63-2048.jpg)
![Process //
64
VERTICAL PROCESS
Use to show a
progression or
sequential steps in a
task, process, or
workflow from top
to bottom. Works
best with Level 1
text, since the
vertical space is
limited.
Lorem Ipsum
•Some text here
•Some text here
Lorem Ipsum
•Some text here
•Some text here
Lorem Ipsum
•Some text here
•Some text here
Lorem Ipsum
•Some text here
•Some text here
PowerPoint SmartArt Graphics - The Complete Ready-to-use Collection [2020 updated version]](https://image.slidesharecdn.com/smartart-graphics-complete-collection-2020widescreen-221119174110-d766c0e9/75/SmartArt-Graphics-Complete-Collection-2020-widescreen-pptx-64-2048.jpg)
![Process //
65
STAGGERED PROCESS
Use to show a
downward
progression through
stages. Each of the
first five lines of
Level 1 text
corresponds with a
rectangle. Unused
text does not
appear, but remains
available if you
switch layouts.
Lorem Ipsum
•Some text here
•Some text here
Lorem Ipsum
•Some text here
•Some text here
Lorem Ipsum
•Some text here
•Some text here
Lorem Ipsum
•Some text here
•Some text here
Lorem Ipsum
•Some text here
•Some text here
PowerPoint SmartArt Graphics - The Complete Ready-to-use Collection [2020 updated version]](https://image.slidesharecdn.com/smartart-graphics-complete-collection-2020widescreen-221119174110-d766c0e9/75/SmartArt-Graphics-Complete-Collection-2020-widescreen-pptx-65-2048.jpg)
![Process //
66
PROCESS LIST
Use to show
multiple groups of
information or steps
and sub-steps in a
task, process, or
workflow. Level 1
text corresponds to
the top horizontal
shapes, and Level 2
text corresponds to
vertical sub-steps
under each related
top level shape.
Lorem Ipsum
Some text here
Some text here
Some text here
Some text here
Lorem Ipsum
Some text here
Some text here
Some text here
Some text here
Lorem Ipsum
Some text here
Some text here
Some text here
Some text here
Lorem Ipsum
Some text here
Some text here
Some text here
Some text here
Lorem Ipsum
Some text here
Some text here
Some text here
Some text here
PowerPoint SmartArt Graphics - The Complete Ready-to-use Collection [2020 updated version]](https://image.slidesharecdn.com/smartart-graphics-complete-collection-2020widescreen-221119174110-d766c0e9/75/SmartArt-Graphics-Complete-Collection-2020-widescreen-pptx-66-2048.jpg)
![Process //
67
SEGMENTED PROCESS
Use to show a
progression or
sequential steps in a
task, process, or
workflow.
Emphasizes Level 2
text, since each line
appears in a
separate shape.
Lorem Ipsum
Some text here Some text here
Lorem Ipsum
Some text here Some text here
Lorem Ipsum
Some text here Some text here Some text here
Lorem Ipsum
Some text here Some text here Some text here Some text here
PowerPoint SmartArt Graphics - The Complete Ready-to-use Collection [2020 updated version]](https://image.slidesharecdn.com/smartart-graphics-complete-collection-2020widescreen-221119174110-d766c0e9/75/SmartArt-Graphics-Complete-Collection-2020-widescreen-pptx-67-2048.jpg)
![Process //
68
CIRCLE ARROW PROCESS
Use to show
sequential items
with supporting text
for each item. This
diagram works best
with small amounts
of Level 1 text.
•Some text here
•Some text here
Lorem
Ipsum
•Some text here
•Some text here
Lorem
Ipsum
•Some text here
•Some text here
Lorem
Ipsum
•Some text here
•Some text here
Lorem
Ipsum
PowerPoint SmartArt Graphics - The Complete Ready-to-use Collection [2020 updated version]](https://image.slidesharecdn.com/smartart-graphics-complete-collection-2020widescreen-221119174110-d766c0e9/75/SmartArt-Graphics-Complete-Collection-2020-widescreen-pptx-68-2048.jpg)
![Process //
69
BASIC BENDING PROCESS
Use to show a
progression or
sequential steps in a
task, process, or
workflow. Maximizes
both horizontal and
vertical display space
for shapes.
Lorem Ipsum
• Some text here
• Some text here
Lorem Ipsum
• Some text here
• Some text here
Lorem Ipsum
• Some text here
• Some text here
Lorem Ipsum
• Some text here
• Some text here
Lorem Ipsum
• Some text here
• Some text here
PowerPoint SmartArt Graphics - The Complete Ready-to-use Collection [2020 updated version]](https://image.slidesharecdn.com/smartart-graphics-complete-collection-2020widescreen-221119174110-d766c0e9/75/SmartArt-Graphics-Complete-Collection-2020-widescreen-pptx-69-2048.jpg)
![Process //
70
REPEATING BENDING PROCESS
Use to show a
progression or
sequential steps in a
task, process, or
workflow. Maximizes
both horizontal and
vertical display space
for shapes.
Lorem Ipsum
• Some text here
• Some text here
Lorem Ipsum
• Some text here
• Some text here
Lorem Ipsum
• Some text here
• Some text here
Lorem Ipsum
• Some text here
• Some text here
Lorem Ipsum
• Some text here
• Some text here
PowerPoint SmartArt Graphics - The Complete Ready-to-use Collection [2020 updated version]](https://image.slidesharecdn.com/smartart-graphics-complete-collection-2020widescreen-221119174110-d766c0e9/75/SmartArt-Graphics-Complete-Collection-2020-widescreen-pptx-70-2048.jpg)
![Process //
71
VERTICAL BENDING PROCESS
Use to show a
progression or
sequential steps in a
task, process, or
workflow. Maximizes
both horizontal and
vertical display space
for shapes. Places
more emphasis on
the
interrelationships
among the shapes
than on direction or
movement.
Lorem Ipsum
• Some text here
• Some text here
Lorem Ipsum
• Some text here
• Some text here
Lorem Ipsum
• Some text here
• Some text here
Lorem Ipsum
• Some text here
• Some text here
Lorem Ipsum
• Some text here
• Some text here
PowerPoint SmartArt Graphics - The Complete Ready-to-use Collection [2020 updated version]](https://image.slidesharecdn.com/smartart-graphics-complete-collection-2020widescreen-221119174110-d766c0e9/75/SmartArt-Graphics-Complete-Collection-2020-widescreen-pptx-71-2048.jpg)
![Process //
72
DETAILED PROCESS
Use with large
amounts of Level 2
text to show a
progression through
stages.
Lorem
Ipsum
Some text
here
Some text
here
Some text
here
Lorem
Ipsum
Some text
here
Some text
here
Lorem
Ipsum
Some text
here
Some text
here
Lorem
Ipsum
Some text
here
Some text
here
Lorem
Ipsum
Some text
here
Some text
here
PowerPoint SmartArt Graphics - The Complete Ready-to-use Collection [2020 updated version]](https://image.slidesharecdn.com/smartart-graphics-complete-collection-2020widescreen-221119174110-d766c0e9/75/SmartArt-Graphics-Complete-Collection-2020-widescreen-pptx-72-2048.jpg)
![Process //
73
ASCENDING PICTURE ACCENT
PROCESS
Use to show an
ascending series of
pictures with
descriptive text.
Works best with a
small amount of
text.
Lorem Ipsum
• Some text here
• Some text here
Lorem Ipsum
• Some text here
• Some text here
Lorem Ipsum
• Some text here
• Some text here
Lorem Ipsum
• Some text here
• Some text here
PowerPoint SmartArt Graphics - The Complete Ready-to-use Collection [2020 updated version]](https://image.slidesharecdn.com/smartart-graphics-complete-collection-2020widescreen-221119174110-d766c0e9/75/SmartArt-Graphics-Complete-Collection-2020-widescreen-pptx-73-2048.jpg)
![Process //
74
UPWARD ARROW
Use to show a
progression or steps
that trend upward in
a task, process, or
workflow. Each of
the first five lines of
Level 1 text
corresponds to a
point on the arrow.
Works best with
minimal text.
Unused text does
not appear, but
remains available if
you switch layouts.
Lorem
Ipsum
•Some text
here
•Some text
here
Lorem
Ipsum
•Some text here
•Some text here
Lorem Ipsum
•Some text here
•Some text here
Lorem Ipsum
•Some text here
•Some text here
Lorem Ipsum
•Some text here
•Some text here
PowerPoint SmartArt Graphics - The Complete Ready-to-use Collection [2020 updated version]](https://image.slidesharecdn.com/smartart-graphics-complete-collection-2020widescreen-221119174110-d766c0e9/75/SmartArt-Graphics-Complete-Collection-2020-widescreen-pptx-74-2048.jpg)
![Process //
75
DESCENDING PROCESS
Use to show a
descending series of
events. The first
Level 1 text is at the
top of arrow, and
the last Level 1 text
displays at the
bottom of the arrow.
Only the first seven
Level 1 items appear.
Works best with
small to medium
amounts of text.
Lorem Ipsum
•Some text here
•Some text here
Lorem Ipsum
•Some text here
•Some text here
Lorem Ipsum
•Some text here
•Some text here Lorem Ipsum
•Some text here
•Some text here
Lorem Ipsum
•Some text here
•Some text here
PowerPoint SmartArt Graphics - The Complete Ready-to-use Collection [2020 updated version]](https://image.slidesharecdn.com/smartart-graphics-complete-collection-2020widescreen-221119174110-d766c0e9/75/SmartArt-Graphics-Complete-Collection-2020-widescreen-pptx-75-2048.jpg)
![Process //
76
CIRCULAR BENDING PROCESS
Use to show a long
or non-linear
sequence or steps in
a task, process, or
workflow. Works
best with Level 1
text only. Maximizes
both horizontal and
vertical display space
for shapes.
Lorem Ipsum
•Some text here
•Some text here
Lorem Ipsum
•Some text here
•Some text here
Lorem Ipsum
•Some text here
•Some text here
Lorem Ipsum
•Some text here
•Some text here
Lorem Ipsum
•Some text here
•Some text here
PowerPoint SmartArt Graphics - The Complete Ready-to-use Collection [2020 updated version]](https://image.slidesharecdn.com/smartart-graphics-complete-collection-2020widescreen-221119174110-d766c0e9/75/SmartArt-Graphics-Complete-Collection-2020-widescreen-pptx-76-2048.jpg)
![Process //
77
EQUATION
Use to show
sequential steps or
tasks that depict a
plan or result. The
last Level 1 line of
text appears after
the equals sign
(=).Works best with
Level 1 text only.
Lorem Ipsum
•Some text here
•Some text here
Lorem Ipsum
•Some text here
•Some text here
Lorem Ipsum
•Some text here
•Some text here
Lorem Ipsum
•Some text here
•Some text here
PowerPoint SmartArt Graphics - The Complete Ready-to-use Collection [2020 updated version]](https://image.slidesharecdn.com/smartart-graphics-complete-collection-2020widescreen-221119174110-d766c0e9/75/SmartArt-Graphics-Complete-Collection-2020-widescreen-pptx-77-2048.jpg)
![Process //
78
VERTICAL EQUATION
Use to show
sequential steps or
tasks that depict a
plan or result. The
last Level 1 line of
text appears after
the arrow. Works
best with Level 1
text only.
Lorem Ipsum
• Some text here
• Some text here
Lorem Ipsum
• Some text here
• Some text here
Lorem Ipsum
• Some text here
• Some text here
Lorem Ipsum
•Some text here
•Some text here
PowerPoint SmartArt Graphics - The Complete Ready-to-use Collection [2020 updated version]](https://image.slidesharecdn.com/smartart-graphics-complete-collection-2020widescreen-221119174110-d766c0e9/75/SmartArt-Graphics-Complete-Collection-2020-widescreen-pptx-78-2048.jpg)
![Process //
79
ARROW RIBBON
Use to show either
related or
contrasting concepts
with some
connection, such as
opposing forces. The
first two lines of
Level 1 text are used
for text in the
arrows. Unused text
does not appear, but
remains available if
you switch layouts.
Lorem Ipsum
• Some text here
• Some text here
• Some text here
Lorem Ipsum
• Some text here
• Some text here
PowerPoint SmartArt Graphics - The Complete Ready-to-use Collection [2020 updated version]](https://image.slidesharecdn.com/smartart-graphics-complete-collection-2020widescreen-221119174110-d766c0e9/75/SmartArt-Graphics-Complete-Collection-2020-widescreen-pptx-79-2048.jpg)
![Made with by
CYCLE
- 03 -
PowerPoint SmartArt Graphics - The Complete Ready-to-use Collection [2020 updated version]](https://image.slidesharecdn.com/smartart-graphics-complete-collection-2020widescreen-221119174110-d766c0e9/75/SmartArt-Graphics-Complete-Collection-2020-widescreen-pptx-80-2048.jpg)
![Cycle //
81
BASIC CYCLE
Use to represent a
continuing sequence
of stages, tasks, or
events in a circular
flow. Emphasizes the
stages or steps
rather than the
connecting arrows
or flow. Works best
with Level 1 text
only.
Lorem Ipsum
•Some text here
•Some text here
Lorem Ipsum
•Some text here
•Some text here
Lorem Ipsum
•Some text here
•Some text here
Lorem Ipsum
•Some text here
•Some text here
Lorem Ipsum
•Some text here
•Some text here
PowerPoint SmartArt Graphics - The Complete Ready-to-use Collection [2020 updated version]](https://image.slidesharecdn.com/smartart-graphics-complete-collection-2020widescreen-221119174110-d766c0e9/75/SmartArt-Graphics-Complete-Collection-2020-widescreen-pptx-81-2048.jpg)
![Cycle //
82
TEXT CYCLE
Use to represent a
continuing sequence
of stages, tasks, or
events in a circular
flow. Emphasizes the
stages or steps
rather than the
connecting arrows
or flow. Works best
with Level 1 text
only.
Lorem Ipsum
• Some text
here
• Some text
here
Lorem Ipsum
• Some text
here
• Some text
here
Lorem Ipsum
• Some text
here
• Some text
here
Lorem Ipsum
• Some text
here
• Some text
here
Lorem Ipsum
• Some text
here
• Some text
here
PowerPoint SmartArt Graphics - The Complete Ready-to-use Collection [2020 updated version]](https://image.slidesharecdn.com/smartart-graphics-complete-collection-2020widescreen-221119174110-d766c0e9/75/SmartArt-Graphics-Complete-Collection-2020-widescreen-pptx-82-2048.jpg)
![Cycle //
83
BLOCK CYCLE
Use to represent a
continuing sequence
of stages, tasks, or
events in a circular
flow. Emphasizes the
stages or steps
rather than the
connecting arrows
or flow.
Lorem Ipsum
• Some text here
• Some text here
Lorem Ipsum
• Some text here
• Some text here
Lorem Ipsum
• Some text here
• Some text here
Lorem Ipsum
• Some text here
• Some text here
Lorem Ipsum
• Some text here
• Some text here
PowerPoint SmartArt Graphics - The Complete Ready-to-use Collection [2020 updated version]](https://image.slidesharecdn.com/smartart-graphics-complete-collection-2020widescreen-221119174110-d766c0e9/75/SmartArt-Graphics-Complete-Collection-2020-widescreen-pptx-83-2048.jpg)
![Cycle //
84
NONDIRECTIONAL CYCLE
Use to represent a
continuing sequence
of stages, tasks, or
events in a circular
flow. Each shape has
the same level of
importance. Works
well when direction
does not need to be
indicated.
Lorem Ipsum
• Some text here
• Some text here
Lorem Ipsum
• Some text here
• Some text here
Lorem Ipsum
• Some text here
• Some text here
Lorem Ipsum
• Some text here
• Some text here
Lorem Ipsum
• Some text here
• Some text here
PowerPoint SmartArt Graphics - The Complete Ready-to-use Collection [2020 updated version]](https://image.slidesharecdn.com/smartart-graphics-complete-collection-2020widescreen-221119174110-d766c0e9/75/SmartArt-Graphics-Complete-Collection-2020-widescreen-pptx-84-2048.jpg)
![Cycle //
85
CONTINUOUS CYCLE
Use to represent a
continuing sequence
of stages, tasks, or
events in a circular
flow. Emphasizes the
connection between
all components.
Works best with
Level 1 text only.
Lorem Ipsum
• Some text here
• Some text here
Lorem Ipsum
• Some text here
• Some text here
Lorem Ipsum
• Some text here
• Some text here
Lorem Ipsum
• Some text here
• Some text here
Lorem Ipsum
• Some text here
• Some text here
PowerPoint SmartArt Graphics - The Complete Ready-to-use Collection [2020 updated version]](https://image.slidesharecdn.com/smartart-graphics-complete-collection-2020widescreen-221119174110-d766c0e9/75/SmartArt-Graphics-Complete-Collection-2020-widescreen-pptx-85-2048.jpg)
![Cycle //
86
MULTIDIRECTIONAL CYCLE
Use to represent a
continuing sequence
of stages, tasks, or
events that can
occur in any
direction.
Lorem Ipsum
•Some text here
•Some text here
Lorem Ipsum
•Some text here
•Some text here
Lorem Ipsum
•Some text here
•Some text here
Lorem Ipsum
•Some text here
•Some text here
Lorem Ipsum
•Some text here
•Some text here
PowerPoint SmartArt Graphics - The Complete Ready-to-use Collection [2020 updated version]](https://image.slidesharecdn.com/smartart-graphics-complete-collection-2020widescreen-221119174110-d766c0e9/75/SmartArt-Graphics-Complete-Collection-2020-widescreen-pptx-86-2048.jpg)
![Cycle //
87
SEGMENTED CYCLE
Use to show a
progression or a
sequence of stages,
tasks, or events in a
circular flow.
Emphasizes the
interconnected
pieces. Each of the
first seven lines of
Level 1 text
corresponds to a
wedge or pie shape.
Unused text does
not appear, but
remains available if
you switch layouts.
Lorem Ipsum
•Some text here
•Some text here
Lorem Ipsum
•Some text here
•Some text here
Lorem Ipsum
•Some text here
•Some text here
Lorem Ipsum
•Some text here
•Some text here
Lorem Ipsum
•Some text here
•Some text here
PowerPoint SmartArt Graphics - The Complete Ready-to-use Collection [2020 updated version]](https://image.slidesharecdn.com/smartart-graphics-complete-collection-2020widescreen-221119174110-d766c0e9/75/SmartArt-Graphics-Complete-Collection-2020-widescreen-pptx-87-2048.jpg)
![Cycle //
88
BASIC PIE
Use to show how
individual parts form
a whole. The first
seven lines of Level
1 text correspond to
the evenly
distributed wedge or
pie shapes. The top
Level 1 text shape
appears outside of
the rest of the pie
for emphasis.
Unused text does
not appear, but
remains available if
you switch layouts.
Lorem Ipsum
•Some text here
•Some text here
Lorem Ipsum
•Some text here
•Some text here
Lorem Ipsum
•Some text here
•Some text here
Lorem Ipsum
•Some text here
•Some text here
Lorem Ipsum
•Some text here
•Some text here
PowerPoint SmartArt Graphics - The Complete Ready-to-use Collection [2020 updated version]](https://image.slidesharecdn.com/smartart-graphics-complete-collection-2020widescreen-221119174110-d766c0e9/75/SmartArt-Graphics-Complete-Collection-2020-widescreen-pptx-88-2048.jpg)
![Cycle //
89
HEXAGON RADIAL
Use to show a
sequential process
that relates to a
central idea or
theme. Limited to six
Level 2 shapes.
Works best with
small amounts of
text. Unused text
does not appear, but
remains available if
you switch layouts.
Lorem Ipsum
Some text
here
•Some text here
•Some text here
Some text
here
Some text
here
Some text
here
•Some text here
•Some text here
Some text
here
Some text
here
PowerPoint SmartArt Graphics - The Complete Ready-to-use Collection [2020 updated version]](https://image.slidesharecdn.com/smartart-graphics-complete-collection-2020widescreen-221119174110-d766c0e9/75/SmartArt-Graphics-Complete-Collection-2020-widescreen-pptx-89-2048.jpg)
![Cycle //
90
RADIAL CYCLE
Use to show the relationship
to a central idea. Emphasizes
both information in the
center circle and how
information in the outer ring
of circles contributes to the
central idea. The first Level 1
line of text corresponds to
the central circle, and its
Level 2 text corresponds to
the outer ring of circles.
Unused text does not appear,
but remains available if you
switch layouts.
Lorem
Ipsum
Some
text
here
Some
text
here
Some
text
here
Some
text
here
Some
text
here
PowerPoint SmartArt Graphics - The Complete Ready-to-use Collection [2020 updated version]](https://image.slidesharecdn.com/smartart-graphics-complete-collection-2020widescreen-221119174110-d766c0e9/75/SmartArt-Graphics-Complete-Collection-2020-widescreen-pptx-90-2048.jpg)
![Cycle //
91
BASIC RADIAL
Use to show the
relationship to a
central idea in a
cycle. The first line
of Level 1 text
corresponds to the
central shape, and
its Level 2 text
corresponds to the
surrounding circular
shapes. Unused text
does not appear, but
remains available if
you switch layouts.
Lorem
Ipsum
Some
text
here
Some
text
here
Some
text
here
Some
text
here
Some
text
here
PowerPoint SmartArt Graphics - The Complete Ready-to-use Collection [2020 updated version]](https://image.slidesharecdn.com/smartart-graphics-complete-collection-2020widescreen-221119174110-d766c0e9/75/SmartArt-Graphics-Complete-Collection-2020-widescreen-pptx-91-2048.jpg)
![Cycle //
92
DIVERGING RADIAL
Use to show
relationships to a
central idea in a
cycle. The first Level
1 line of text
corresponds to the
central circular
shape. Emphasizes
the surrounding
circles rather than
the central idea.
Unused text does
not appear, but
remains available if
you switch layouts.
Lorem
Ipsum
Some
text
here
Some
text
here
Some
text
here
Some
text
here
Some
text
here
PowerPoint SmartArt Graphics - The Complete Ready-to-use Collection [2020 updated version]](https://image.slidesharecdn.com/smartart-graphics-complete-collection-2020widescreen-221119174110-d766c0e9/75/SmartArt-Graphics-Complete-Collection-2020-widescreen-pptx-92-2048.jpg)
![Cycle //
93
RADIAL VENN
Use to show both
overlapping
relationships and the
relationship to a
central idea in a
cycle. The first line
of Level 1 text
corresponds to the
central shape and
the lines of Level 2
text correspond to
the surrounding
circular shapes.
Unused text does
not appear, but
remains available if
you switch layouts.
Lorem
Ipsum
Some
text
here
Some
text
here
Some
text
here
Some
text
here
Some
text
here
PowerPoint SmartArt Graphics - The Complete Ready-to-use Collection [2020 updated version]](https://image.slidesharecdn.com/smartart-graphics-complete-collection-2020widescreen-221119174110-d766c0e9/75/SmartArt-Graphics-Complete-Collection-2020-widescreen-pptx-93-2048.jpg)
![Cycle //
94
GEAR
Use to show
interlocking ideas.
Each of the first
three lines of Level 1
text corresponds to
a gear shape, and
their corresponding
Level 2 text appears
in rectangles next to
the gear shape.
Unused text does
not appear, but
remains available if
you switch layouts.
Lorem Ipsum
•Some text here
•Some text here
•Some text here
Lorem
Ipsum
•Some text here
•Some text here
•Some text here
Lorem
Ipsum
•Some text here
•Some text here
•Some text here
PowerPoint SmartArt Graphics - The Complete Ready-to-use Collection [2020 updated version]](https://image.slidesharecdn.com/smartart-graphics-complete-collection-2020widescreen-221119174110-d766c0e9/75/SmartArt-Graphics-Complete-Collection-2020-widescreen-pptx-94-2048.jpg)
![Cycle //
95
RADIAL CLUSTER
Use to show data
that relates to a
central idea or
theme. The top
Level 1 text appears
in the center. Level 2
text appears in
surrounding shapes.
Can contain up to
seven Level 2
shapes. Unused text
does not appear, but
remains available if
you switch layouts.
Works best with
small amounts of
text.
Lorem
Ipsum
Some
text
here
Some
text
here
Some
text
here
Some
text
here
Some
text
here
PowerPoint SmartArt Graphics - The Complete Ready-to-use Collection [2020 updated version]](https://image.slidesharecdn.com/smartart-graphics-complete-collection-2020widescreen-221119174110-d766c0e9/75/SmartArt-Graphics-Complete-Collection-2020-widescreen-pptx-95-2048.jpg)
![Made with by
HIERARCHY
- 04 -
PowerPoint SmartArt Graphics - The Complete Ready-to-use Collection [2020 updated version]](https://image.slidesharecdn.com/smartart-graphics-complete-collection-2020widescreen-221119174110-d766c0e9/75/SmartArt-Graphics-Complete-Collection-2020-widescreen-pptx-96-2048.jpg)
![Hierarchy //
97
ORGANIZATION CHART
Use to show
hierarchical
information or
reporting
relationships in an
organization. The
assistant shape and
the Org Chart
hanging layouts are
available with this
layout.
Lorem
Ipsum
Some text
here
Some text
here
Some text
here
Some text
here
Some text
here
Some text
here
Some text
here
Lorem
Ipsum
Some text
here
Some text
here
Some text
here
Some text
here
Some text
here
PowerPoint SmartArt Graphics - The Complete Ready-to-use Collection [2020 updated version]](https://image.slidesharecdn.com/smartart-graphics-complete-collection-2020widescreen-221119174110-d766c0e9/75/SmartArt-Graphics-Complete-Collection-2020-widescreen-pptx-97-2048.jpg)
![Hierarchy //
98
PICTURE ORGANIZATION CHART
Use to show
hierarchical
information or
reporting
relationships in an
organization, with
corresponding
pictures. The
assistant shape and
the Org Chart
hanging layouts are
available with this
layout.
Lorem
Ipsum
Some
text here
Some
text here
Some
text here
Some
text here
Some
text here
Some
text here
Some
text here
Lorem
Ipsum
Some
text here
Some
text here
Some
text here
Some
text here
Some
text here
PowerPoint SmartArt Graphics - The Complete Ready-to-use Collection [2020 updated version]](https://image.slidesharecdn.com/smartart-graphics-complete-collection-2020widescreen-221119174110-d766c0e9/75/SmartArt-Graphics-Complete-Collection-2020-widescreen-pptx-98-2048.jpg)
![Hierarchy //
99
NAME AND TITLE
ORGANIZATION CHART
Use to show
hierarchical
information or
reporting
relationships in an
organization. To
enter text in the title
box, type directly in
the smaller
rectangular shape.
The assistant shape
and Org Chart
hanging layouts are
available with this
layout.
Lorem
Ipsum
Some text
here
Some text
here
Some text
here
Some text
here
Some text
here
Lorem
Ipsum
Some text
here
Some text
here
Some text
here
Some text
here
Some text
here
PowerPoint SmartArt Graphics - The Complete Ready-to-use Collection [2020 updated version]](https://image.slidesharecdn.com/smartart-graphics-complete-collection-2020widescreen-221119174110-d766c0e9/75/SmartArt-Graphics-Complete-Collection-2020-widescreen-pptx-99-2048.jpg)
![Hierarchy //
100
HALF CIRCLE
ORGANIZATION CHART
Use to show
hierarchical
information or
reporting
relationships in an
organization. The
assistant shapes and
Org Chart hanging
layouts are available
with this layout.
Lorem Ipsum
Some text here
Some text here
Some text here
Some text here
Some text here
Some text here Some text here
Lorem Ipsum
Some text here Some text here
Some text here
Some text here
Some text here
PowerPoint SmartArt Graphics - The Complete Ready-to-use Collection [2020 updated version]](https://image.slidesharecdn.com/smartart-graphics-complete-collection-2020widescreen-221119174110-d766c0e9/75/SmartArt-Graphics-Complete-Collection-2020-widescreen-pptx-100-2048.jpg)
![Hierarchy //
101
CIRCLE PICTURE HIERARCHY
Use to show
hierarchical
information or
reporting
relationships in an
organization.
Pictures appear in
circles and
corresponding text
appears next to the
pictures.
Lorem
Ipsum
Some
text here
Some
text here
Some
text here
Some
text here
Some
text here
Some
text here
Some
text here
PowerPoint SmartArt Graphics - The Complete Ready-to-use Collection [2020 updated version]](https://image.slidesharecdn.com/smartart-graphics-complete-collection-2020widescreen-221119174110-d766c0e9/75/SmartArt-Graphics-Complete-Collection-2020-widescreen-pptx-101-2048.jpg)
![Hierarchy //
102
HIERARCHY
Use to show
hierarchical
relationships
progressing from top
to bottom.
Lorem
Ipsum
Some
text here
Some
text here
Some
text here
Some
text here
Some
text here
Some
text here
Some
text here
PowerPoint SmartArt Graphics - The Complete Ready-to-use Collection [2020 updated version]](https://image.slidesharecdn.com/smartart-graphics-complete-collection-2020widescreen-221119174110-d766c0e9/75/SmartArt-Graphics-Complete-Collection-2020-widescreen-pptx-102-2048.jpg)
![Hierarchy //
103
LABELED HIERARCHY
Use to show
hierarchical
relationships
progressing from top
to bottom and
grouped
hierarchically.
Emphasizes heading
or level 1 text. The
first line of Level 1
text appears in the
shape at the
beginning of the
hierarchy, and all
subsequent lines of
Level 1 text appear
to the left of the
long rectangles.
Lorem Ipsum
•Some text here
•Some text here
•Some text here
Lorem Ipsum
•Some text here
•Some text here
Lorem
Ipsum
Some
text here
Some
text here
Some
text here
Some
text here
Some
text here
Some
text here
PowerPoint SmartArt Graphics - The Complete Ready-to-use Collection [2020 updated version]](https://image.slidesharecdn.com/smartart-graphics-complete-collection-2020widescreen-221119174110-d766c0e9/75/SmartArt-Graphics-Complete-Collection-2020-widescreen-pptx-103-2048.jpg)
![Hierarchy //
104
TABLE HIERARCHY
Use to show groups
of information built
from top to bottom,
and the hierarchies
within each group.
This layout does not
contain connecting
lines.
Lorem Ipsum
Some text here
Some text
here
Some text
here
Some text
here
Some text
here
Some text
here
Some text
here
PowerPoint SmartArt Graphics - The Complete Ready-to-use Collection [2020 updated version]](https://image.slidesharecdn.com/smartart-graphics-complete-collection-2020widescreen-221119174110-d766c0e9/75/SmartArt-Graphics-Complete-Collection-2020-widescreen-pptx-104-2048.jpg)
![Hierarchy //
105
HORIZONTAL ORGANIZATION
CHART
Use to show
hierarchical
information
horizontally or
reporting
relationships in an
organization. The
assistant shape and
the Org Chart
hanging layouts are
available with this
layout.
Lorem Ipsum
Some text here
Some text here
Some text here Some text here
Some text here
Some text here Some text here
PowerPoint SmartArt Graphics - The Complete Ready-to-use Collection [2020 updated version]](https://image.slidesharecdn.com/smartart-graphics-complete-collection-2020widescreen-221119174110-d766c0e9/75/SmartArt-Graphics-Complete-Collection-2020-widescreen-pptx-105-2048.jpg)
![Hierarchy //
106
HORIZONTAL MULTILEVEL
HIERARCHY
Use to show large
amounts of
hierarchical
information
progressing
horizontally. The top
of the hierarchy is
displayed vertically.
This layout supports
many levels in the
hierarchy.
Lorem
Ipsum
Some text here
Some text here
Some text here Some text here
Some text here
Some text here Some text here
PowerPoint SmartArt Graphics - The Complete Ready-to-use Collection [2020 updated version]](https://image.slidesharecdn.com/smartart-graphics-complete-collection-2020widescreen-221119174110-d766c0e9/75/SmartArt-Graphics-Complete-Collection-2020-widescreen-pptx-106-2048.jpg)
![Hierarchy //
107
HORIZONTAL HIERARCHY
Use to show
hierarchical
relationships
progressing
horizontally. Works
well for decision
trees.
Lorem
Ipsum
Some text
here
Some text
here
Some text
here
Some text
here
Some text
here
Some text
here
Some text
here
PowerPoint SmartArt Graphics - The Complete Ready-to-use Collection [2020 updated version]](https://image.slidesharecdn.com/smartart-graphics-complete-collection-2020widescreen-221119174110-d766c0e9/75/SmartArt-Graphics-Complete-Collection-2020-widescreen-pptx-107-2048.jpg)
![Hierarchy //
108
HORIZONTAL LABELED
HIERARCHY
Use to show hierarchical
relationships progressing
horizontally and grouped
hierarchically.
Emphasizes heading or
level 1 text. The first line
of Level 1 text appears in
the shape at the
beginning of the
hierarchy, and the
second and all
subsequent lines of Level
1 text appear at the top
of the tall rectangles.
Lorem Ipsum
•Some text here
•Some text here
•Some text here
Lorem Ipsum
•Some text here
•Some text here
Lorem
Ipsum
Some text
here
Some text
here
Some text
here
Some text
here
Some text
here
Some text
here
PowerPoint SmartArt Graphics - The Complete Ready-to-use Collection [2020 updated version]](https://image.slidesharecdn.com/smartart-graphics-complete-collection-2020widescreen-221119174110-d766c0e9/75/SmartArt-Graphics-Complete-Collection-2020-widescreen-pptx-108-2048.jpg)
![Made with by
RELATIONSHIP
- 05 -
PowerPoint SmartArt Graphics - The Complete Ready-to-use Collection [2020 updated version]](https://image.slidesharecdn.com/smartart-graphics-complete-collection-2020widescreen-221119174110-d766c0e9/75/SmartArt-Graphics-Complete-Collection-2020-widescreen-pptx-109-2048.jpg)
![Relationship //
110
BALANCE
Use to compare or show the
relationship between two
ideas. Each of the first two
lines of Level 1 text
corresponds to text at the
top of one side of the center
point. Emphasizes Level 2
text, which is limited to four
shapes on each side of the
center point. The balance
tips towards the side with
the most shapes containing
Level 2 text. Unused text
does not appear, but remains
available if you switch
layouts.
Lorem
Ipsum
Lorem
Ipsum
PowerPoint SmartArt Graphics - The Complete Ready-to-use Collection [2020 updated version]](https://image.slidesharecdn.com/smartart-graphics-complete-collection-2020widescreen-221119174110-d766c0e9/75/SmartArt-Graphics-Complete-Collection-2020-widescreen-pptx-110-2048.jpg)
![Relationship //
111
CIRCLE RELATIONSHIP
Use to show the
relationship to or
from a central idea.
Level 2 text is added
non-sequentially and
is limited to five
items. There can
only be one Level 1
item.
Lorem Ipsum
Some
text
here
Some
text
here
Some
text
here
Some
text
here
Lorem
Ipsum
PowerPoint SmartArt Graphics - The Complete Ready-to-use Collection [2020 updated version]](https://image.slidesharecdn.com/smartart-graphics-complete-collection-2020widescreen-221119174110-d766c0e9/75/SmartArt-Graphics-Complete-Collection-2020-widescreen-pptx-111-2048.jpg)
![Relationship //
112
FUNNEL
Use to show the filtering
of information or how
parts merge into a whole.
Emphasizes the final
outcome. Can contain up
to four lines of Level 1
text; the last of these four
Level 1 text lines appears
below the funnel and the
other lines correspond to
a circular shape. Unused
text does not appear, but
remains available if you
switch layouts.
Lorem Ipsum
•Some text here
•Some text here
Some
text
here
Some
text
here
Some
text
here
PowerPoint SmartArt Graphics - The Complete Ready-to-use Collection [2020 updated version]](https://image.slidesharecdn.com/smartart-graphics-complete-collection-2020widescreen-221119174110-d766c0e9/75/SmartArt-Graphics-Complete-Collection-2020-widescreen-pptx-112-2048.jpg)
![Relationship //
113
OPPOSING IDEAS
Use to show two
opposing or
contrasting ideas.
Can have one or two
Level 1 items. Each
Level 1 text can
contain multiple
sub-levels. Works
well with large
amounts of text.
Some text here
Some text here
Some text here
Some text here
Some text here
Some text here
Some text here
Some text here
Some text here
Some text here
Lorem
Ipsum
Lorem
Ipsum
PowerPoint SmartArt Graphics - The Complete Ready-to-use Collection [2020 updated version]](https://image.slidesharecdn.com/smartart-graphics-complete-collection-2020widescreen-221119174110-d766c0e9/75/SmartArt-Graphics-Complete-Collection-2020-widescreen-pptx-113-2048.jpg)
![Relationship //
114
PLUS AND MINUS
Use to show the
pros and cons of
two ideas. Each
Level 1 text can
contain multiple
sub-levels. Works
well with large
amounts of text.
Limited to two Level
1 items.
Lorem Ipsum
• Some text here
• Some text here
• Some text here
• Some text here
• Some text here
• Some text here
Lorem Ipsum
• Some text here
• Some text here
• Some text here
• Some text here
• Some text here
PowerPoint SmartArt Graphics - The Complete Ready-to-use Collection [2020 updated version]](https://image.slidesharecdn.com/smartart-graphics-complete-collection-2020widescreen-221119174110-d766c0e9/75/SmartArt-Graphics-Complete-Collection-2020-widescreen-pptx-114-2048.jpg)
![Relationship //
115
REVERSE LIST
Use to change
between two items.
Only the first two
items of text display,
and each item can
contain a large
amount of text.
Works well to show
a change between
two items or shift in
order.
Lorem Ipsum
•Some text here
•Some text here
•Some text here
•Some text here
•Some text here
•Some text here
Lorem Ipsum
•Some text here
•Some text here
•Some text here
•Some text here
•Some text here
PowerPoint SmartArt Graphics - The Complete Ready-to-use Collection [2020 updated version]](https://image.slidesharecdn.com/smartart-graphics-complete-collection-2020widescreen-221119174110-d766c0e9/75/SmartArt-Graphics-Complete-Collection-2020-widescreen-pptx-115-2048.jpg)
![Relationship //
116
COUNTERBALANCE ARROWS
Use to show two
opposing ideas or
concepts. Each of
the first two lines of
Level 1 text
corresponds to an
arrow and works
well with Level 2
text. Unused text
does not appear, but
remains available if
you switch layouts.
Lorem Ipsum
•Some text here
•Some text here
•Some text here
•Some text here
•Some text here
Lorem Ipsum
•Some text here
•Some text here
•Some text here
•Some text here
•Some text here
PowerPoint SmartArt Graphics - The Complete Ready-to-use Collection [2020 updated version]](https://image.slidesharecdn.com/smartart-graphics-complete-collection-2020widescreen-221119174110-d766c0e9/75/SmartArt-Graphics-Complete-Collection-2020-widescreen-pptx-116-2048.jpg)
![Relationship //
117
CONVERGING ARROWS
Use to show ideas or
concepts that
converge to a central
point. Works best
with Level 1 text
only.
Lorem
Ipsum
•Some text
here
•Some text
here
Lorem Ipsum
•Some text here
•Some text here
Lorem
Ipsum
•Some text
here
•Some text
here
Lorem Ipsum
•Some text here
•Some text here
PowerPoint SmartArt Graphics - The Complete Ready-to-use Collection [2020 updated version]](https://image.slidesharecdn.com/smartart-graphics-complete-collection-2020widescreen-221119174110-d766c0e9/75/SmartArt-Graphics-Complete-Collection-2020-widescreen-pptx-117-2048.jpg)
![Relationship //
118
DIVERGING ARROWS
Use to show ideas or
concepts that
progress outward
from a central
source. Works best
with Level 1 text
only.
Lorem
Ipsum
•Some text
here
•Some text
here
Lorem Ipsum
•Some text here
•Some text here
Lorem
Ipsum
•Some text
here
•Some text
here
Lorem Ipsum
•Some text here
•Some text here
PowerPoint SmartArt Graphics - The Complete Ready-to-use Collection [2020 updated version]](https://image.slidesharecdn.com/smartart-graphics-complete-collection-2020widescreen-221119174110-d766c0e9/75/SmartArt-Graphics-Complete-Collection-2020-widescreen-pptx-118-2048.jpg)
![Relationship //
119
OPPOSING ARROWS
Use to show two
opposing ideas, or
ideas that diverge
from a central point.
Each of the first two
lines of Level 1 text
corresponds to an
arrow. Unused text
does not appear, but
remains available if
you switch layouts.
Lorem Ipsum
• Some text here
• Some text here
• Some text here
• Some text here
• Some text here
Lorem Ipsum
• Some text here
• Some text here
• Some text here
• Some text here
PowerPoint SmartArt Graphics - The Complete Ready-to-use Collection [2020 updated version]](https://image.slidesharecdn.com/smartart-graphics-complete-collection-2020widescreen-221119174110-d766c0e9/75/SmartArt-Graphics-Complete-Collection-2020-widescreen-pptx-119-2048.jpg)
![Relationship //
120
TABBED ARC
Use to show a set of
related items arcing
over a common
area. Best with
small amounts of
text.
PowerPoint SmartArt Graphics - The Complete Ready-to-use Collection [2020 updated version]](https://image.slidesharecdn.com/smartart-graphics-complete-collection-2020widescreen-221119174110-d766c0e9/75/SmartArt-Graphics-Complete-Collection-2020-widescreen-pptx-120-2048.jpg)
![Relationship //
121
BASIC TARGET
Use to show
containment,
gradations, or
hierarchical
relationships. The
first five lines of
Level 1 text are
associated with a
circle. Unused text
does not appear, but
remains available if
you switch layouts.
Lorem Ipsum
• Some text here
• Some text here
Lorem Ipsum
• Some text here
• Some text here
Lorem Ipsum
• Some text here
• Some text here
Lorem Ipsum
• Some text here
• Some text here
PowerPoint SmartArt Graphics - The Complete Ready-to-use Collection [2020 updated version]](https://image.slidesharecdn.com/smartart-graphics-complete-collection-2020widescreen-221119174110-d766c0e9/75/SmartArt-Graphics-Complete-Collection-2020-widescreen-pptx-121-2048.jpg)
![Relationship //
122
BASIC VENN
Use to show overlapping
or interconnected
relationships. The first
seven lines of Level 1
text correspond with a
circle. If there are four or
fewer lines of Level 1
text, the text is inside
the circles. If there are
more than four lines of
Level 1 text, the text is
outside of the circles.
Unused text does not
appear, but remains
available if you switch
layouts.
Lorem Ipsum
•Some text here
•Some text here
•Some text here
Lorem
Ipsum
•Some text here
•Some text here
•Some text here
Lorem Ipsum
•Some text here
•Some text here
•Some text here
Lorem
Ipsum
•Some text here
•Some text here
•Some text here
PowerPoint SmartArt Graphics - The Complete Ready-to-use Collection [2020 updated version]](https://image.slidesharecdn.com/smartart-graphics-complete-collection-2020widescreen-221119174110-d766c0e9/75/SmartArt-Graphics-Complete-Collection-2020-widescreen-pptx-122-2048.jpg)
![Relationship //
123
LINEAR VENN
Use to show
overlapping
relationships in a
sequence. Works
best with Level 1
text only.
Lorem Ipsum
• Some text here
• Some text here
• Some text here
Lorem Ipsum
• Some text here
• Some text here
• Some text here
Lorem Ipsum
• Some text here
• Some text here
• Some text here
Lorem Ipsum
• Some text here
• Some text here
• Some text here
PowerPoint SmartArt Graphics - The Complete Ready-to-use Collection [2020 updated version]](https://image.slidesharecdn.com/smartart-graphics-complete-collection-2020widescreen-221119174110-d766c0e9/75/SmartArt-Graphics-Complete-Collection-2020-widescreen-pptx-123-2048.jpg)
![Relationship //
124
STACKED VENN
Use to show
overlapping
relationships. A good
choice for
emphasizing growth
or gradation. Works
best with Level 1
text only. The first
seven lines of Level
1 text correspond to
a circular shape.
Unused text does
not appear, but
remains available if
you switch layouts.
Lorem
Ipsum
Lorem
Ipsum
Lorem
Ipsum
Lorem
Ipsum
PowerPoint SmartArt Graphics - The Complete Ready-to-use Collection [2020 updated version]](https://image.slidesharecdn.com/smartart-graphics-complete-collection-2020widescreen-221119174110-d766c0e9/75/SmartArt-Graphics-Complete-Collection-2020-widescreen-pptx-124-2048.jpg)
![Relationship //
125
INTERCONNECTED RINGS
Use to show
overlapping or
interconnected ideas
or concepts. The first
seven lines of Level
1 text correspond
with a circle. Unused
text does not
appear, but remains
available if you
switch layouts.
Lorem Ipsum
• Some text here
• Some text here
• Some text here
Lorem Ipsum
• Some text here
• Some text here
• Some text here
Lorem Ipsum
• Some text here
• Some text here
• Some text here
Lorem Ipsum
• Some text here
• Some text here
• Some text here
Lorem Ipsum
• Some text here
• Some text here
• Some text here
PowerPoint SmartArt Graphics - The Complete Ready-to-use Collection [2020 updated version]](https://image.slidesharecdn.com/smartart-graphics-complete-collection-2020widescreen-221119174110-d766c0e9/75/SmartArt-Graphics-Complete-Collection-2020-widescreen-pptx-125-2048.jpg)
![Picture //
126
CONVERGING RADIAL
Use to show
relationships of
concepts or
components to a
central idea in a
cycle. The first line
of Level 1 text
corresponds to the
central circular
shape and the lines
of Level 2 text
correspond to the
surrounding
rectangular shapes.
Unused text does
not appear, but
remains available if
you switch layouts.
Lorem
Ipsum
Lorem Ipsum
• Some text here
• Some text here
Lorem Ipsum
• Some text here
• Some text here
Lorem Ipsum
• Some text here
• Some text here
• Some text here
Lorem Ipsum
Lorem Ipsum
• Some text here
• Some text here
PowerPoint SmartArt Graphics - The Complete Ready-to-use Collection [2020 updated version]](https://image.slidesharecdn.com/smartart-graphics-complete-collection-2020widescreen-221119174110-d766c0e9/75/SmartArt-Graphics-Complete-Collection-2020-widescreen-pptx-126-2048.jpg)
![Picture //
127
RADIAL LIST
Use to show
relationships to a
central idea in a
cycle. The center
shape can contain a
picture. Level 1 text
appears in the
smaller circles and
any related Level 2
text appears to the
side of the smaller
circles.
Lorem
Ipsum
•Some text here
•Some text here
•Some text here
Lorem
Ipsum
Lorem
Ipsum
•Some text here
•Some text here
Lorem
Ipsum
•Some text here
PowerPoint SmartArt Graphics - The Complete Ready-to-use Collection [2020 updated version]](https://image.slidesharecdn.com/smartart-graphics-complete-collection-2020widescreen-221119174110-d766c0e9/75/SmartArt-Graphics-Complete-Collection-2020-widescreen-pptx-127-2048.jpg)
![Made with by
MATRIX
- 06 -
PowerPoint SmartArt Graphics - The Complete Ready-to-use Collection [2020 updated version]](https://image.slidesharecdn.com/smartart-graphics-complete-collection-2020widescreen-221119174110-d766c0e9/75/SmartArt-Graphics-Complete-Collection-2020-widescreen-pptx-128-2048.jpg)
![Matrix //
129
BASIC MATRIX
Use to show the
relationship of
components to a
whole in quadrants.
The first four lines of
Level 1 text appear
in the quadrants.
Unused text does
not appear, but
remains available if
you switch layouts.
PowerPoint SmartArt Graphics - The Complete Ready-to-use Collection [2020 updated version]
Lorem Ipsum
•Some text here
•Some text here
•Some text here
Lorem Ipsum
•Some text here
•Some text here
•Some text here
Lorem Ipsum
•Some text here
•Some text here
•Some text here
Lorem Ipsum
•Some text here
•Some text here
•Some text here](https://image.slidesharecdn.com/smartart-graphics-complete-collection-2020widescreen-221119174110-d766c0e9/75/SmartArt-Graphics-Complete-Collection-2020-widescreen-pptx-129-2048.jpg)
![Matrix //
130
TITLED MATRIX
Use to show the
relationships of four
quadrants to a
whole. The first line
of Level 1 text
corresponds to the
central shape, and
the first four lines of
Level 2 text appear
in the quadrants.
Unused text does
not appear, but
remains available if
you switch layouts.
PowerPoint SmartArt Graphics - The Complete Ready-to-use Collection [2020 updated version]
Some text here
• Some text here
• Some text here
• Some text here
Some text here
• Some text here
• Some text here
• Some text here
Some text here
• Some text here
• Some text here
• Some text here
Some text here
• Some text here
• Some text here
• Some text here
Lorem
Ipsum](https://image.slidesharecdn.com/smartart-graphics-complete-collection-2020widescreen-221119174110-d766c0e9/75/SmartArt-Graphics-Complete-Collection-2020-widescreen-pptx-130-2048.jpg)
![Matrix //
131
GRID MATRIX
Use to show the
placement of
concepts along two
axes. Emphasizes the
individual
components rather
than the whole. The
first four lines of
Level 1 text appear
in the quadrants.
Unused text does
not appear, but
remains available if
you switch layouts.
PowerPoint SmartArt Graphics - The Complete Ready-to-use Collection [2020 updated version]
Lorem Ipsum
•Some text here
•Some text here
•Some text here
Lorem Ipsum
•Some text here
•Some text here
•Some text here
Lorem Ipsum
•Some text here
•Some text here
•Some text here
Lorem Ipsum
•Some text here
•Some text here
•Some text here](https://image.slidesharecdn.com/smartart-graphics-complete-collection-2020widescreen-221119174110-d766c0e9/75/SmartArt-Graphics-Complete-Collection-2020-widescreen-pptx-131-2048.jpg)
![Matrix //
132
CYCLE MATRIX
Use to show the
relationship to a
central idea in a
cyclical progression.
Each of the first four
lines of Level 1 text
corresponds to a
wedge or pie shape,
and Level 2 text
appears in a
rectangular shape to
the side of the
wedge or pie shape.
Unused text does
not appear, but
remains available if
you switch layouts.
PowerPoint SmartArt Graphics - The Complete Ready-to-use Collection [2020 updated version]
•Some text here
•Some text here
•Some text here
•Some text here
•Some text here
•Some text here
•Some text here
•Some text here
•Some text here
•Some text here
•Some text here
•Some text here
Lorem
Ipsum
Lorem
Ipsum
Lorem
Ipsum
Lorem
Ipsum](https://image.slidesharecdn.com/smartart-graphics-complete-collection-2020widescreen-221119174110-d766c0e9/75/SmartArt-Graphics-Complete-Collection-2020-widescreen-pptx-132-2048.jpg)
![Made with by
PYRAMID
- 07 -
PowerPoint SmartArt Graphics - The Complete Ready-to-use Collection [2020 updated version]](https://image.slidesharecdn.com/smartart-graphics-complete-collection-2020widescreen-221119174110-d766c0e9/75/SmartArt-Graphics-Complete-Collection-2020-widescreen-pptx-133-2048.jpg)
![Pyramid //
134
BASIC PYRAMID
Use to show
proportional,
interconnected, or
hierarchical
relationships with
the largest
component on the
bottom and
narrowing up. Level
1 text appears in the
pyramid segments
and Level 2 text
appears in shapes
alongside each
segment.
• Some text here
• Some text here
• Some text here
Lorem
Ipsum
• Some text here
• Some text here
• Some text here
Lorem
Ipsum
• Some text here
• Some text here
• Some text here
Lorem Ipsum
• Some text here
• Some text here
• Some text here
Lorem Ipsum
PowerPoint SmartArt Graphics - The Complete Ready-to-use Collection [2020 updated version]](https://image.slidesharecdn.com/smartart-graphics-complete-collection-2020widescreen-221119174110-d766c0e9/75/SmartArt-Graphics-Complete-Collection-2020-widescreen-pptx-134-2048.jpg)
![Pyramid //
135
INVERTED PYRAMID
Use to show
proportional,
interconnected, or
hierarchical
relationships with
the largest
component on the
top and narrowing
down. Level 1 text
appears in the
pyramid segments
and Level 2 text
appears in shapes
alongside each
segment.
• Some text here
• Some text here
• Some text here
Lorem Ipsum
• Some text here
• Some text here
• Some text here
Lorem Ipsum
• Some text here
• Some text here
• Some text here
Lorem
Ipsum
• Some text here
• Some text here
• Some text here
Lorem
Ipsum
PowerPoint SmartArt Graphics - The Complete Ready-to-use Collection [2020 updated version]](https://image.slidesharecdn.com/smartart-graphics-complete-collection-2020widescreen-221119174110-d766c0e9/75/SmartArt-Graphics-Complete-Collection-2020-widescreen-pptx-135-2048.jpg)
![Pyramid //
136
PYRAMID LIST
Use to show
proportional,
interconnected, or
hierarchical
relationships. Text
appears in the
rectangular shapes
on top of the
pyramid
background.
Lorem Ipsum
•Some text here
•Some text here
•Some text here
Lorem Ipsum
•Some text here
•Some text here
•Some text here
Lorem Ipsum
•Some text here
•Some text here
•Some text here
Lorem Ipsum
•Some text here
•Some text here
•Some text here
PowerPoint SmartArt Graphics - The Complete Ready-to-use Collection [2020 updated version]](https://image.slidesharecdn.com/smartart-graphics-complete-collection-2020widescreen-221119174110-d766c0e9/75/SmartArt-Graphics-Complete-Collection-2020-widescreen-pptx-136-2048.jpg)
![Pyramid //
137
SEGMENTED PYRAMID
Use to show
containment,
proportional, or
interconnected
relationships. The
first nine lines of
Level 1 text appear
in the triangular
shapes. Unused text
does not appear, but
remains available if
you switch layouts.
Works best with
Level 1 text only.
Lorem Ipsum
•Some text here
•Some text here
•Some text here
Lorem Ipsum
•Some text here
•Some text here
•Some text here
Lorem Ipsum
•Some text here
•Some text here
•Some text here
Lorem Ipsum
•Some text here
•Some text here
•Some text here
PowerPoint SmartArt Graphics - The Complete Ready-to-use Collection [2020 updated version]](https://image.slidesharecdn.com/smartart-graphics-complete-collection-2020widescreen-221119174110-d766c0e9/75/SmartArt-Graphics-Complete-Collection-2020-widescreen-pptx-137-2048.jpg)
![Made with by
PICTURE
- 08 -
PowerPoint SmartArt Graphics - The Complete Ready-to-use Collection [2020 updated version]](https://image.slidesharecdn.com/smartart-graphics-complete-collection-2020widescreen-221119174110-d766c0e9/75/SmartArt-Graphics-Complete-Collection-2020-widescreen-pptx-138-2048.jpg)
![Picture //
139
ACCENTED PICTURE
Use to show a
central,
photographic idea
with related ideas on
the side. The top
Level 1 text appears
over the central
picture.
Corresponding text
for other Level 1
shapes appear next
to the small circular
pictures. This layout
also works well with
no text.
Lorem Ipsum
Some text here
• Some text here
• Some text here
• Some text here
Some text here
Some text here
• Some text here
• Some text here
Some text here
PowerPoint SmartArt Graphics - The Complete Ready-to-use Collection [2020 updated version]](https://image.slidesharecdn.com/smartart-graphics-complete-collection-2020widescreen-221119174110-d766c0e9/75/SmartArt-Graphics-Complete-Collection-2020-widescreen-pptx-139-2048.jpg)
![Picture //
140
CIRCULAR PICTURE CALLOUT
Use to show a
central idea and sub-
ideas or related
items. The text for
the first picture
covers the lower
portion of the
picture. The
corresponding text
for other Level 1
shapes appears next
to the small circular
pictures. This
diagram also works
well with no text.
Lorem
Ipsum
Lorem Ipsum
• Some text here
• Some text here
• Some text here
Lorem
Ipsum
Lorem
Ipsum
Lorem
Ipsum
PowerPoint SmartArt Graphics - The Complete Ready-to-use Collection [2020 updated version]](https://image.slidesharecdn.com/smartart-graphics-complete-collection-2020widescreen-221119174110-d766c0e9/75/SmartArt-Graphics-Complete-Collection-2020-widescreen-pptx-140-2048.jpg)
![Picture //
141
RADIAL PICTURE LIST
Use to show
relationships to a
central idea. The
Level 1 shape
contains text and all
Level 2 shapes
contain a picture
with corresponding
text. Limited to four
Level 2 pictures.
Unused pictures do
not appear, but
remain available if
you switch layouts.
Works best with a
small amount of
Level 2 text.
Lorem
Ipsum
Some
text here
Some
text here
Some
text here
Some
text here
PowerPoint SmartArt Graphics - The Complete Ready-to-use Collection [2020 updated version]](https://image.slidesharecdn.com/smartart-graphics-complete-collection-2020widescreen-221119174110-d766c0e9/75/SmartArt-Graphics-Complete-Collection-2020-widescreen-pptx-141-2048.jpg)
![Picture //
142
SNAPSHOT PICTURE LIST
Use to show pictures
with explanatory
text. Level 2 text can
display lists of
information. Works
well with a large
amount of text.
Lorem Ipsum
Lorem ipsum dolor sit
amet, consectetur
adipiscing elit, sed do
eiusmod tempor
incididunt ut labore et
dolore magna aliqua.
Ut enim ad minim
veniam, quis nostrud
exercitation ullamco
laboris nisi ut aliquip ex
ea commodo
consequat.
Lorem Ipsum
Lorem ipsum dolor sit
amet, consectetur
adipiscing elit, sed do
eiusmod tempor
incididunt ut labore et
dolore magna aliqua.
Ut enim ad minim
veniam, quis nostrud
exercitation ullamco
laboris nisi ut aliquip ex
ea commodo
consequat.
PowerPoint SmartArt Graphics - The Complete Ready-to-use Collection [2020 updated version]](https://image.slidesharecdn.com/smartart-graphics-complete-collection-2020widescreen-221119174110-d766c0e9/75/SmartArt-Graphics-Complete-Collection-2020-widescreen-pptx-142-2048.jpg)
![Picture //
143
SPIRAL PICTURE
Use to show a series
of up to five pictures
with corresponding
Level 1 captions that
spiral in to the
center.
Lorem Ipsum Lorem Ipsum Lorem Ipsum Lorem Ipsum Lorem Ipsum
PowerPoint SmartArt Graphics - The Complete Ready-to-use Collection [2020 updated version]](https://image.slidesharecdn.com/smartart-graphics-complete-collection-2020widescreen-221119174110-d766c0e9/75/SmartArt-Graphics-Complete-Collection-2020-widescreen-pptx-143-2048.jpg)
![Picture //
144
CAPTIONED PICTURES
Use to show pictures
with multiple levels
of text. Works best
with a small amount
of Level 1 text and a
medium amount of
Level 2 text.
Lorem Ipsum
Lorem Ipsum
Lorem Ipsum
Lorem Ipsum
Lorem Ipsum
Lorem Ipsum
Lorem Ipsum
Lorem Ipsum
Lorem Ipsum
Lorem Ipsum
PowerPoint SmartArt Graphics - The Complete Ready-to-use Collection [2020 updated version]](https://image.slidesharecdn.com/smartart-graphics-complete-collection-2020widescreen-221119174110-d766c0e9/75/SmartArt-Graphics-Complete-Collection-2020-widescreen-pptx-144-2048.jpg)
![Picture //
145
BENDING PICTURE CAPTION
Use to show a
sequential series of
pictures. The box
covering the bottom
corner can contain
small amounts of
text.
Lorem Ipsum Lorem Ipsum Lorem Ipsum
Lorem Ipsum Lorem Ipsum
PowerPoint SmartArt Graphics - The Complete Ready-to-use Collection [2020 updated version]](https://image.slidesharecdn.com/smartart-graphics-complete-collection-2020widescreen-221119174110-d766c0e9/75/SmartArt-Graphics-Complete-Collection-2020-widescreen-pptx-145-2048.jpg)
![Picture //
146
PICTURE FRAME
Use to show pictures
and the
corresponding Level
1 text, both
displayed in an
offset frame. Works
best with Level 1
text only. Lorem Ipsum Lorem Ipsum Lorem Ipsum
Lorem Ipsum Lorem Ipsum
PowerPoint SmartArt Graphics - The Complete Ready-to-use Collection [2020 updated version]](https://image.slidesharecdn.com/smartart-graphics-complete-collection-2020widescreen-221119174110-d766c0e9/75/SmartArt-Graphics-Complete-Collection-2020-widescreen-pptx-146-2048.jpg)
![Picture //
147
BENDING PICTURE SEMI-
TRANSPARENT TEXT
Use to show a series
of pictures. A semi-
transparent box
covers the lower
portion of the
picture and contains
all levels of text. Lorem Ipsum Lorem Ipsum Lorem Ipsum
Lorem Ipsum Lorem Ipsum
PowerPoint SmartArt Graphics - The Complete Ready-to-use Collection [2020 updated version]](https://image.slidesharecdn.com/smartart-graphics-complete-collection-2020widescreen-221119174110-d766c0e9/75/SmartArt-Graphics-Complete-Collection-2020-widescreen-pptx-147-2048.jpg)
![Picture //
148
BENDING PICTURE BLOCKS
Use to show a series
of pictures. The box
covering the bottom
corner can contain
small amounts of
text. Lorem
Ipsum
Lorem
Ipsum
Lorem
Ipsum
Lorem
Ipsum
Lorem
Ipsum
PowerPoint SmartArt Graphics - The Complete Ready-to-use Collection [2020 updated version]](https://image.slidesharecdn.com/smartart-graphics-complete-collection-2020widescreen-221119174110-d766c0e9/75/SmartArt-Graphics-Complete-Collection-2020-widescreen-pptx-148-2048.jpg)
![Picture //
149
BENDING PICTURE
CAPTION LIST
Use to show a series
of pictures. The title
and description
appear in a callout
shape under each
picture.
Lorem Ipsum Lorem Ipsum Lorem Ipsum
Lorem Ipsum Lorem Ipsum
PowerPoint SmartArt Graphics - The Complete Ready-to-use Collection [2020 updated version]](https://image.slidesharecdn.com/smartart-graphics-complete-collection-2020widescreen-221119174110-d766c0e9/75/SmartArt-Graphics-Complete-Collection-2020-widescreen-pptx-149-2048.jpg)
![Picture //
150
TITLED PICTURE BLOCKS
Use to show a series
of pictures. Level 1
text appears above
each picture. Level 2
text appears to the
side and slightly
overlapping each
picture.
Some
text
here
Lorem Ipsum
• Some
text here
• Some
text here
Lorem Ipsum
Some
text
here
Lorem Ipsum
Some
text
here
Lorem Ipsum
• Some
text here
• Some
text here
Lorem Ipsum
PowerPoint SmartArt Graphics - The Complete Ready-to-use Collection [2020 updated version]](https://image.slidesharecdn.com/smartart-graphics-complete-collection-2020widescreen-221119174110-d766c0e9/75/SmartArt-Graphics-Complete-Collection-2020-widescreen-pptx-150-2048.jpg)
![Picture //
151
PICTURE GRID
Use to show pictures
laid out on a square
grid. Best with a
small amount of
Level 1 text, which
appears above the
picture.
Lorem Ipsum Lorem Ipsum Lorem Ipsum
Lorem Ipsum Lorem Ipsum Lorem Ipsum
PowerPoint SmartArt Graphics - The Complete Ready-to-use Collection [2020 updated version]](https://image.slidesharecdn.com/smartart-graphics-complete-collection-2020widescreen-221119174110-d766c0e9/75/SmartArt-Graphics-Complete-Collection-2020-widescreen-pptx-151-2048.jpg)
![Picture //
152
PICTURE ACCENT BLOCKS
Use to show a group
of pictures in blocks
starting from the
corner. The
corresponding text
displays vertically.
Works well as an
accent on title or
sub-title slides or for
section breaks of a
document.
Lorem
Ipsum
Lorem
Ipsum
Lorem
Ipsum
Lorem
Ipsum
Lorem
Ipsum
Lorem
Ipsum
Lorem
Ipsum
Lorem
Ipsum
Lorem
Ipsum
PowerPoint SmartArt Graphics - The Complete Ready-to-use Collection [2020 updated version]](https://image.slidesharecdn.com/smartart-graphics-complete-collection-2020widescreen-221119174110-d766c0e9/75/SmartArt-Graphics-Complete-Collection-2020-widescreen-pptx-152-2048.jpg)
![Picture //
153
THEME PICTURE ACCENT
Use to show a group
of pictures with the
first picture being
centered and the
largest. Can contain
up to six Level 1
pictures. Unused
pictures do not
appear, but remain
available if you
switch layouts.
Works best with
small amounts of
text.
Lorem Ipsum
Lorem Ipsum
Lorem Ipsum
Lorem
Ipsum
Lorem Ipsum
PowerPoint SmartArt Graphics - The Complete Ready-to-use Collection [2020 updated version]](https://image.slidesharecdn.com/smartart-graphics-complete-collection-2020widescreen-221119174110-d766c0e9/75/SmartArt-Graphics-Complete-Collection-2020-widescreen-pptx-153-2048.jpg)
![Picture //
154
THEME PICTURE GRID
Use to show a group
of pictures with the
first picture being
the largest. Can
contain up to five
Level 1 pictures.
Unused pictures do
not appear, but
remain available if
you switch layouts.
Works best with
small amounts of
corresponding text.
Lorem Ipsum
Lorem Ipsum Lorem Ipsum
Lorem Ipsum Lorem Ipsum
PowerPoint SmartArt Graphics - The Complete Ready-to-use Collection [2020 updated version]](https://image.slidesharecdn.com/smartart-graphics-complete-collection-2020widescreen-221119174110-d766c0e9/75/SmartArt-Graphics-Complete-Collection-2020-widescreen-pptx-154-2048.jpg)
![Picture //
155
THEME PICTURE
ALTERNATING ACCENT
Use to show a group
of pictures with the
first picture being
the largest and on
top. Additional Level
1 pictures alternate
between squares
and rectangles with
a limit of nine Level
1 pictures. Works
best with small
amounts of text.
Unused text does
not appear, but
remains available if
you switch layouts.
Lorem Ipsum
Lorem Ipsum Lorem Ipsum
Lorem Ipsum Lorem Ipsum
PowerPoint SmartArt Graphics - The Complete Ready-to-use Collection [2020 updated version]](https://image.slidesharecdn.com/smartart-graphics-complete-collection-2020widescreen-221119174110-d766c0e9/75/SmartArt-Graphics-Complete-Collection-2020-widescreen-pptx-155-2048.jpg)
![Picture //
156
TITLED PICTURE ACCENT LIST
Use to show lists of
information with an
accent picture for
each Level 2 text.
Level 1 text displays
in a separate box at
the top of the list.
Lorem Ipsum
Some text here
Some text here
Some text here
Some text here
PowerPoint SmartArt Graphics - The Complete Ready-to-use Collection [2020 updated version]](https://image.slidesharecdn.com/smartart-graphics-complete-collection-2020widescreen-221119174110-d766c0e9/75/SmartArt-Graphics-Complete-Collection-2020-widescreen-pptx-156-2048.jpg)
![Picture //
157
ALTERNATING PICTURE CIRCLES
Use to show a set of
pictures with text.
The corresponding
text appears in the
central circles with
the images
alternating from left
to right.
Lorem
Ipsum
Lorem
Ipsum
Lorem
Ipsum
Lorem
Ipsum
PowerPoint SmartArt Graphics - The Complete Ready-to-use Collection [2020 updated version]](https://image.slidesharecdn.com/smartart-graphics-complete-collection-2020widescreen-221119174110-d766c0e9/75/SmartArt-Graphics-Complete-Collection-2020-widescreen-pptx-157-2048.jpg)
![Picture //
158
TITLE PICTURE LINEUP
Use to show a series
of pictures that each
have their own title
and description.
Level 1 text appears
in the box above the
picture. Level 2 text
appears below the
picture.
•Some text here
•Some text here
•Some text here
Lorem Ipsum
•Some text here
•Some text here
Lorem Ipsum
•Some text here
•Some text here
•Some text here
•Some text here
•Some text here
Lorem Ipsum
•Some text here
•Some text here
Lorem Ipsum
•Some text here
•Some text here
•Some text here
Lorem Ipsum
PowerPoint SmartArt Graphics - The Complete Ready-to-use Collection [2020 updated version]](https://image.slidesharecdn.com/smartart-graphics-complete-collection-2020widescreen-221119174110-d766c0e9/75/SmartArt-Graphics-Complete-Collection-2020-widescreen-pptx-158-2048.jpg)
![Picture //
159
PICTURE LINEUP
Use to show a series
of pictures side by
side. Level 1 text
covers the top of the
picture. Level 2 text
appears below the
picture.
Lorem Ipsum
• Some text here
• Some text here
Lorem Ipsum Lorem Ipsum
• Some text here
Lorem Ipsum Lorem Ipsum
• Some text here
• Some text here
PowerPoint SmartArt Graphics - The Complete Ready-to-use Collection [2020 updated version]](https://image.slidesharecdn.com/smartart-graphics-complete-collection-2020widescreen-221119174110-d766c0e9/75/SmartArt-Graphics-Complete-Collection-2020-widescreen-pptx-159-2048.jpg)
![Picture //
160
FRAMED TEXT PICTURE
Use to show pictures
with corresponding
Level 1 text
displayed in a frame. Lorem Ipsum
•Some text here
•Some text here
Lorem Ipsum
Lorem Ipsum
Lorem Ipsum
•Some text here
•Some text here
PowerPoint SmartArt Graphics - The Complete Ready-to-use Collection [2020 updated version]](https://image.slidesharecdn.com/smartart-graphics-complete-collection-2020widescreen-221119174110-d766c0e9/75/SmartArt-Graphics-Complete-Collection-2020-widescreen-pptx-160-2048.jpg)
![Picture //
161
HEXAGON CLUSTER
Use to show pictures
with associated
descriptive text.
Small hexagons
indicate the picture
and text pair. Works
best with small
amounts of text.
Lorem
Ipsum
Lorem
Ipsum
Lorem
Ipsum
Lorem
Ipsum
Lorem
Ipsum
PowerPoint SmartArt Graphics - The Complete Ready-to-use Collection [2020 updated version]](https://image.slidesharecdn.com/smartart-graphics-complete-collection-2020widescreen-221119174110-d766c0e9/75/SmartArt-Graphics-Complete-Collection-2020-widescreen-pptx-161-2048.jpg)
![Picture //
162
BUBBLE PICTURE LIST
Use to show a series
of pictures. Can
contain up to eight
Level 1 pictures.
Unused text and
pictures do not
appear, but remain
available if you
switch layouts.
Works best with
small amounts of
text.
Lorem Ipsum
Lorem Ipsum
Lorem Ipsum
Lorem Ipsum
Lorem Ipsum
PowerPoint SmartArt Graphics - The Complete Ready-to-use Collection [2020 updated version]](https://image.slidesharecdn.com/smartart-graphics-complete-collection-2020widescreen-221119174110-d766c0e9/75/SmartArt-Graphics-Complete-Collection-2020-widescreen-pptx-162-2048.jpg)