Downloaded 413 times


![The Business OpportunityGoldman Sachs estimates smart grids will be worth $750 billion globally for equipment makers, with Europe making up a quarter of that total. In total they say Europe could spend $187 billion through the next 30 years on transmission, distribution and metering systems.http://www.reuters.com/article/idUSTRE68T2T020100930, Sept 2010Cumulative global investment in smart grids, including smart meter implementations as well as upgrades to the transmission and distribution infrastructure, will approach $46 billion by 2015, according to the latest forecasts from ABI Research.http://www.abiresearch.com/press/1688-Smart+Grid+Spending+Will+Top+$45+Billion+by+2015Ofgem estimates that £32 billion of extra investment will be required in the next decade in the [UK] electricity networks. The Net Present Value (NPV) of the reinforcement costs avoided in a ‘smart’ system with a 50% penetration of electric cars and heat pumps could be between £2.4 and £8.1 billion.Smart Grids: Commercial Opportunities and Challenges for the UK, Knowledge Transfer Network .](https://image.slidesharecdn.com/smartcitybenchmark-110405050904-phpapp01/75/Smart-City-Benchmark-26-2048.jpg)


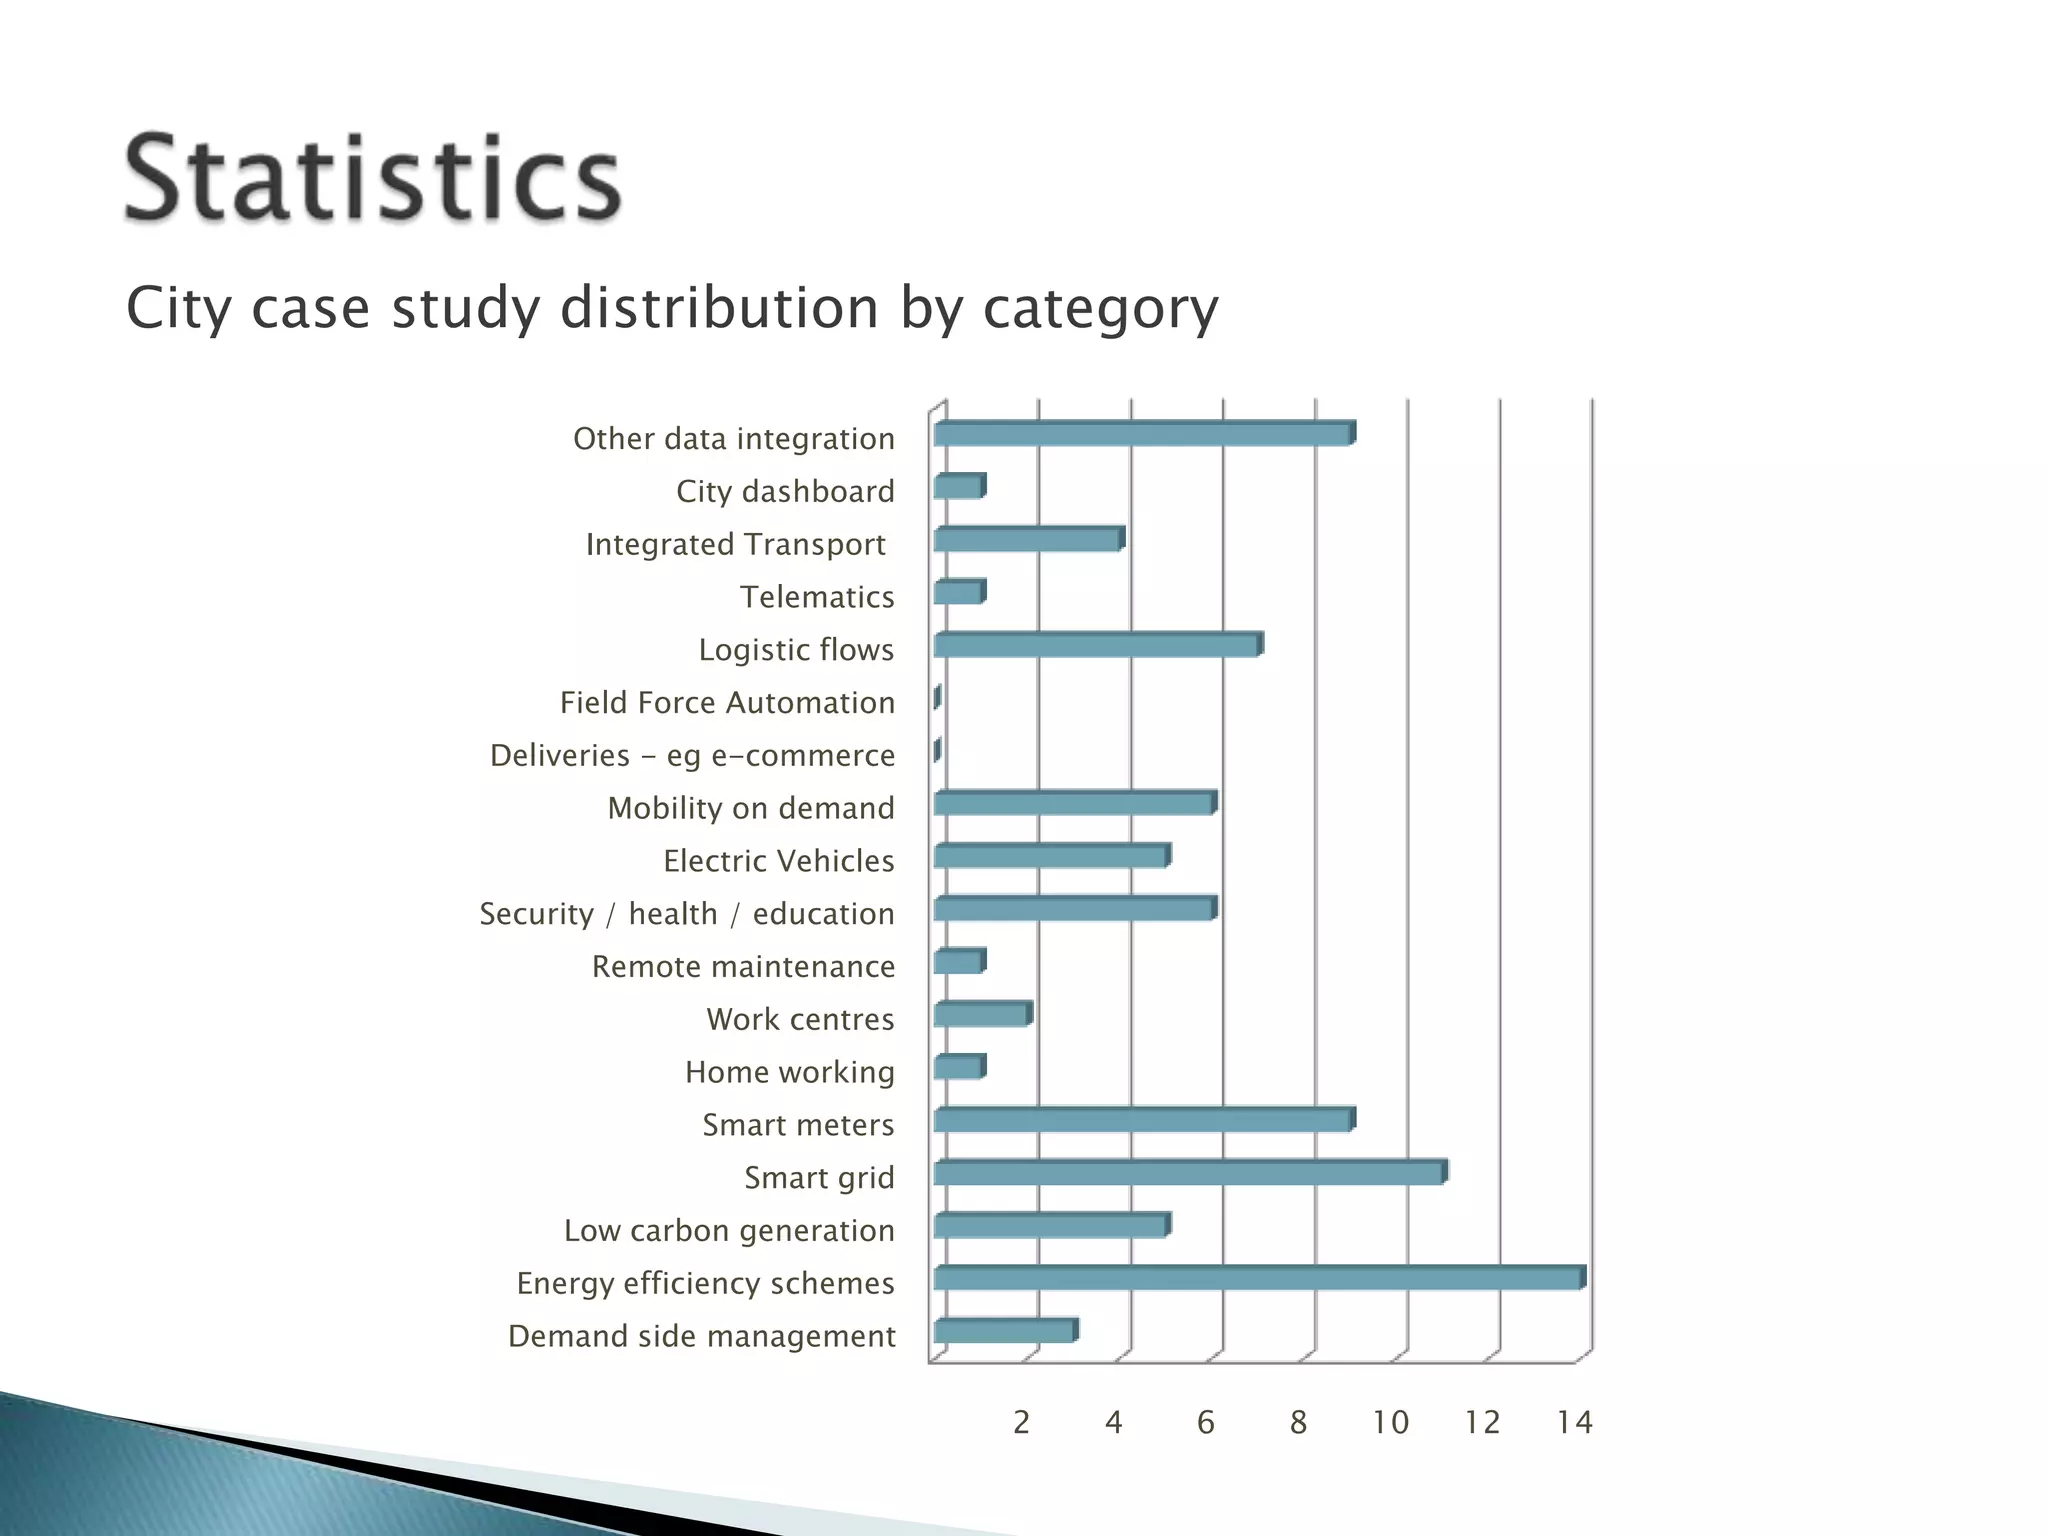
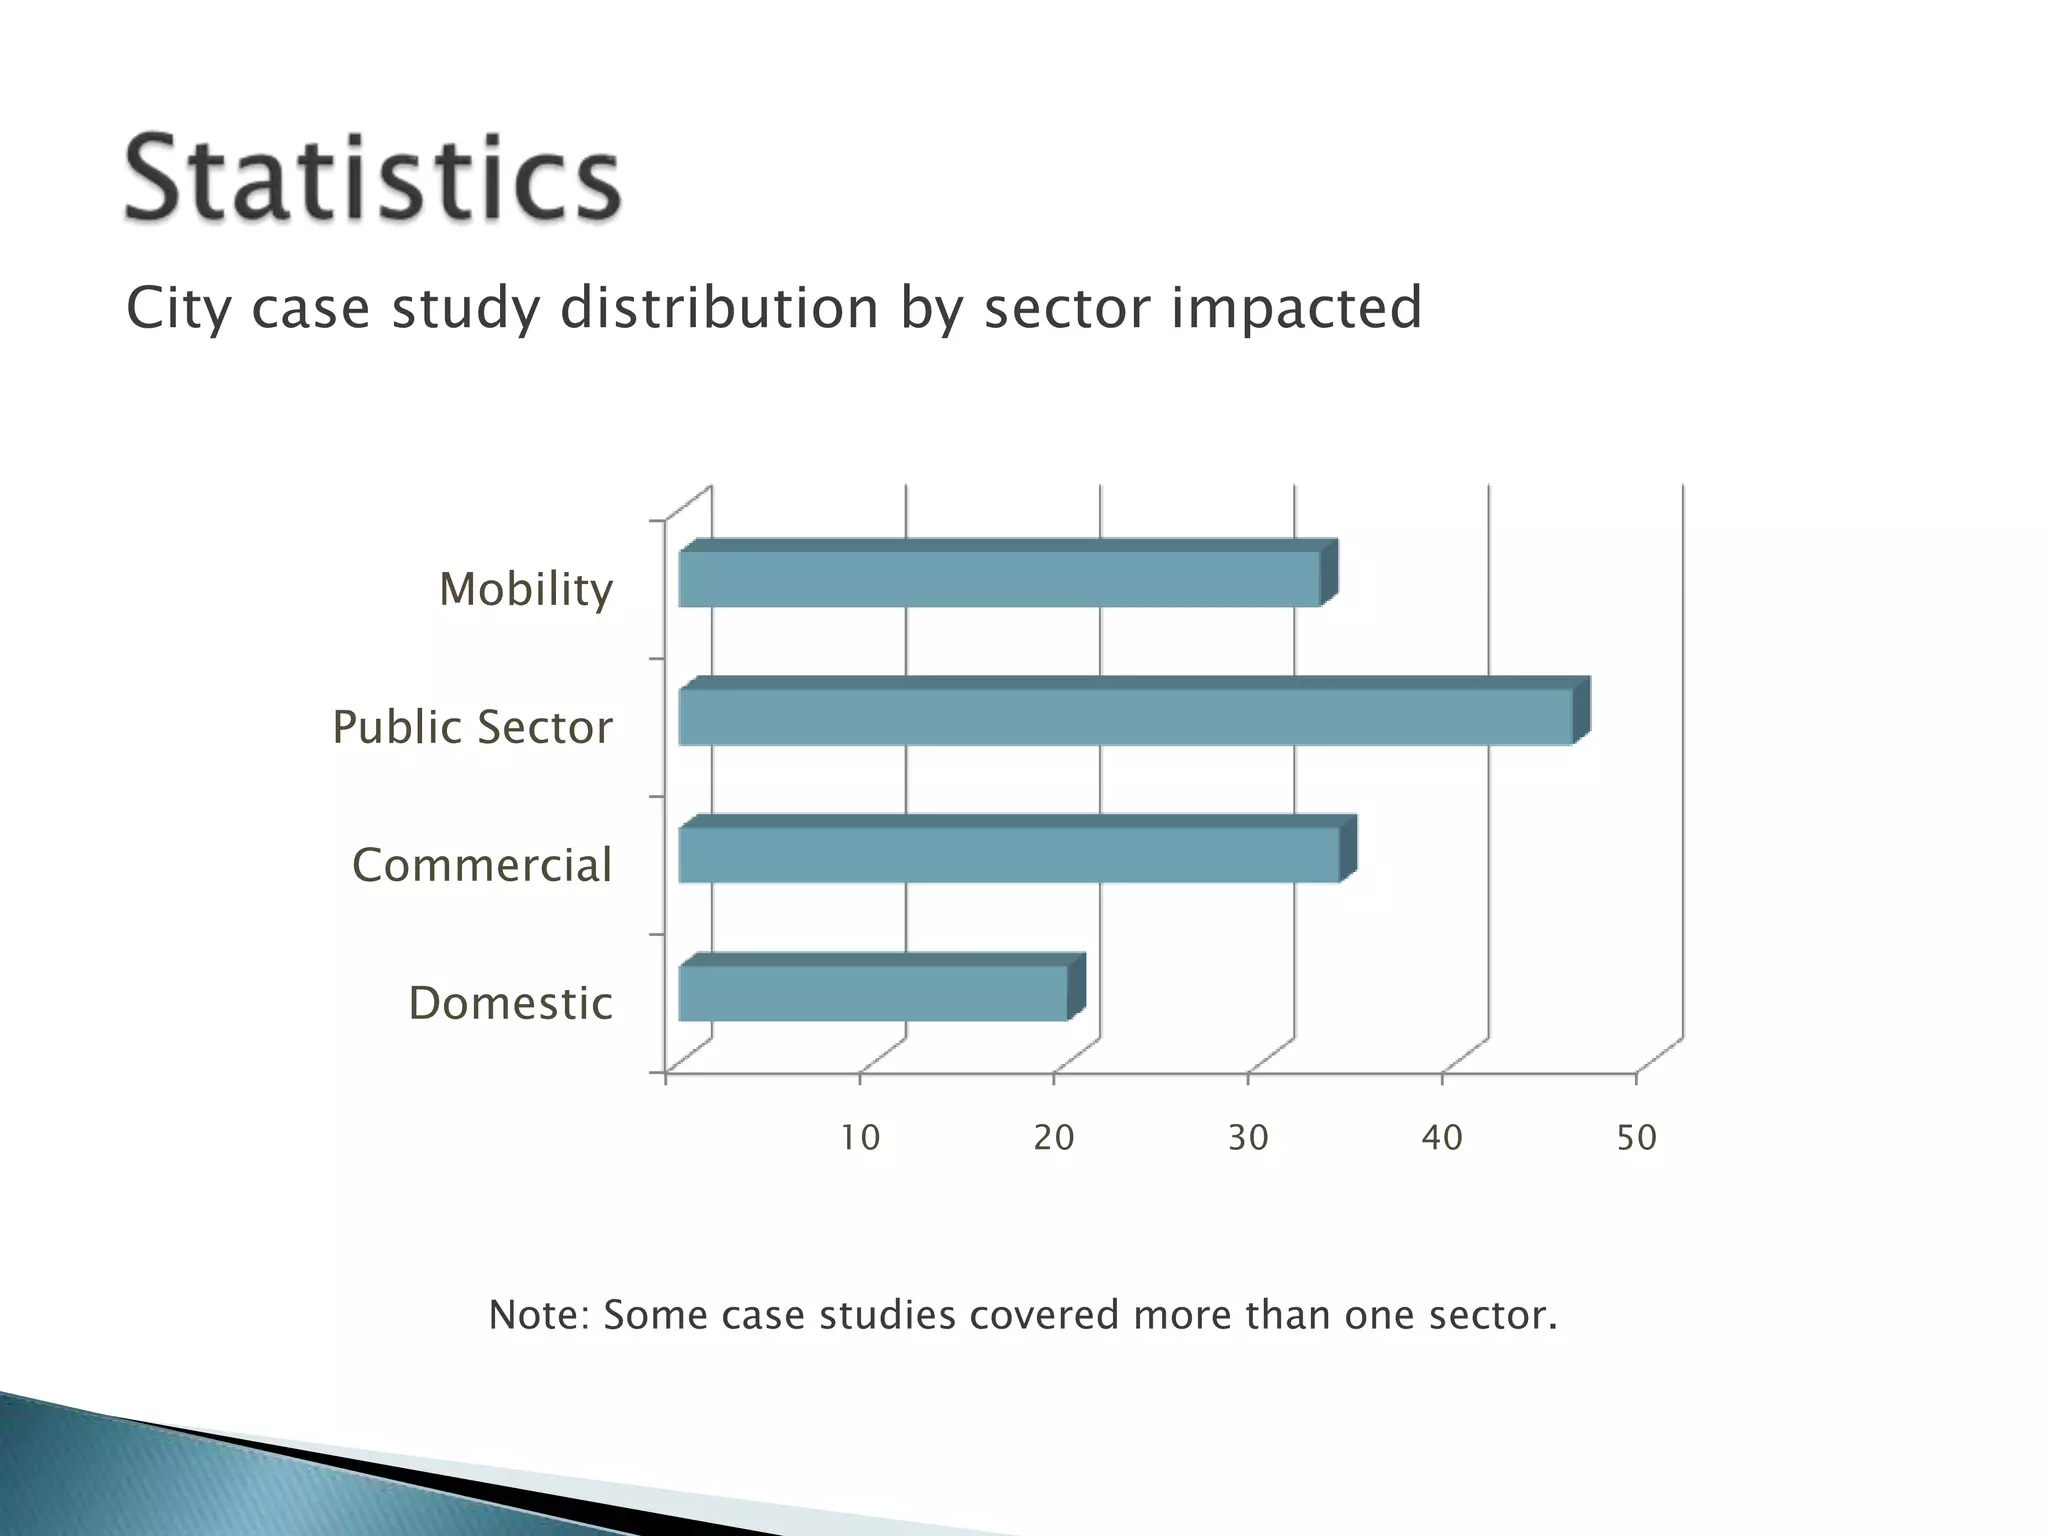
This document summarizes a report on smart city activities commissioned by Bristol City Council. It provides an overview of the methodology used in the report to analyze over 100 global cities and provide case studies on 46 cities. The report focuses on how smart technologies can help reduce carbon emissions. It also discusses barriers to smart city deployment and examples of smart grid projects in various cities that enable demand management, improve grid efficiency, and provide energy usage information.


