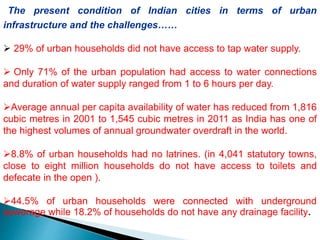
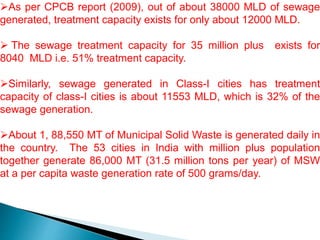
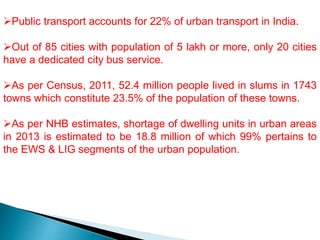
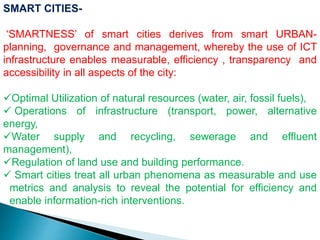
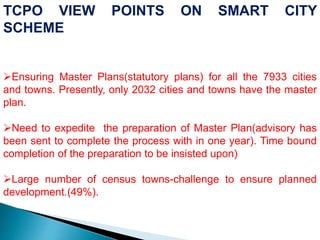
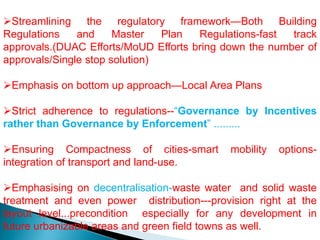
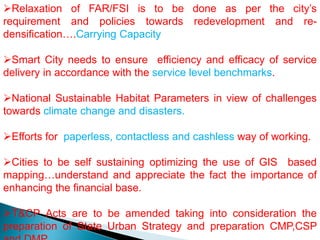
SMART CITIES:CHALLENGES AND
OPPURTUNITIES
R.Srinivas
Town and Country Planner
Town and Country Planning
Organization
Ministry of Urban Development,
Government of India
29th December, 2014
ITPI,NEW DELHI
2001 2011 Change
States & UTs 35 35 -
Districts 593 640(672*) +47
No. of Towns* 5161 7933 +2774
Urban Population
(In million)
286.10 377.10 +31.81%
Total Population
(In million)
1028.73 1210.20 +17.64%
Urban Population as % of
Total Population
27.81 31.16 +3.35
•Total of Statutory Towns and Census Towns.
•Source –Census of India,2011
* As in 2014
2
Urban population is increasing at a
rapid rate, so is the gap between
demand and supply of urban
services
Urban population likely to increase
from present 377 million to 600
million by 2030 & 900 million by
2050
53 Million Plus cities
Urban cities and towns have
increased from 5,161 in 2001
to 7,933 in 2011 and will be
10000+ by 2021.
Class
Category
Definition
No of
Towns
Populat
ion
% of
Urban
No of
Towns
Populat
ion
% of Urban
Dec.Gr
Rate of
No. of
Towns
Dec Gr
of Pop
Pop 2001 2001
Populat
ion
2011 2011
Population
*
2001 -
2011
2001 -
2011
Class I >1 lakh 394 196.3 68.7 468 227.8 60.4 18.8 34.9
Of which,-
Below Mn+
1 - 10
lakh
359 88.0 30.8 415 104.2 27,2 15.6 18.4
Million Plus >10 lakh 35 108.3 37.9 53 160.7 42.2 51.4 48.4
Of which,-
Mega
cities@
>1 crore 3 42.5 14.9 3 48.8 12.9 0.0 14.8
Class II
50 -
100k
496 27.8 9.7 605 41.3 10.8 22.0 48.7
Class III 20 - 50k 1388 35.2 12.2 1905 58.2 15.4 37.2 65.5
Class IV 10 - 20k 1561 19.5 6.8 2233 31.9 8.5 43.0 63.8
Class V 5 - 10k 1041 6.7 2.4 2187 15.9 4.2 110.1 138.7
Class VI <5k 234 0.7 0.2 498 2.0 0.05 112.8 180.1
Total 5161 286.1 100.0 7933 377.1 100.0 53.7 31.8
Statut.
Towns
3799 265.1 92.7 4041 318.5 84.5 6.4 20.2
Non-Stat Cen Towns/
UAs
1362 21.0 7.3 3892 58.6 15.5 185.8 179.0
DISTRIBUTION OF URBAN POPULATION
The present condition of Indian cities in terms of urban
infrastructure and the challenges……
 29% of urban households did not have access to tap water supply.
 Only 71% of the urban population had access to water connections
and duration of water supply ranged from 1 to 6 hours per day.
Average annual per capita availability of water has reduced from 1,816
cubic metres in 2001 to 1,545 cubic metres in 2011 as India has one of
the highest volumes of annual groundwater overdraft in the world.
8.8% of urban households had no latrines. (in 4,041 statutory towns,
close to eight million households do not have access to toilets and
defecate in the open ).
44.5% of urban households were connected with underground
sewerage while 18.2% of households do not have any drainage facility.
As per CPCB report (2009), out of about 38000 MLD of sewage
generated, treatment capacity exists for only about 12000 MLD.
 The sewage treatment capacity for 35 million plus exists for
8040 MLD i.e. 51% treatment capacity.
Similarly, sewage generated in Class-I cities has treatment
capacity of class-I cities is about 11553 MLD, which is 32% of the
sewage generation.
About 1, 88,550 MT of Municipal Solid Waste is generated daily in
the country. The 53 cities in India with million plus population
together generate 86,000 MT (31.5 million tons per year) of MSW
at a per capita waste generation rate of 500 grams/day.
Public transport accounts for 22% of urban transport in India.
Out of 85 cities with population of 5 lakh or more, only 20 cities
have a dedicated city bus service.
As per Census, 2011, 52.4 million people lived in slums in 1743
towns which constitute 23.5% of the population of these towns.
As per NHB estimates, shortage of dwelling units in urban areas
in 2013 is estimated to be 18.8 million of which 99% pertains to
the EWS & LIG segments of the urban population.
In order to ensure efficient management of our
urban areas, not only existing deficit in
infrastructure and services needs to be addressed
but provision has to be made for catering to future
needs as well.
The financing requirements for improving present
cities as well as orderly urban growth and
expansions are enormous
ESTIMATE FOR INVESTMENTS IN URBAN
INFRASTRUCUTRE
Investment requirement for addressing basic needs has been
assessed from time to time by various committees and
organizations.
According to the estimates based on the CDP’s prepared for
the cities/towns under the Jawaharlal Nehru National Urban
Renewal Mission, the investment requirement for urban
infrastructure services and urban transport was estimated at Rs. 8
lakh Crore.
 CII estimates that between 2011 and 2020 India will need
investments of the order of Rs. 45 lakh Crore for basic urban
amenities like sewerage and sanitation, water supply, housing,
transport, electricity, healthcare etc.
Mckinsey Global Institute puts the investment requirement
relating to capital and operating expenditure at 100 lakh Crore
over next 20 years.
High Powered Expert Committee(HPEC) constituted by
Government of India for assessing investment requirement has
projected the capital investment requirement for Urban
Infrastructure, Renewal and Redevelopment (including slums),
and Capacity Building for the 20-year period from 2012-13 to
2031-32 at Rs. 39.00 lakh crore.
In order to do so, urgent steps are required to address
issues relating to strengthening urban governance,
capacity building, financing, strategizing urbanization
including spatial patterns and improving service
delivery outcomes.
S.No Sector Investment Estimate(Rs. Lakh)
1. Water Supply 320908
2 Sewerage 242688
3 SWM 48582
4 Storm Water Drains 191031
5 Urban Roads 1728941
6 Mass Transit 449426
7 Street Lighting 18580
8 Traffic Support Infrastructure 97985
9 Renewal and redevelopment 408955
10 Other sectors 309815
Total 3918670(say Rs. 39 lakh crore)
INVESTMENT ESTIMATES BY HPEC (FOR
THE PERIOD 2012-2031)
SMART CITY SCHEME
•Hon’ble FM had in his budget speech on 10 th July,2014
highlighted the vision of Hon’ble PM for developing ‘one hundred
Smart Cities’, as satellite towns of larger cities and by modernizing
the existing mid-sized cities with allocation of Rs.7060 Crore for
2014-15.
•Draft Concept note has been prepared and revised and circulated
to all the State Governments. Revised note is uploaded in MoUD
website.
•Guidelines/draft cabinet note will be finalized shortly.
•The Concept on Smart city has by and large focuses on :
Cities as engine of economic growth
Meaning of Smart city
Competitiveness, sustainability and Quality of life
Pillars of a Smart city Institutional Infrastructure(including Governance),
Physical Infrastructure, Social Infrastructure and Economic Infrastructure.
Smart cities Reference Framework
It is proposed that 100 cities to be developed as Smart Cities may
be chosen from amongst the following:
One satellite city of each of the cities with a population of 4
million people or more(9 cities).
Most of the cities in the population range of 1 – 4 million
people(about 35 out of 44 cities).
All State/UT Capitals, even if they have a population of less than
one million (17 cities)
Cities of tourist, religious and economic importance not included
in above (10 cities)
Cities in the 0.2 to 1.0 million population range ( 25 cities)
CONDITIONS
The selected cities will have to strive towards attaining specified
benchmarks in a range of services . In addition, they will need to
undertake the following through a tripartite MoU between the Central
Govt., State Govt., and the Urban Local Body.
Have an existing master plan or one that is likely to be approved
shortly and have such a validity of at least 10 years.
Have digitized spatial and GIS maps.
 Issue all clearances for projects in a collegiate manner using online
processes in a time bound manner.
 Electronic/Online seeking and delivery of all Public Services.
Create an IT-based platform for effective communication with the citizens
and keep them abreast of various activities and plans of the city.
Adopt tariff structures that are affordable for the poor and yet enough to
recover cost including Capital Expenditure. In doing so the State/Cities
could use their own resources to bridge the gap between the revenue and
expenses.
Create Open Data Platforms that are regularly updated.
Make all information and decisions taken available in the public domain.
Setup a regulatory body for all utility services such as water supply etc. so
that a level playing field is made available to the private sector and tariffs
are set in a manner that balances financial sustainability with quality.
All project first will be offered to Private Sector (PPP etc) for
implementation and O&M.
SMART CITIES-
‘SMARTNESS’ of smart cities derives from smart URBAN-
planning, governance and management, whereby the use of ICT
infrastructure enables measurable, efficiency , transparency and
accessibility in all aspects of the city:
Optimal Utilization of natural resources (water, air, fossil fuels),
 Operations of infrastructure (transport, power, alternative
energy,
Water supply and recycling, sewerage and effluent
management),
Regulation of land use and building performance.
 Smart cities treat all urban phenomena as measurable and use
metrics and analysis to reveal the potential for efficiency and
enable information-rich interventions.
TCPO VIEW POINTS ON SMART CITY
SCHEME
Ensuring Master Plans(statutory plans) for all the 7933 cities
and towns. Presently, only 2032 cities and towns have the master
plan.
Need to expedite the preparation of Master Plan(advisory has
been sent to complete the process with in one year). Time bound
completion of the preparation to be insisted upon)
Large number of census towns-challenge to ensure planned
development.(49%).
Streamlining the regulatory framework—Both Building
Regulations and Master Plan Regulations-fast track
approvals.(DUAC Efforts/MoUD Efforts bring down the number of
approvals/Single stop solution)
Emphasis on bottom up approach—Local Area Plans
Strict adherence to regulations--“Governance by Incentives
rather than Governance by Enforcement” .........
Ensuring Compactness of cities-smart mobility options-
integration of transport and land-use.
Emphasising on decentralisation-waste water and solid waste
treatment and even power distribution---provision right at the
layout level...precondition especially for any development in
future urbanizable areas and green field towns as well.
Relaxation of FAR/FSI is to be done as per the city’s
requirement and policies towards redevelopment and re-
densification….Carrying Capacity
Smart City needs to ensure efficiency and efficacy of service
delivery in accordance with the service level benchmarks.
National Sustainable Habitat Parameters in view of challenges
towards climate change and disasters.
Efforts for paperless, contactless and cashless way of working.
Cities to be self sustaining optimizing the use of GIS based
mapping…understand and appreciate the fact the importance of
enhancing the financial base.
T&CP Acts are to be amended taking into consideration the
preparation of State Urban Strategy and preparation CMP,CSP
THANKS FOR YOUR KIND ATTENTION

Smart cities itpi

  • 1.
    SMART CITIES:CHALLENGES AND OPPURTUNITIES R.Srinivas Townand Country Planner Town and Country Planning Organization Ministry of Urban Development, Government of India 29th December, 2014 ITPI,NEW DELHI
  • 2.
    2001 2011 Change States& UTs 35 35 - Districts 593 640(672*) +47 No. of Towns* 5161 7933 +2774 Urban Population (In million) 286.10 377.10 +31.81% Total Population (In million) 1028.73 1210.20 +17.64% Urban Population as % of Total Population 27.81 31.16 +3.35 •Total of Statutory Towns and Census Towns. •Source –Census of India,2011 * As in 2014 2
  • 3.
    Urban population isincreasing at a rapid rate, so is the gap between demand and supply of urban services Urban population likely to increase from present 377 million to 600 million by 2030 & 900 million by 2050 53 Million Plus cities Urban cities and towns have increased from 5,161 in 2001 to 7,933 in 2011 and will be 10000+ by 2021.
  • 4.
    Class Category Definition No of Towns Populat ion % of Urban Noof Towns Populat ion % of Urban Dec.Gr Rate of No. of Towns Dec Gr of Pop Pop 2001 2001 Populat ion 2011 2011 Population * 2001 - 2011 2001 - 2011 Class I >1 lakh 394 196.3 68.7 468 227.8 60.4 18.8 34.9 Of which,- Below Mn+ 1 - 10 lakh 359 88.0 30.8 415 104.2 27,2 15.6 18.4 Million Plus >10 lakh 35 108.3 37.9 53 160.7 42.2 51.4 48.4 Of which,- Mega cities@ >1 crore 3 42.5 14.9 3 48.8 12.9 0.0 14.8 Class II 50 - 100k 496 27.8 9.7 605 41.3 10.8 22.0 48.7 Class III 20 - 50k 1388 35.2 12.2 1905 58.2 15.4 37.2 65.5 Class IV 10 - 20k 1561 19.5 6.8 2233 31.9 8.5 43.0 63.8 Class V 5 - 10k 1041 6.7 2.4 2187 15.9 4.2 110.1 138.7 Class VI <5k 234 0.7 0.2 498 2.0 0.05 112.8 180.1 Total 5161 286.1 100.0 7933 377.1 100.0 53.7 31.8 Statut. Towns 3799 265.1 92.7 4041 318.5 84.5 6.4 20.2 Non-Stat Cen Towns/ UAs 1362 21.0 7.3 3892 58.6 15.5 185.8 179.0 DISTRIBUTION OF URBAN POPULATION
  • 5.
    The present conditionof Indian cities in terms of urban infrastructure and the challenges……  29% of urban households did not have access to tap water supply.  Only 71% of the urban population had access to water connections and duration of water supply ranged from 1 to 6 hours per day. Average annual per capita availability of water has reduced from 1,816 cubic metres in 2001 to 1,545 cubic metres in 2011 as India has one of the highest volumes of annual groundwater overdraft in the world. 8.8% of urban households had no latrines. (in 4,041 statutory towns, close to eight million households do not have access to toilets and defecate in the open ). 44.5% of urban households were connected with underground sewerage while 18.2% of households do not have any drainage facility.
  • 6.
    As per CPCBreport (2009), out of about 38000 MLD of sewage generated, treatment capacity exists for only about 12000 MLD.  The sewage treatment capacity for 35 million plus exists for 8040 MLD i.e. 51% treatment capacity. Similarly, sewage generated in Class-I cities has treatment capacity of class-I cities is about 11553 MLD, which is 32% of the sewage generation. About 1, 88,550 MT of Municipal Solid Waste is generated daily in the country. The 53 cities in India with million plus population together generate 86,000 MT (31.5 million tons per year) of MSW at a per capita waste generation rate of 500 grams/day.
  • 7.
    Public transport accountsfor 22% of urban transport in India. Out of 85 cities with population of 5 lakh or more, only 20 cities have a dedicated city bus service. As per Census, 2011, 52.4 million people lived in slums in 1743 towns which constitute 23.5% of the population of these towns. As per NHB estimates, shortage of dwelling units in urban areas in 2013 is estimated to be 18.8 million of which 99% pertains to the EWS & LIG segments of the urban population.
  • 8.
    In order toensure efficient management of our urban areas, not only existing deficit in infrastructure and services needs to be addressed but provision has to be made for catering to future needs as well. The financing requirements for improving present cities as well as orderly urban growth and expansions are enormous
  • 9.
    ESTIMATE FOR INVESTMENTSIN URBAN INFRASTRUCUTRE Investment requirement for addressing basic needs has been assessed from time to time by various committees and organizations. According to the estimates based on the CDP’s prepared for the cities/towns under the Jawaharlal Nehru National Urban Renewal Mission, the investment requirement for urban infrastructure services and urban transport was estimated at Rs. 8 lakh Crore.
  • 10.
     CII estimatesthat between 2011 and 2020 India will need investments of the order of Rs. 45 lakh Crore for basic urban amenities like sewerage and sanitation, water supply, housing, transport, electricity, healthcare etc. Mckinsey Global Institute puts the investment requirement relating to capital and operating expenditure at 100 lakh Crore over next 20 years. High Powered Expert Committee(HPEC) constituted by Government of India for assessing investment requirement has projected the capital investment requirement for Urban Infrastructure, Renewal and Redevelopment (including slums), and Capacity Building for the 20-year period from 2012-13 to 2031-32 at Rs. 39.00 lakh crore.
  • 11.
    In order todo so, urgent steps are required to address issues relating to strengthening urban governance, capacity building, financing, strategizing urbanization including spatial patterns and improving service delivery outcomes.
  • 12.
    S.No Sector InvestmentEstimate(Rs. Lakh) 1. Water Supply 320908 2 Sewerage 242688 3 SWM 48582 4 Storm Water Drains 191031 5 Urban Roads 1728941 6 Mass Transit 449426 7 Street Lighting 18580 8 Traffic Support Infrastructure 97985 9 Renewal and redevelopment 408955 10 Other sectors 309815 Total 3918670(say Rs. 39 lakh crore) INVESTMENT ESTIMATES BY HPEC (FOR THE PERIOD 2012-2031)
  • 13.
    SMART CITY SCHEME •Hon’bleFM had in his budget speech on 10 th July,2014 highlighted the vision of Hon’ble PM for developing ‘one hundred Smart Cities’, as satellite towns of larger cities and by modernizing the existing mid-sized cities with allocation of Rs.7060 Crore for 2014-15. •Draft Concept note has been prepared and revised and circulated to all the State Governments. Revised note is uploaded in MoUD website. •Guidelines/draft cabinet note will be finalized shortly. •The Concept on Smart city has by and large focuses on : Cities as engine of economic growth Meaning of Smart city Competitiveness, sustainability and Quality of life Pillars of a Smart city Institutional Infrastructure(including Governance), Physical Infrastructure, Social Infrastructure and Economic Infrastructure. Smart cities Reference Framework
  • 14.
    It is proposedthat 100 cities to be developed as Smart Cities may be chosen from amongst the following: One satellite city of each of the cities with a population of 4 million people or more(9 cities). Most of the cities in the population range of 1 – 4 million people(about 35 out of 44 cities). All State/UT Capitals, even if they have a population of less than one million (17 cities) Cities of tourist, religious and economic importance not included in above (10 cities) Cities in the 0.2 to 1.0 million population range ( 25 cities)
  • 15.
    CONDITIONS The selected citieswill have to strive towards attaining specified benchmarks in a range of services . In addition, they will need to undertake the following through a tripartite MoU between the Central Govt., State Govt., and the Urban Local Body. Have an existing master plan or one that is likely to be approved shortly and have such a validity of at least 10 years. Have digitized spatial and GIS maps.  Issue all clearances for projects in a collegiate manner using online processes in a time bound manner.  Electronic/Online seeking and delivery of all Public Services.
  • 16.
    Create an IT-basedplatform for effective communication with the citizens and keep them abreast of various activities and plans of the city. Adopt tariff structures that are affordable for the poor and yet enough to recover cost including Capital Expenditure. In doing so the State/Cities could use their own resources to bridge the gap between the revenue and expenses. Create Open Data Platforms that are regularly updated. Make all information and decisions taken available in the public domain. Setup a regulatory body for all utility services such as water supply etc. so that a level playing field is made available to the private sector and tariffs are set in a manner that balances financial sustainability with quality. All project first will be offered to Private Sector (PPP etc) for implementation and O&M.
  • 17.
    SMART CITIES- ‘SMARTNESS’ ofsmart cities derives from smart URBAN- planning, governance and management, whereby the use of ICT infrastructure enables measurable, efficiency , transparency and accessibility in all aspects of the city: Optimal Utilization of natural resources (water, air, fossil fuels),  Operations of infrastructure (transport, power, alternative energy, Water supply and recycling, sewerage and effluent management), Regulation of land use and building performance.  Smart cities treat all urban phenomena as measurable and use metrics and analysis to reveal the potential for efficiency and enable information-rich interventions.
  • 18.
    TCPO VIEW POINTSON SMART CITY SCHEME Ensuring Master Plans(statutory plans) for all the 7933 cities and towns. Presently, only 2032 cities and towns have the master plan. Need to expedite the preparation of Master Plan(advisory has been sent to complete the process with in one year). Time bound completion of the preparation to be insisted upon) Large number of census towns-challenge to ensure planned development.(49%).
  • 19.
    Streamlining the regulatoryframework—Both Building Regulations and Master Plan Regulations-fast track approvals.(DUAC Efforts/MoUD Efforts bring down the number of approvals/Single stop solution) Emphasis on bottom up approach—Local Area Plans Strict adherence to regulations--“Governance by Incentives rather than Governance by Enforcement” ......... Ensuring Compactness of cities-smart mobility options- integration of transport and land-use. Emphasising on decentralisation-waste water and solid waste treatment and even power distribution---provision right at the layout level...precondition especially for any development in future urbanizable areas and green field towns as well.
  • 20.
    Relaxation of FAR/FSIis to be done as per the city’s requirement and policies towards redevelopment and re- densification….Carrying Capacity Smart City needs to ensure efficiency and efficacy of service delivery in accordance with the service level benchmarks. National Sustainable Habitat Parameters in view of challenges towards climate change and disasters. Efforts for paperless, contactless and cashless way of working. Cities to be self sustaining optimizing the use of GIS based mapping…understand and appreciate the fact the importance of enhancing the financial base. T&CP Acts are to be amended taking into consideration the preparation of State Urban Strategy and preparation CMP,CSP
  • 21.
    THANKS FOR YOURKIND ATTENTION