Download to read offline
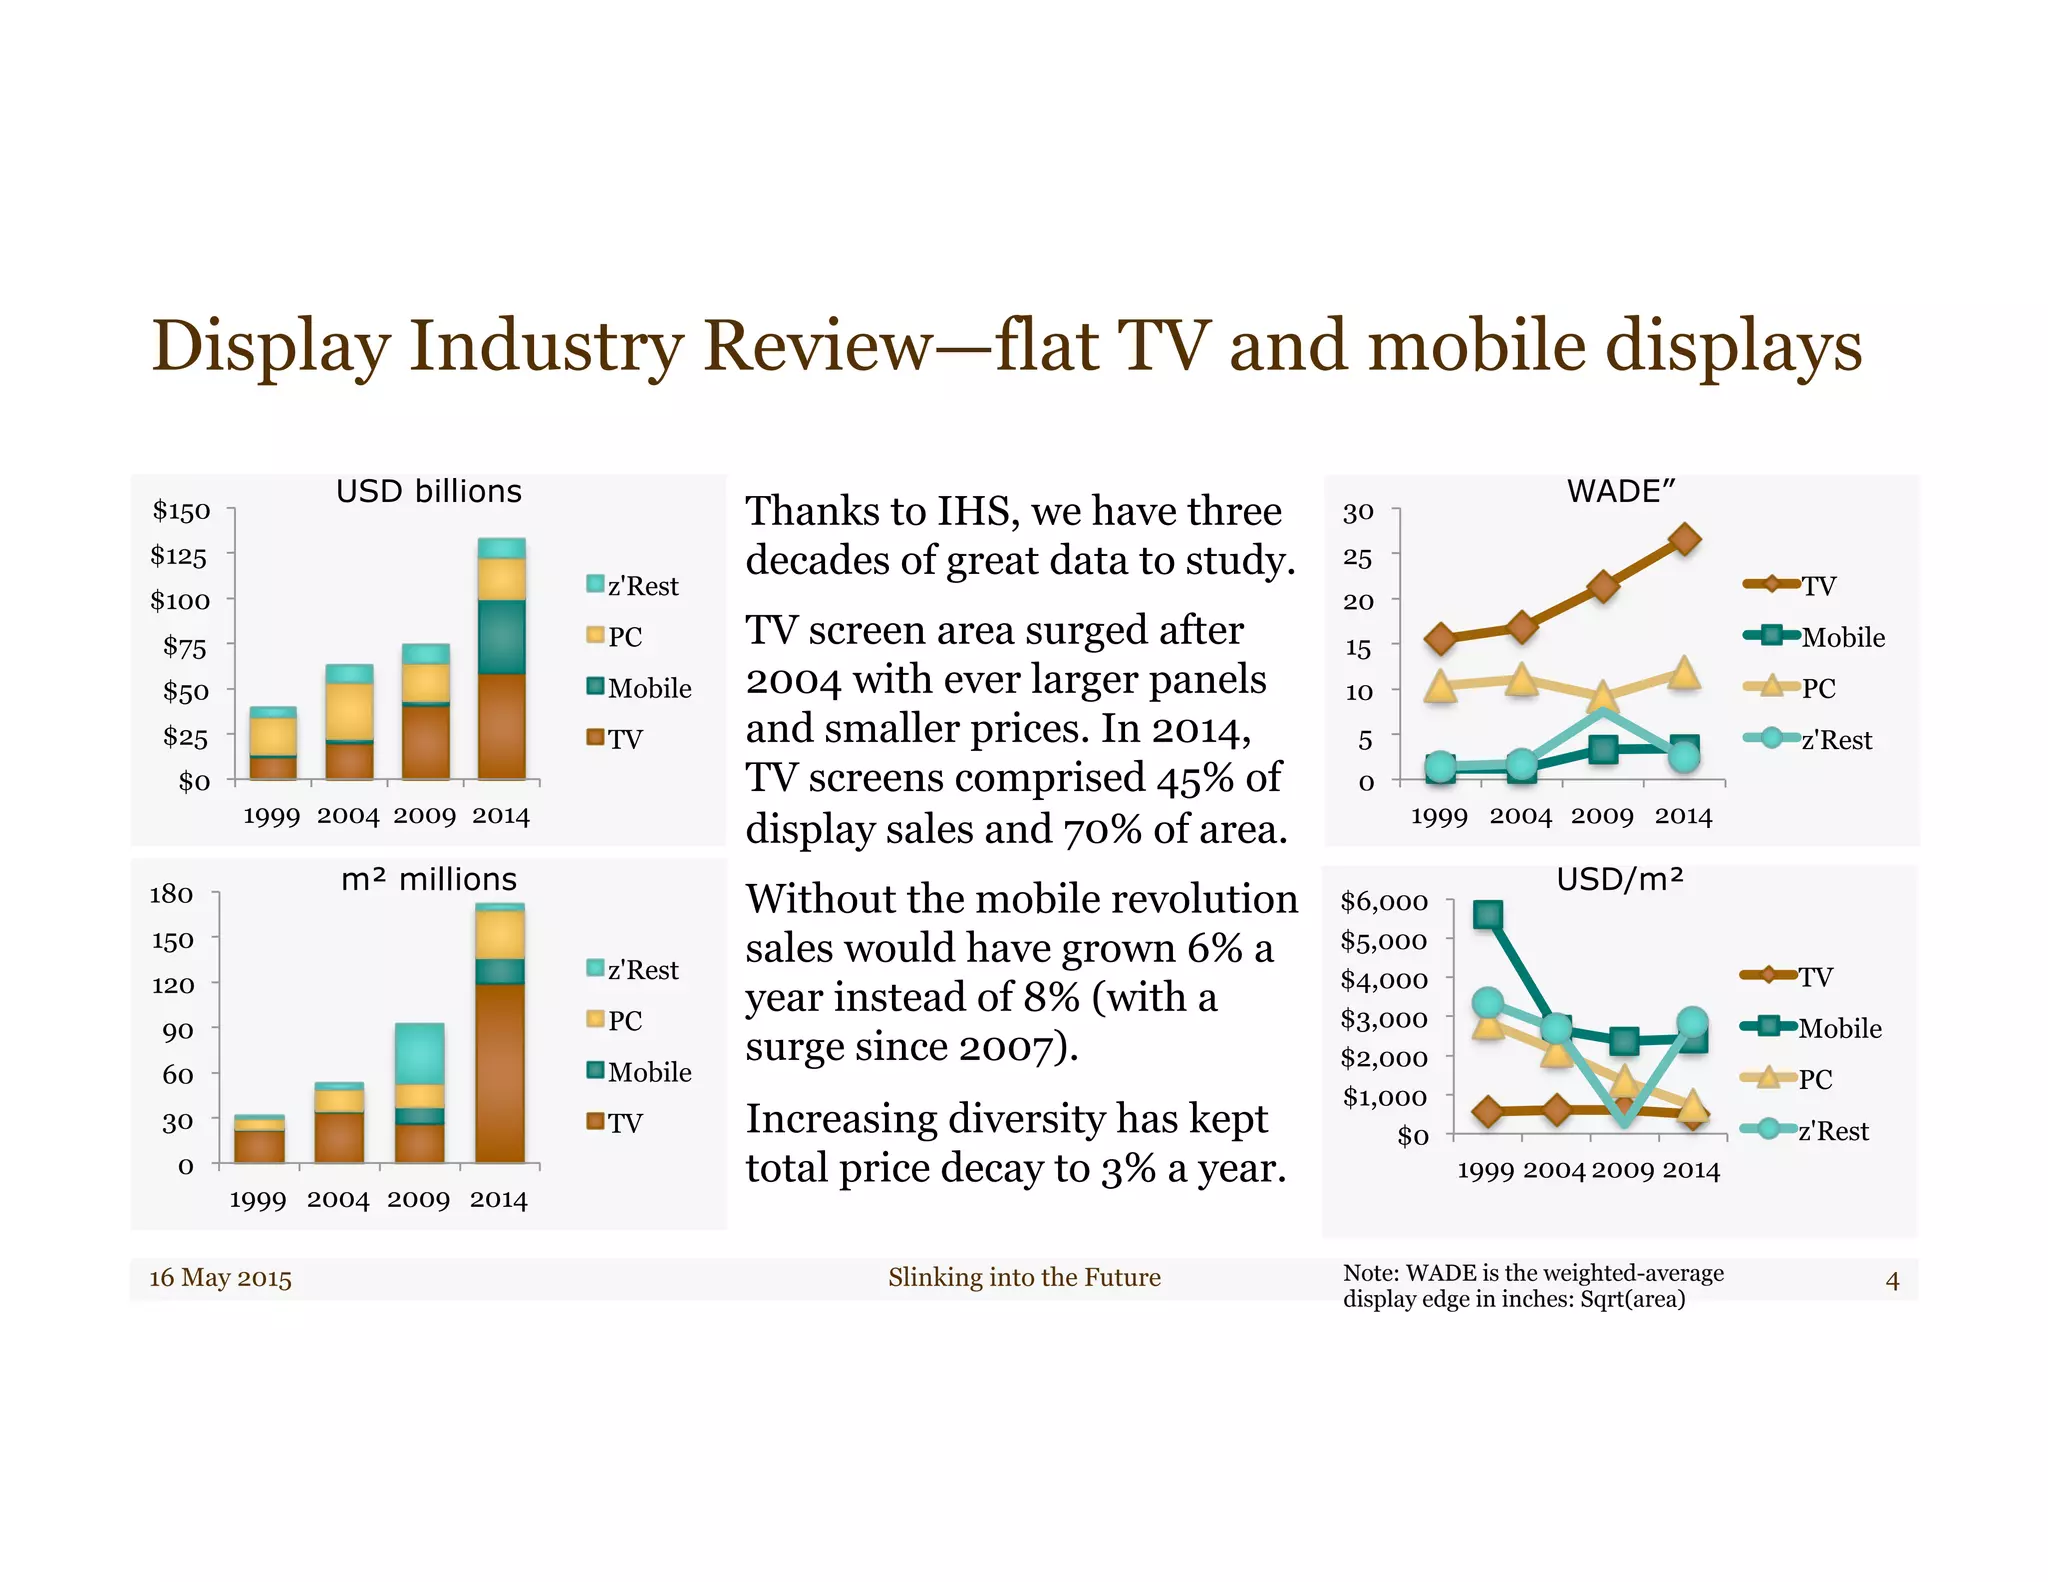
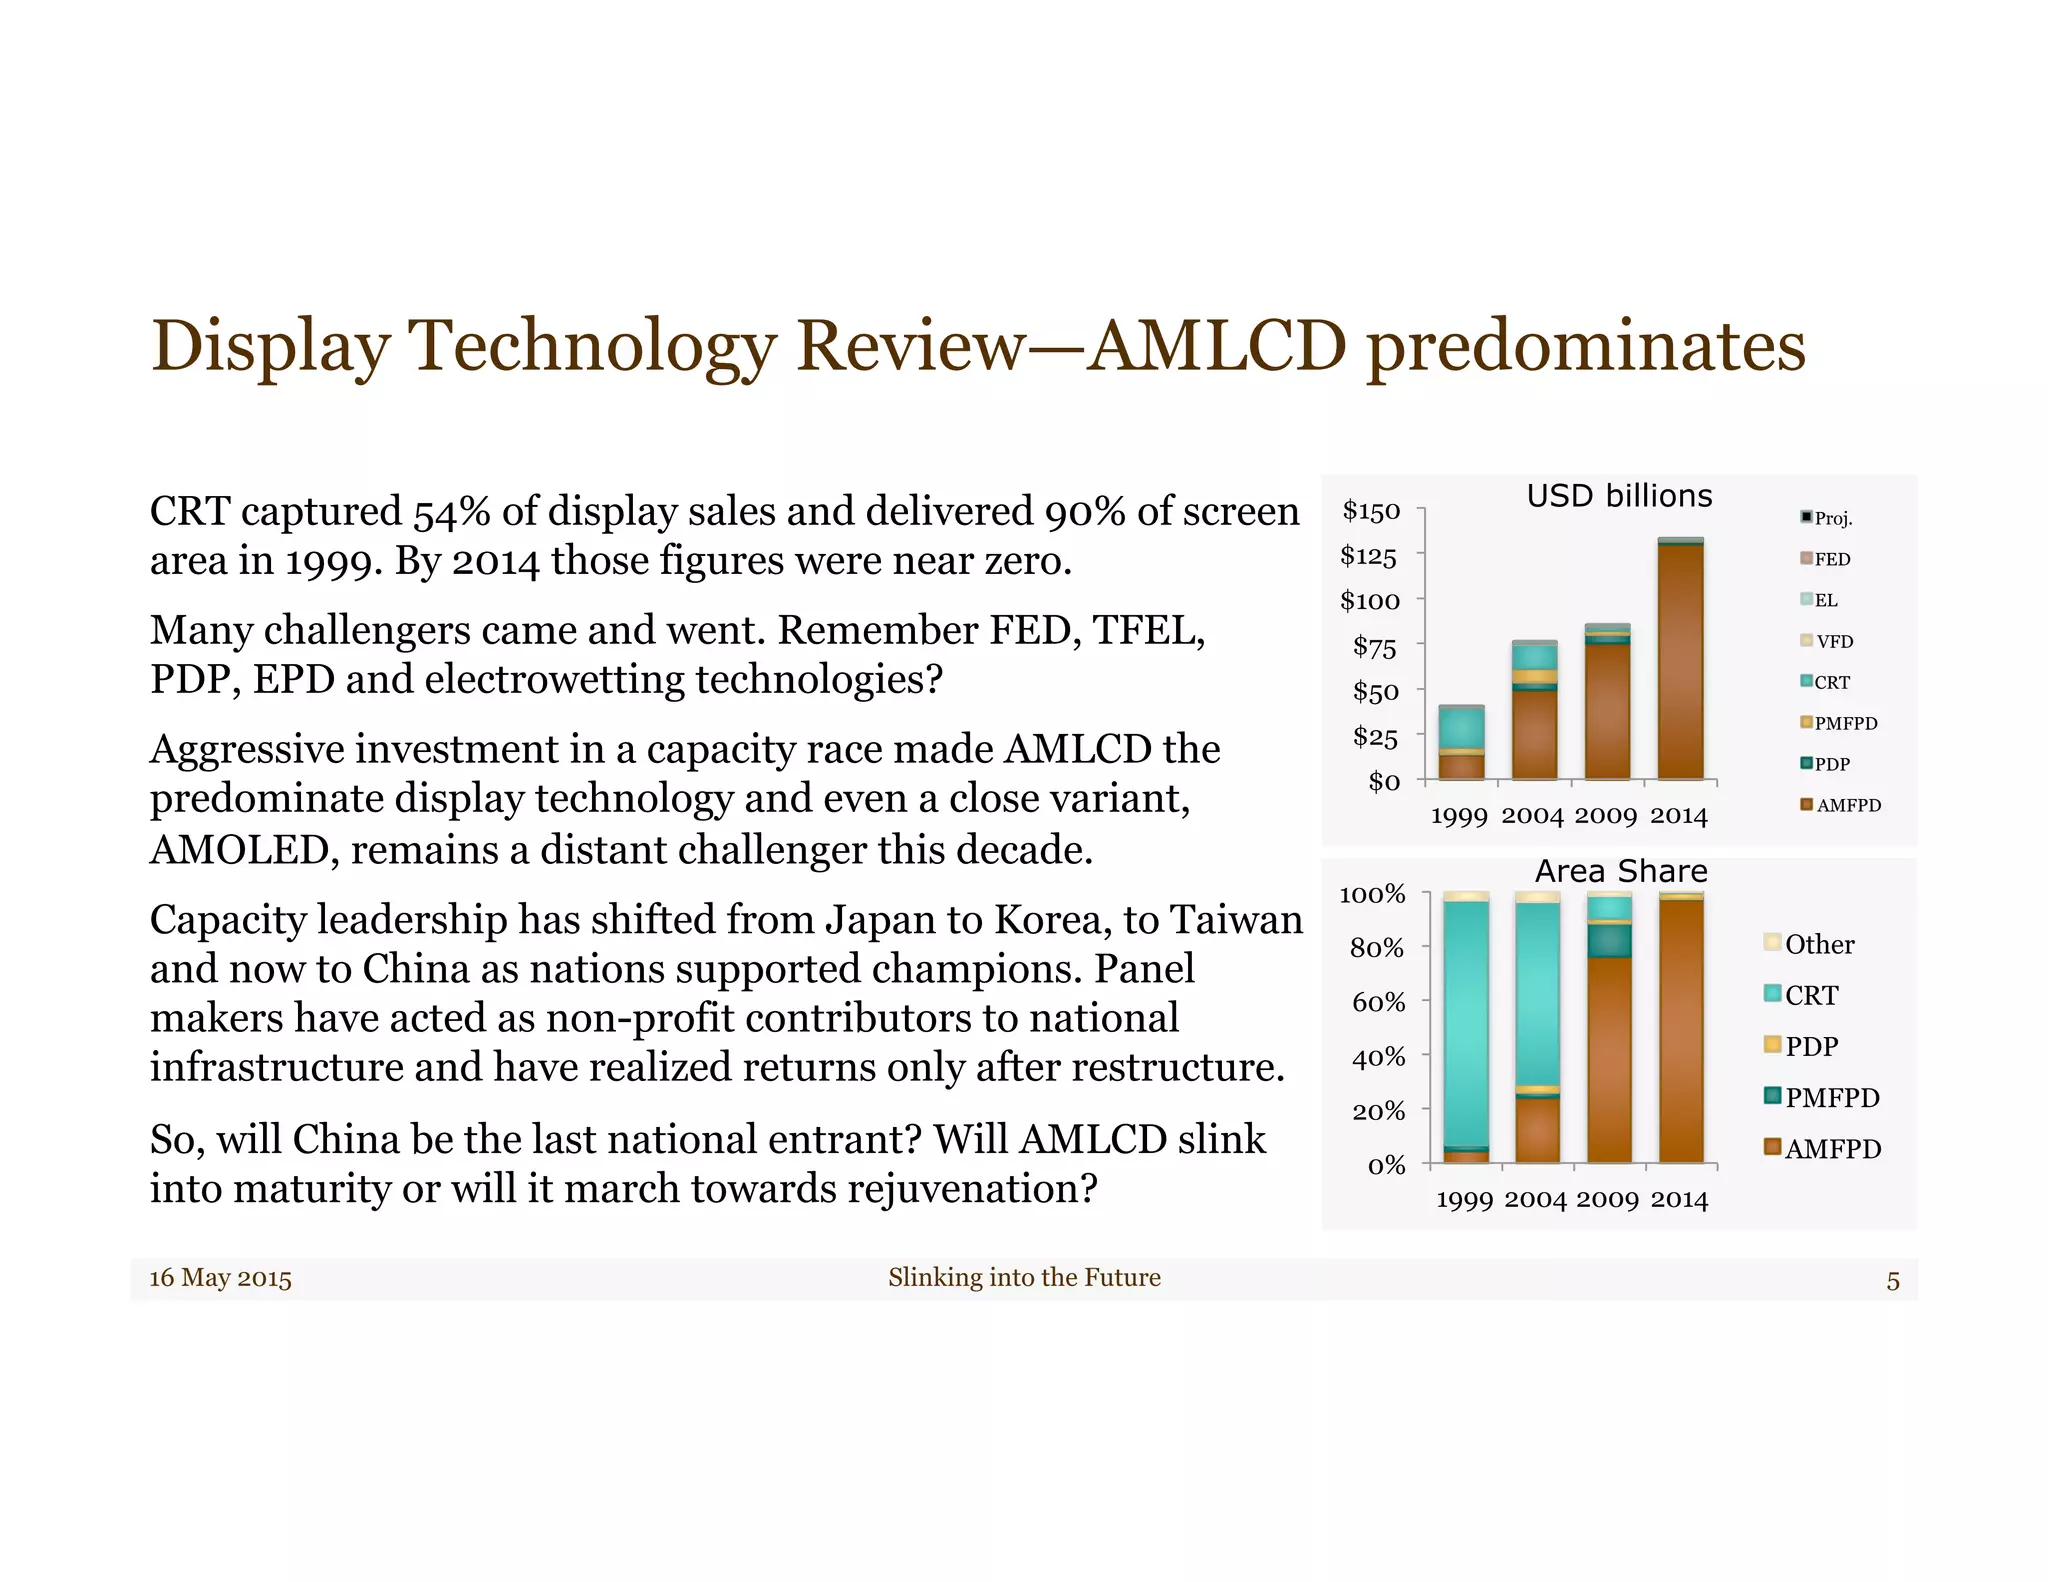
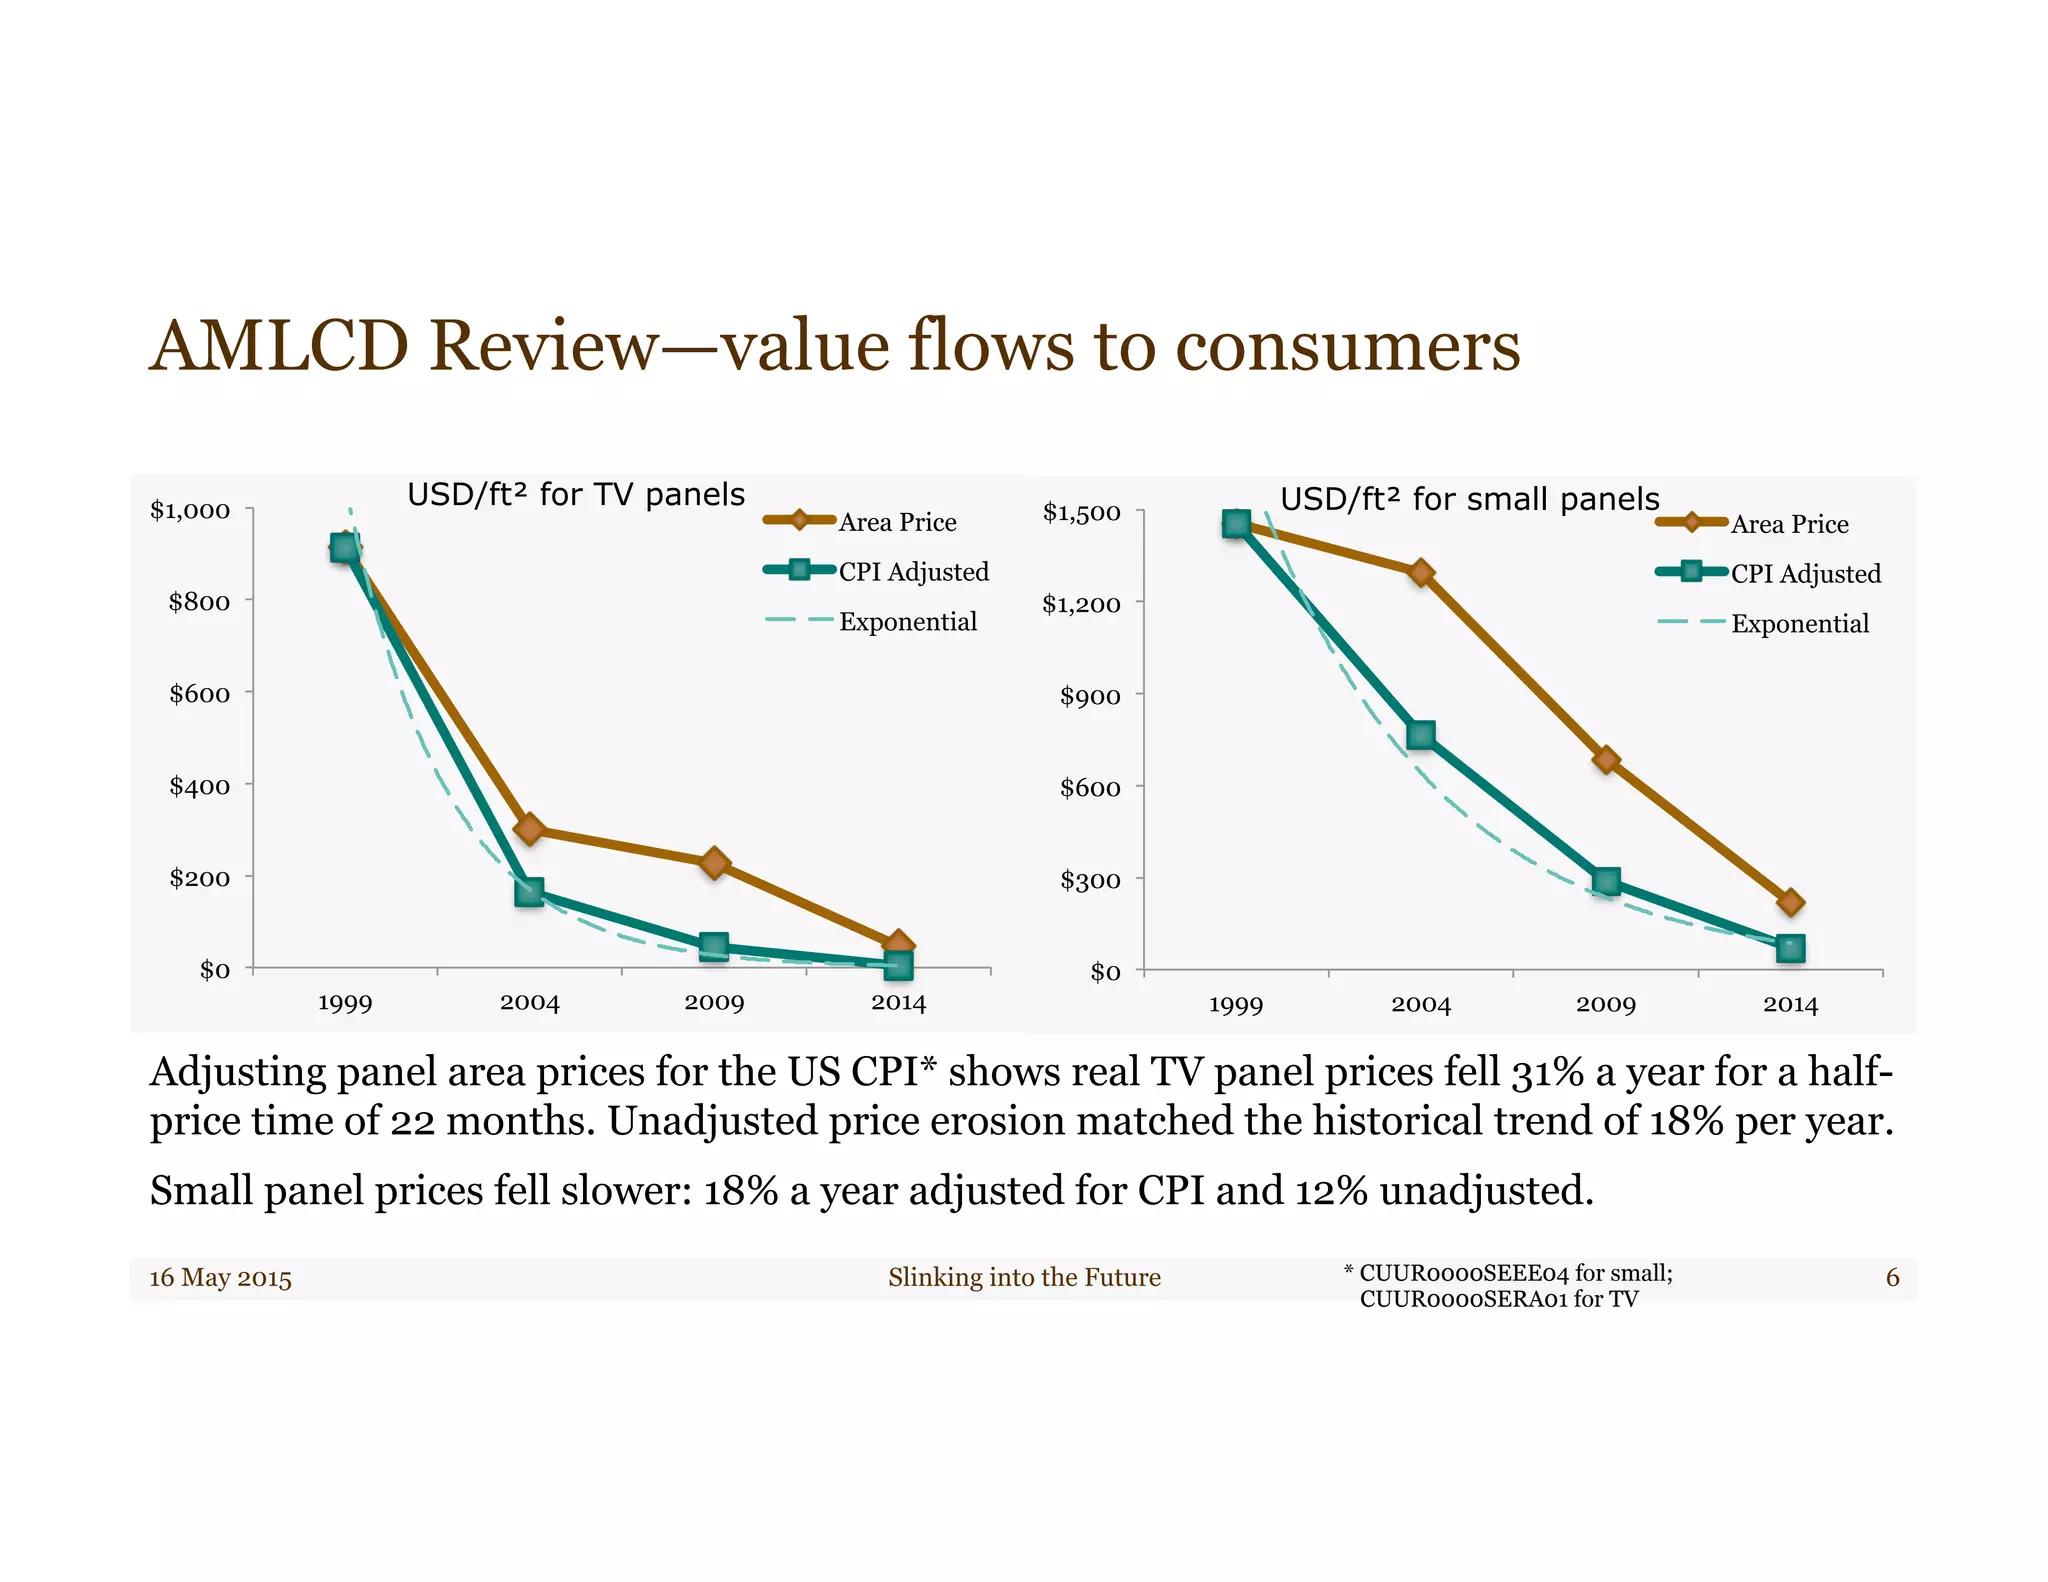
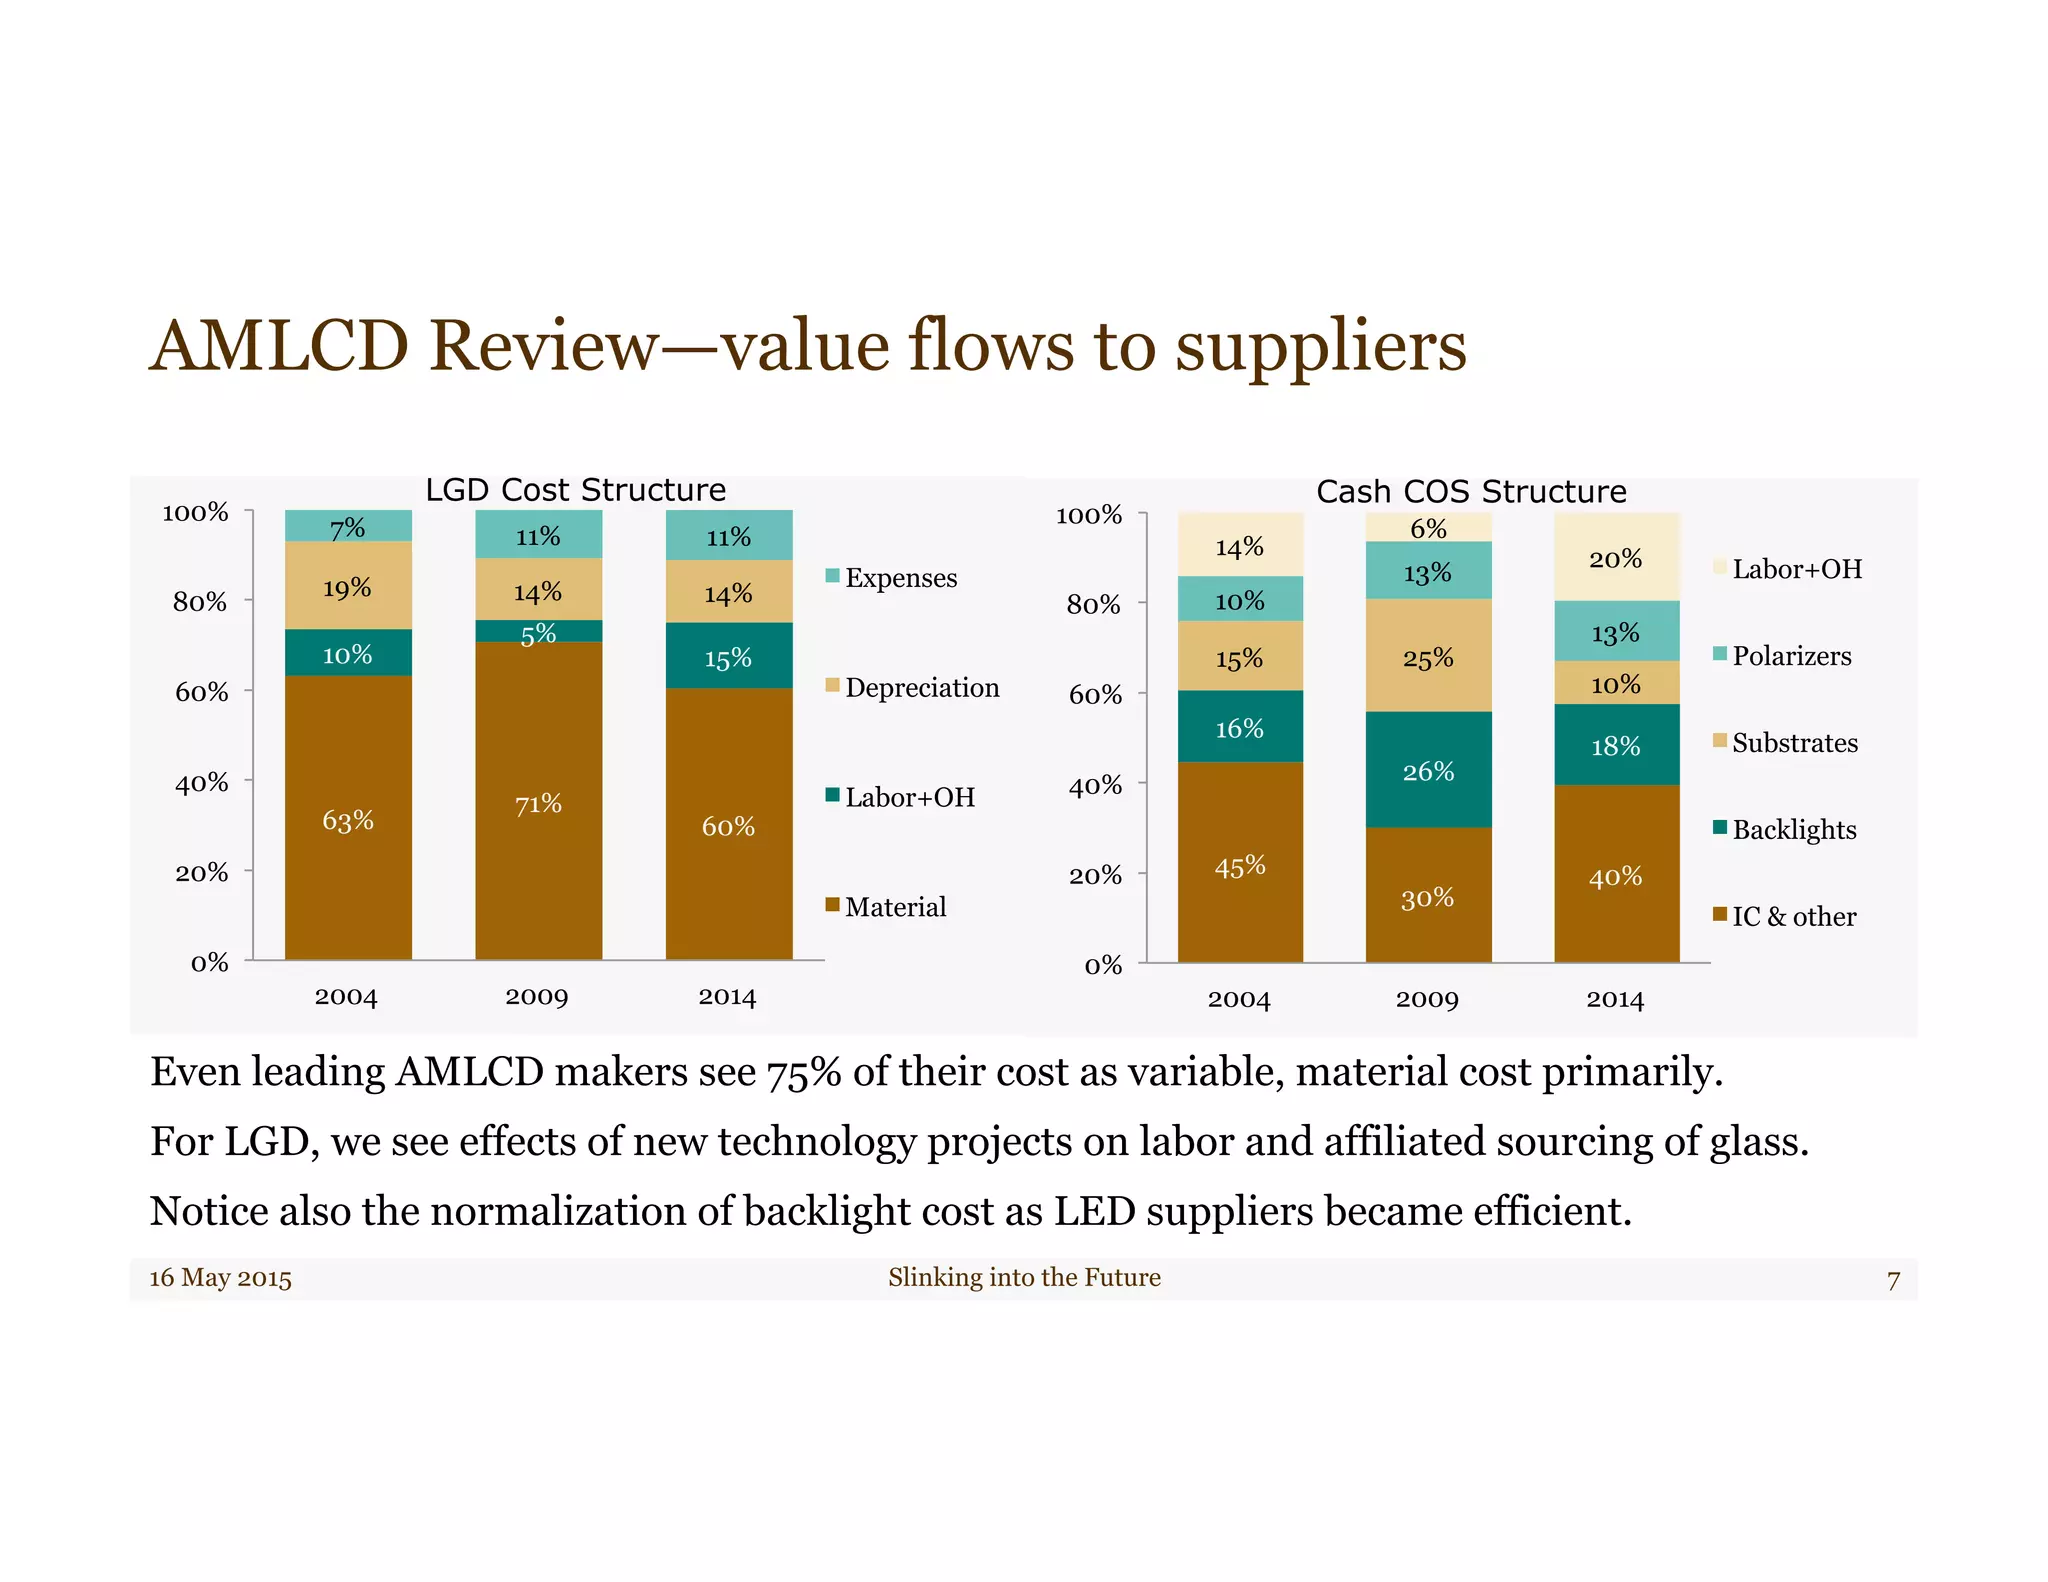
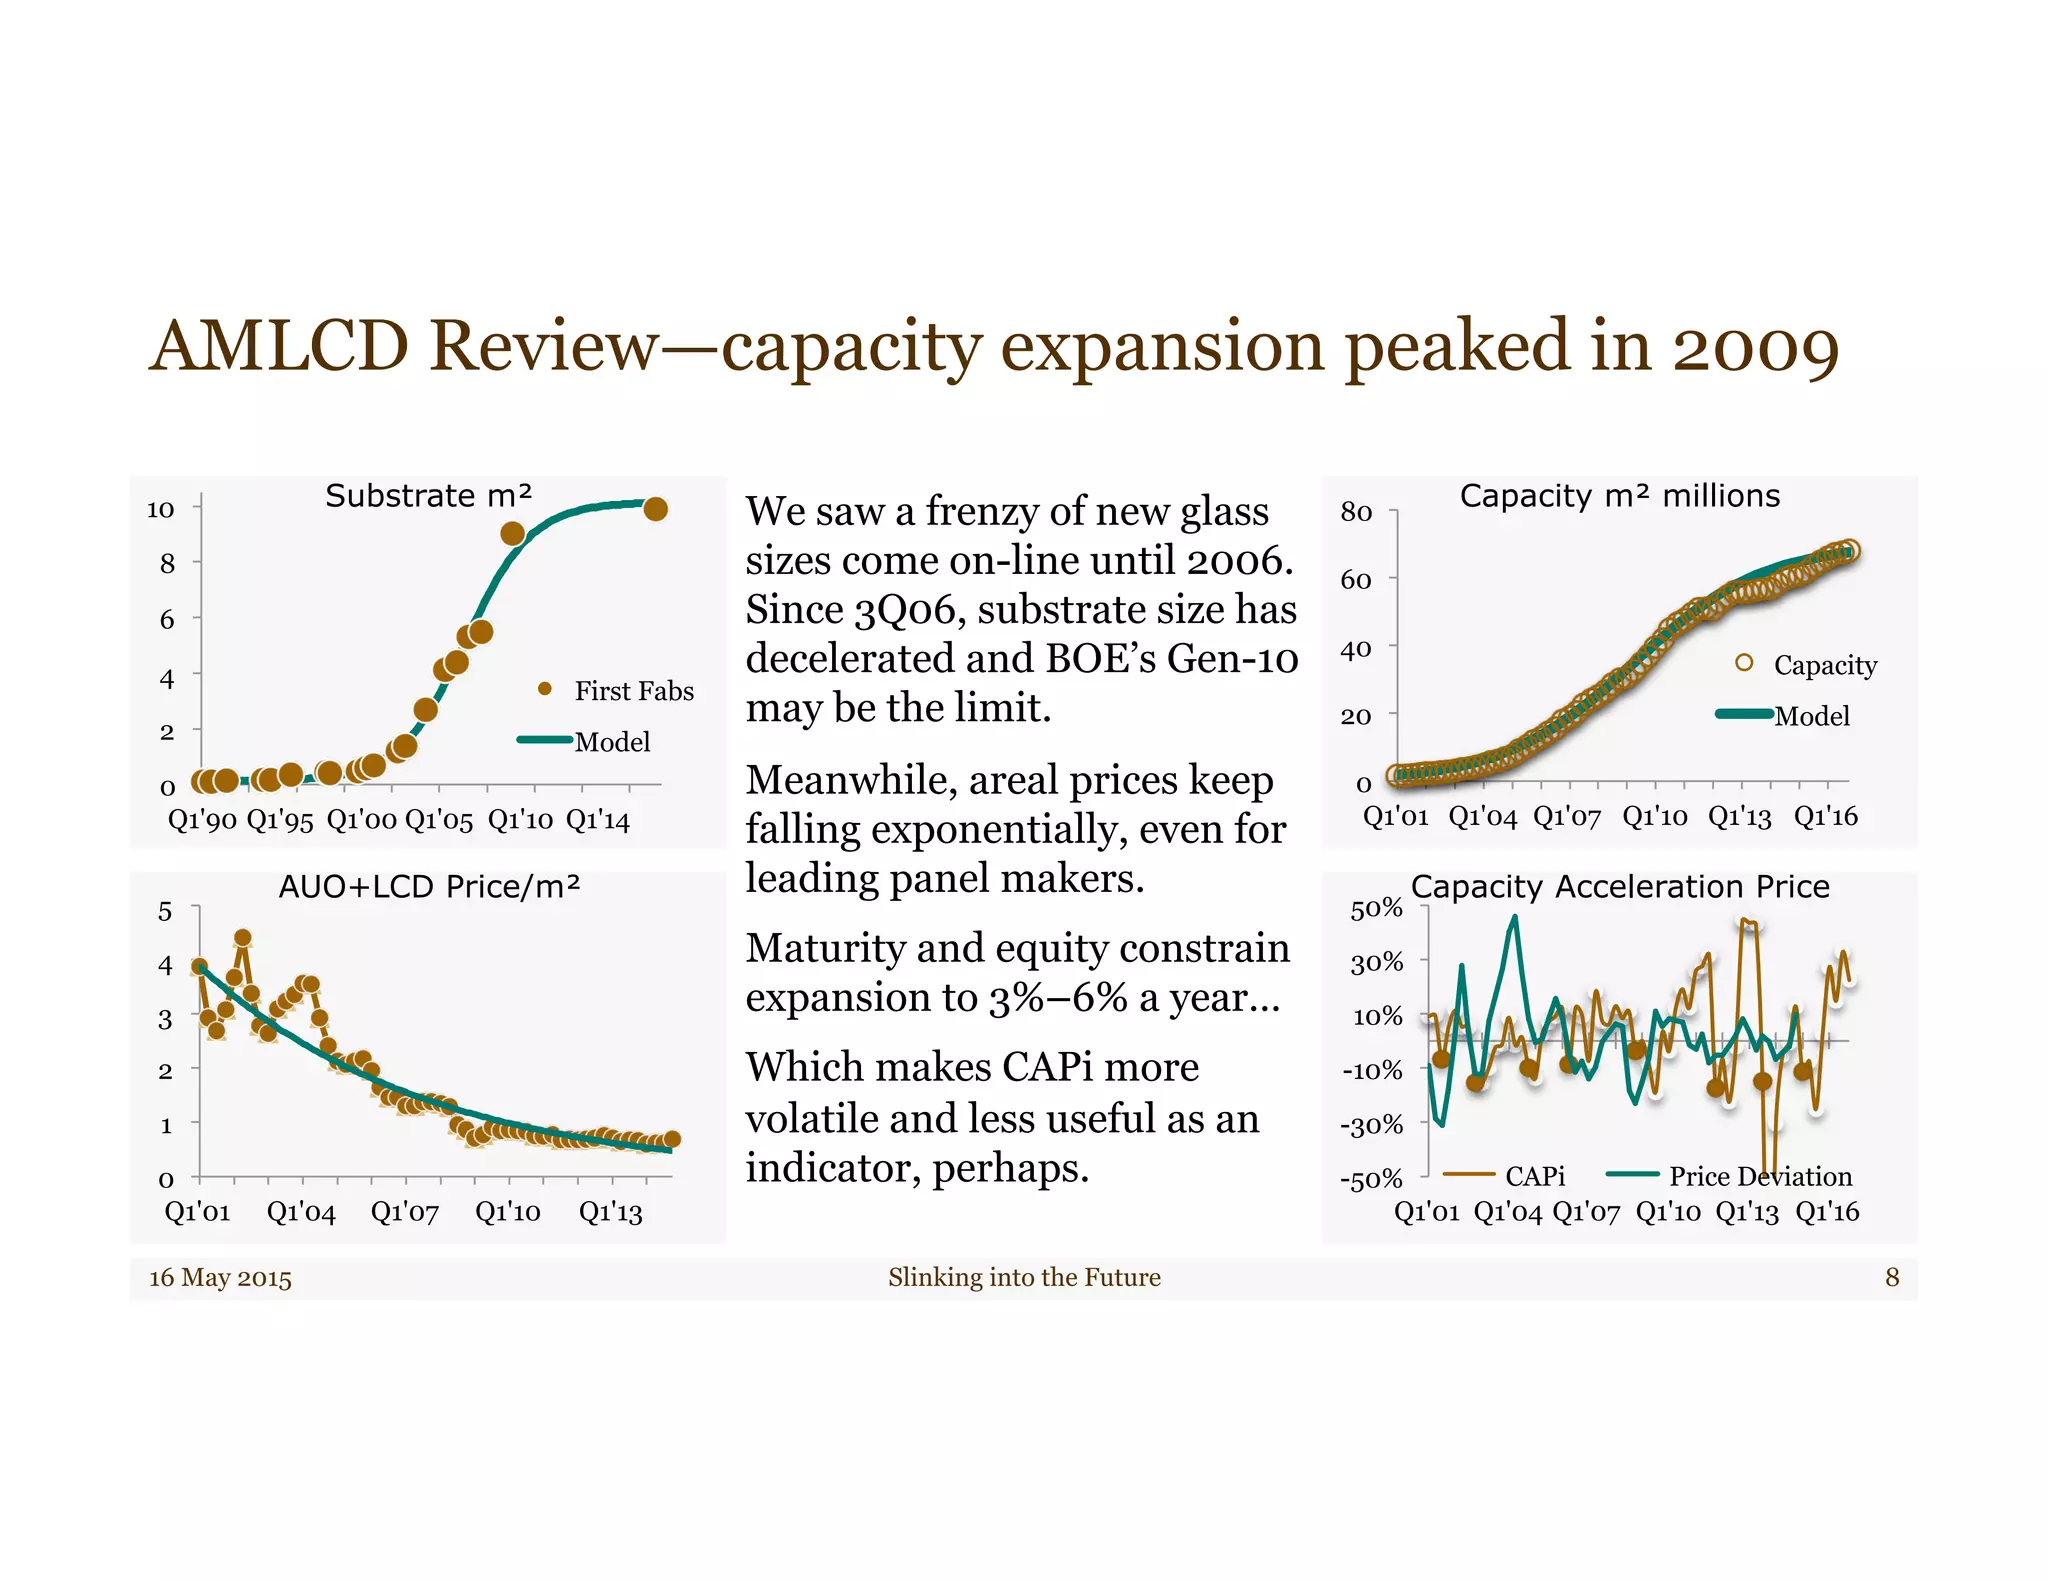
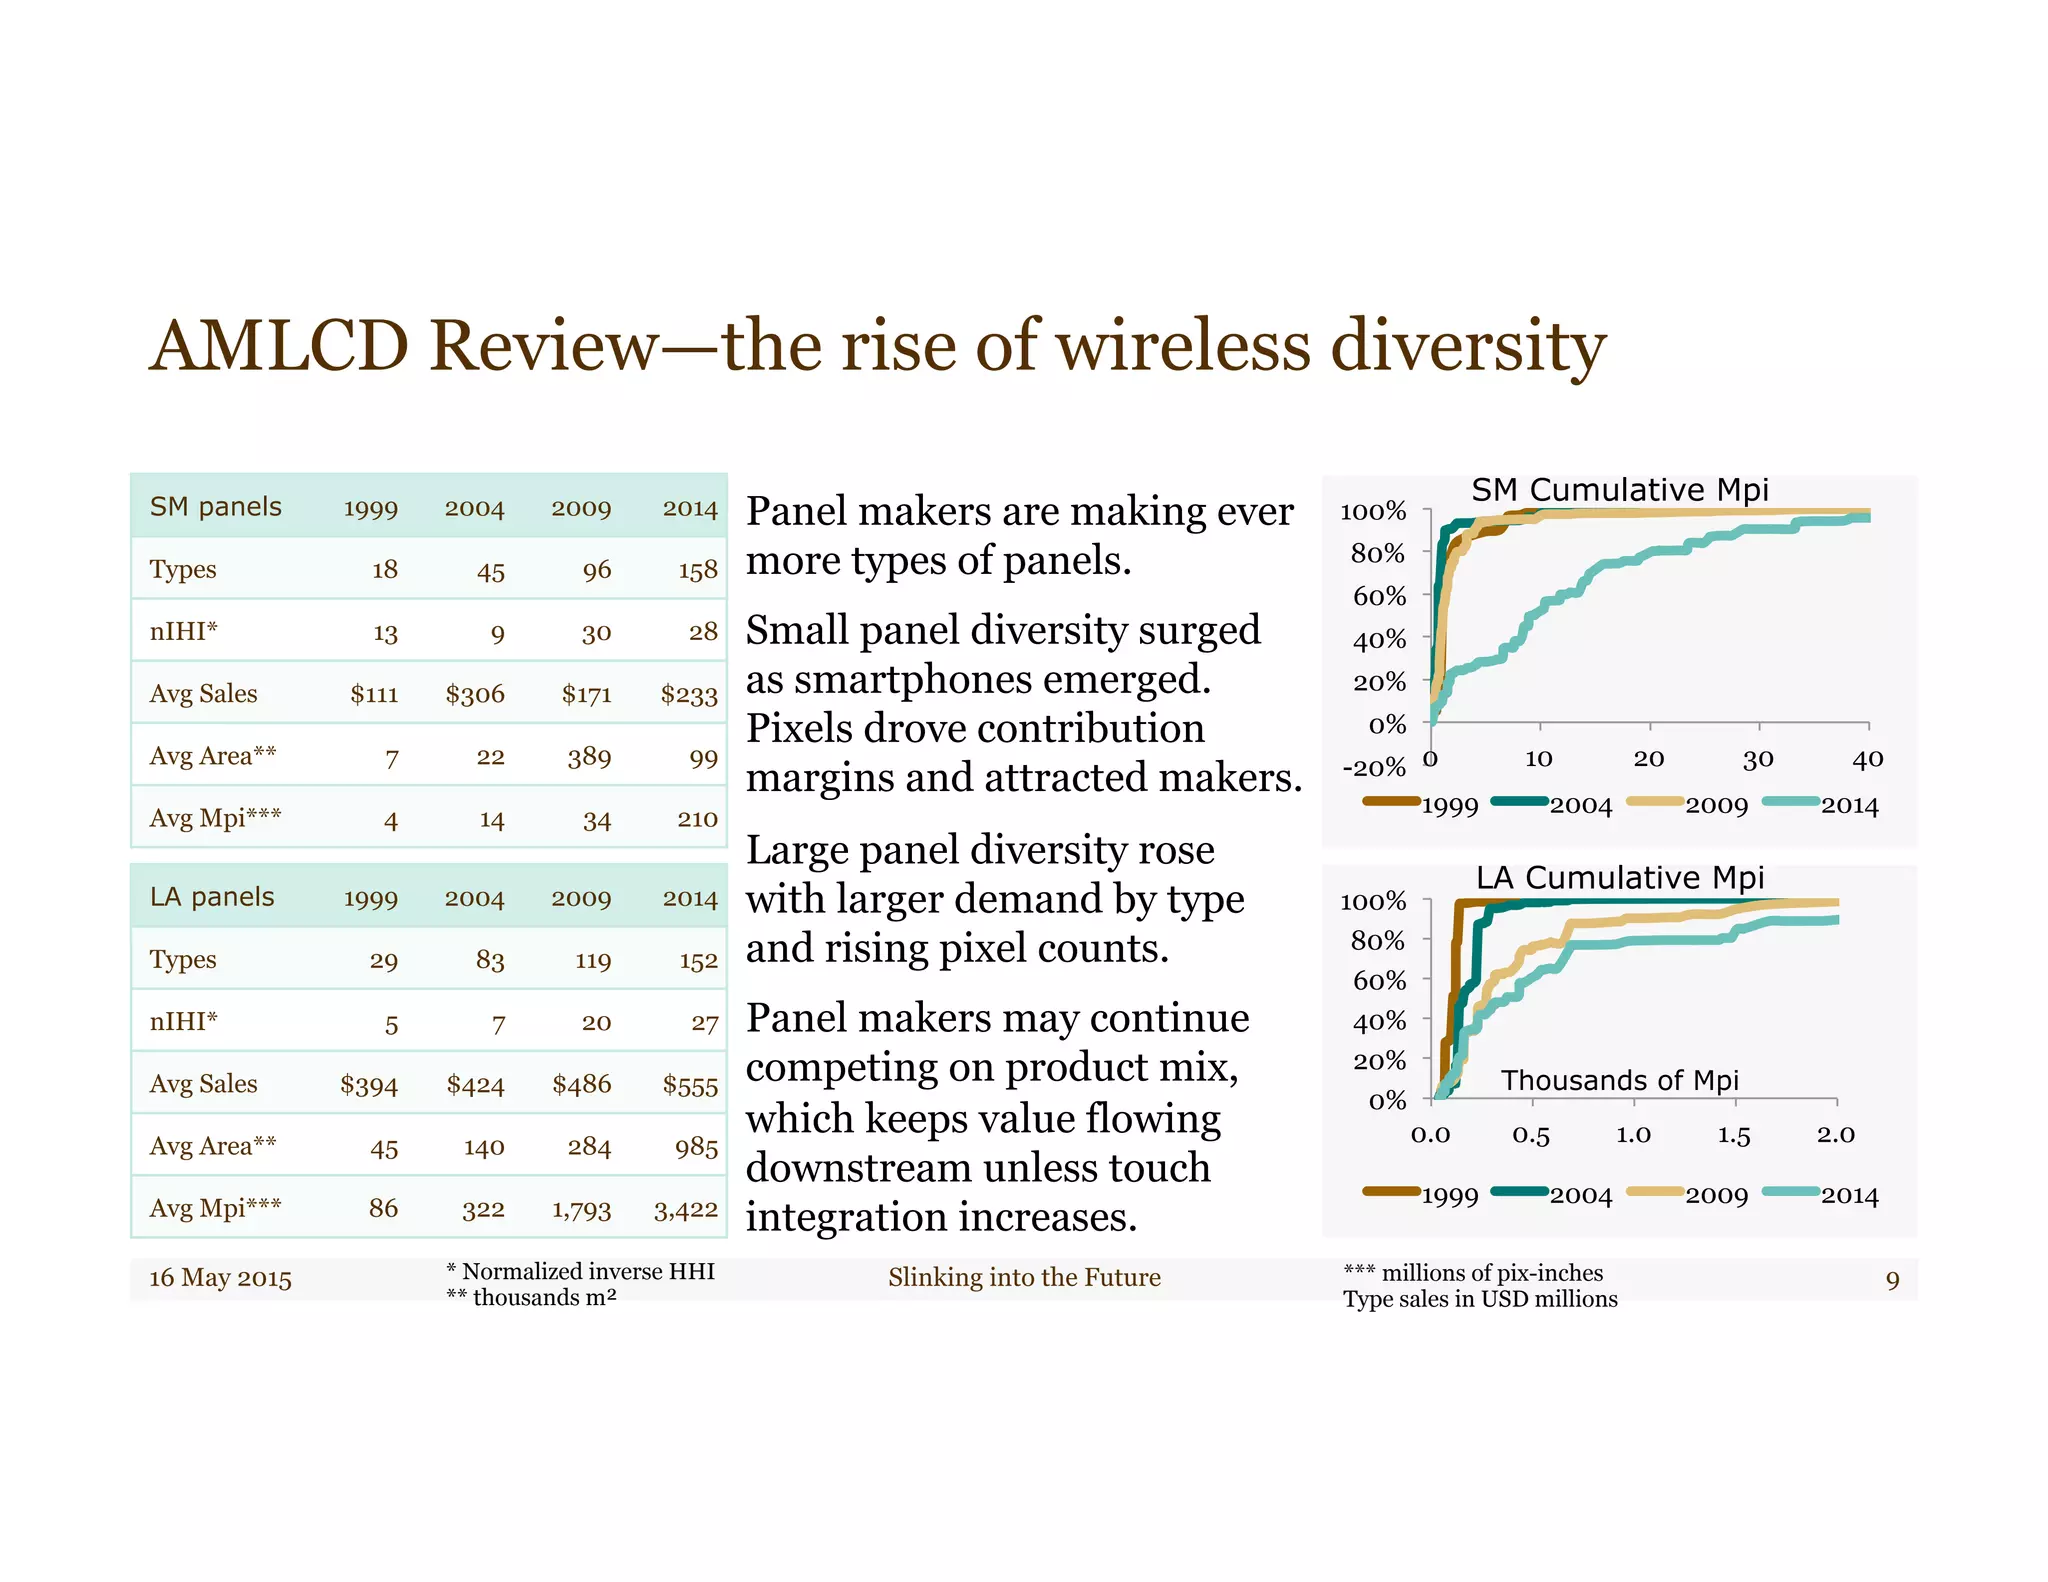
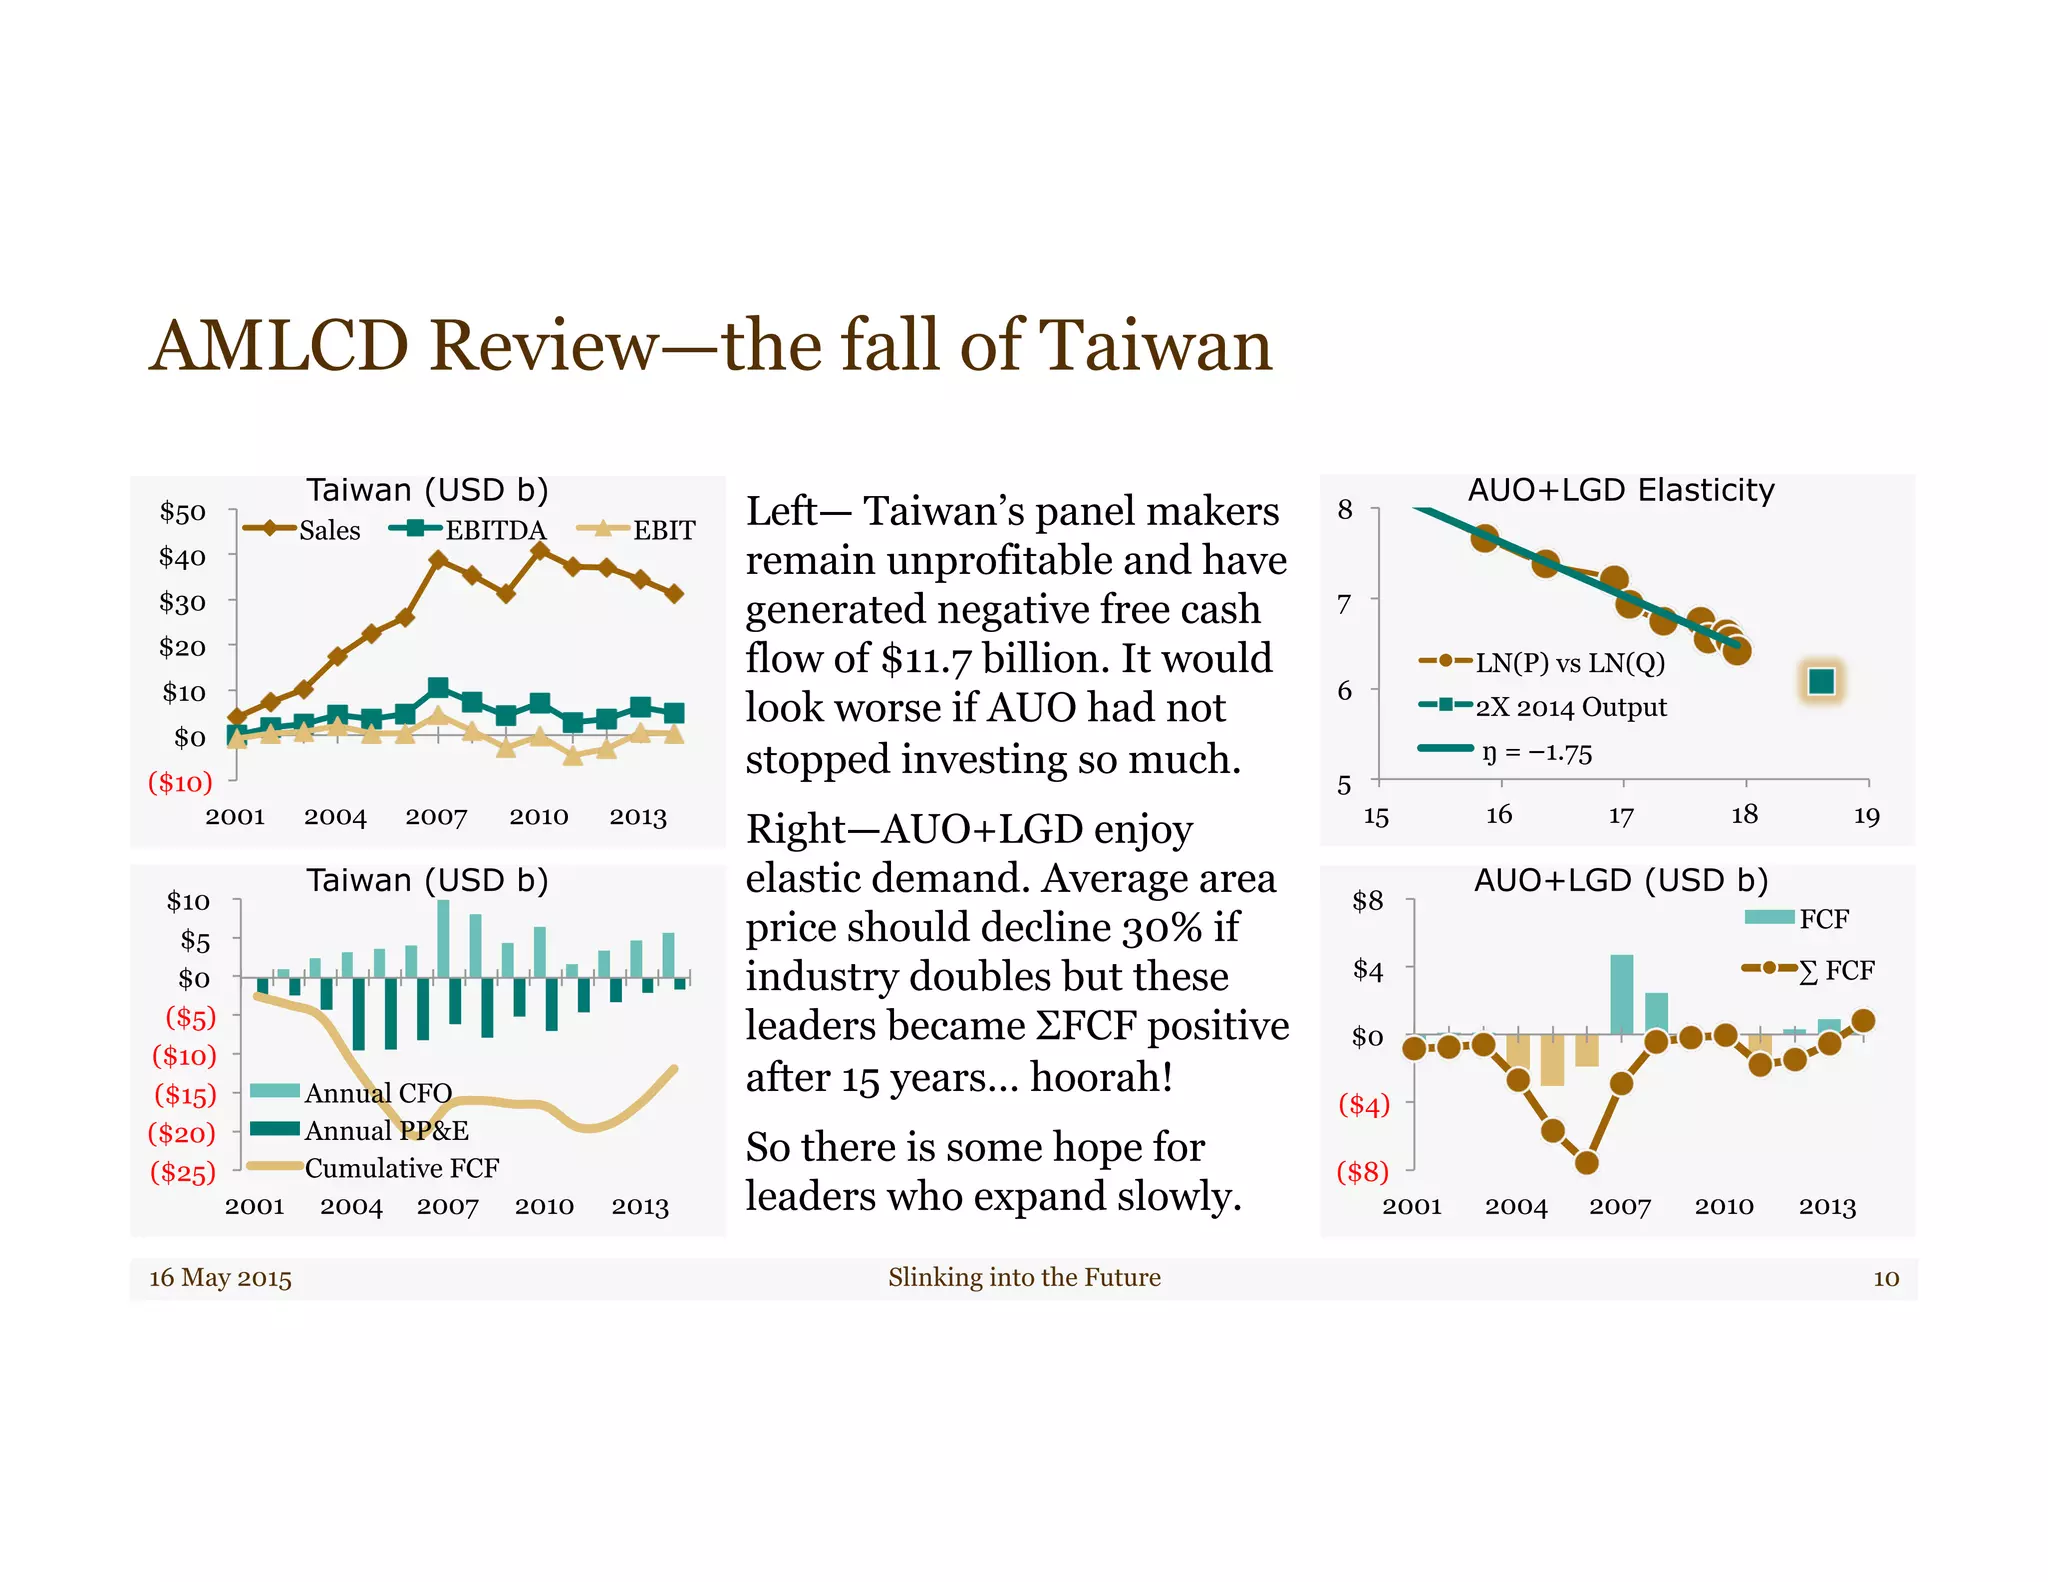
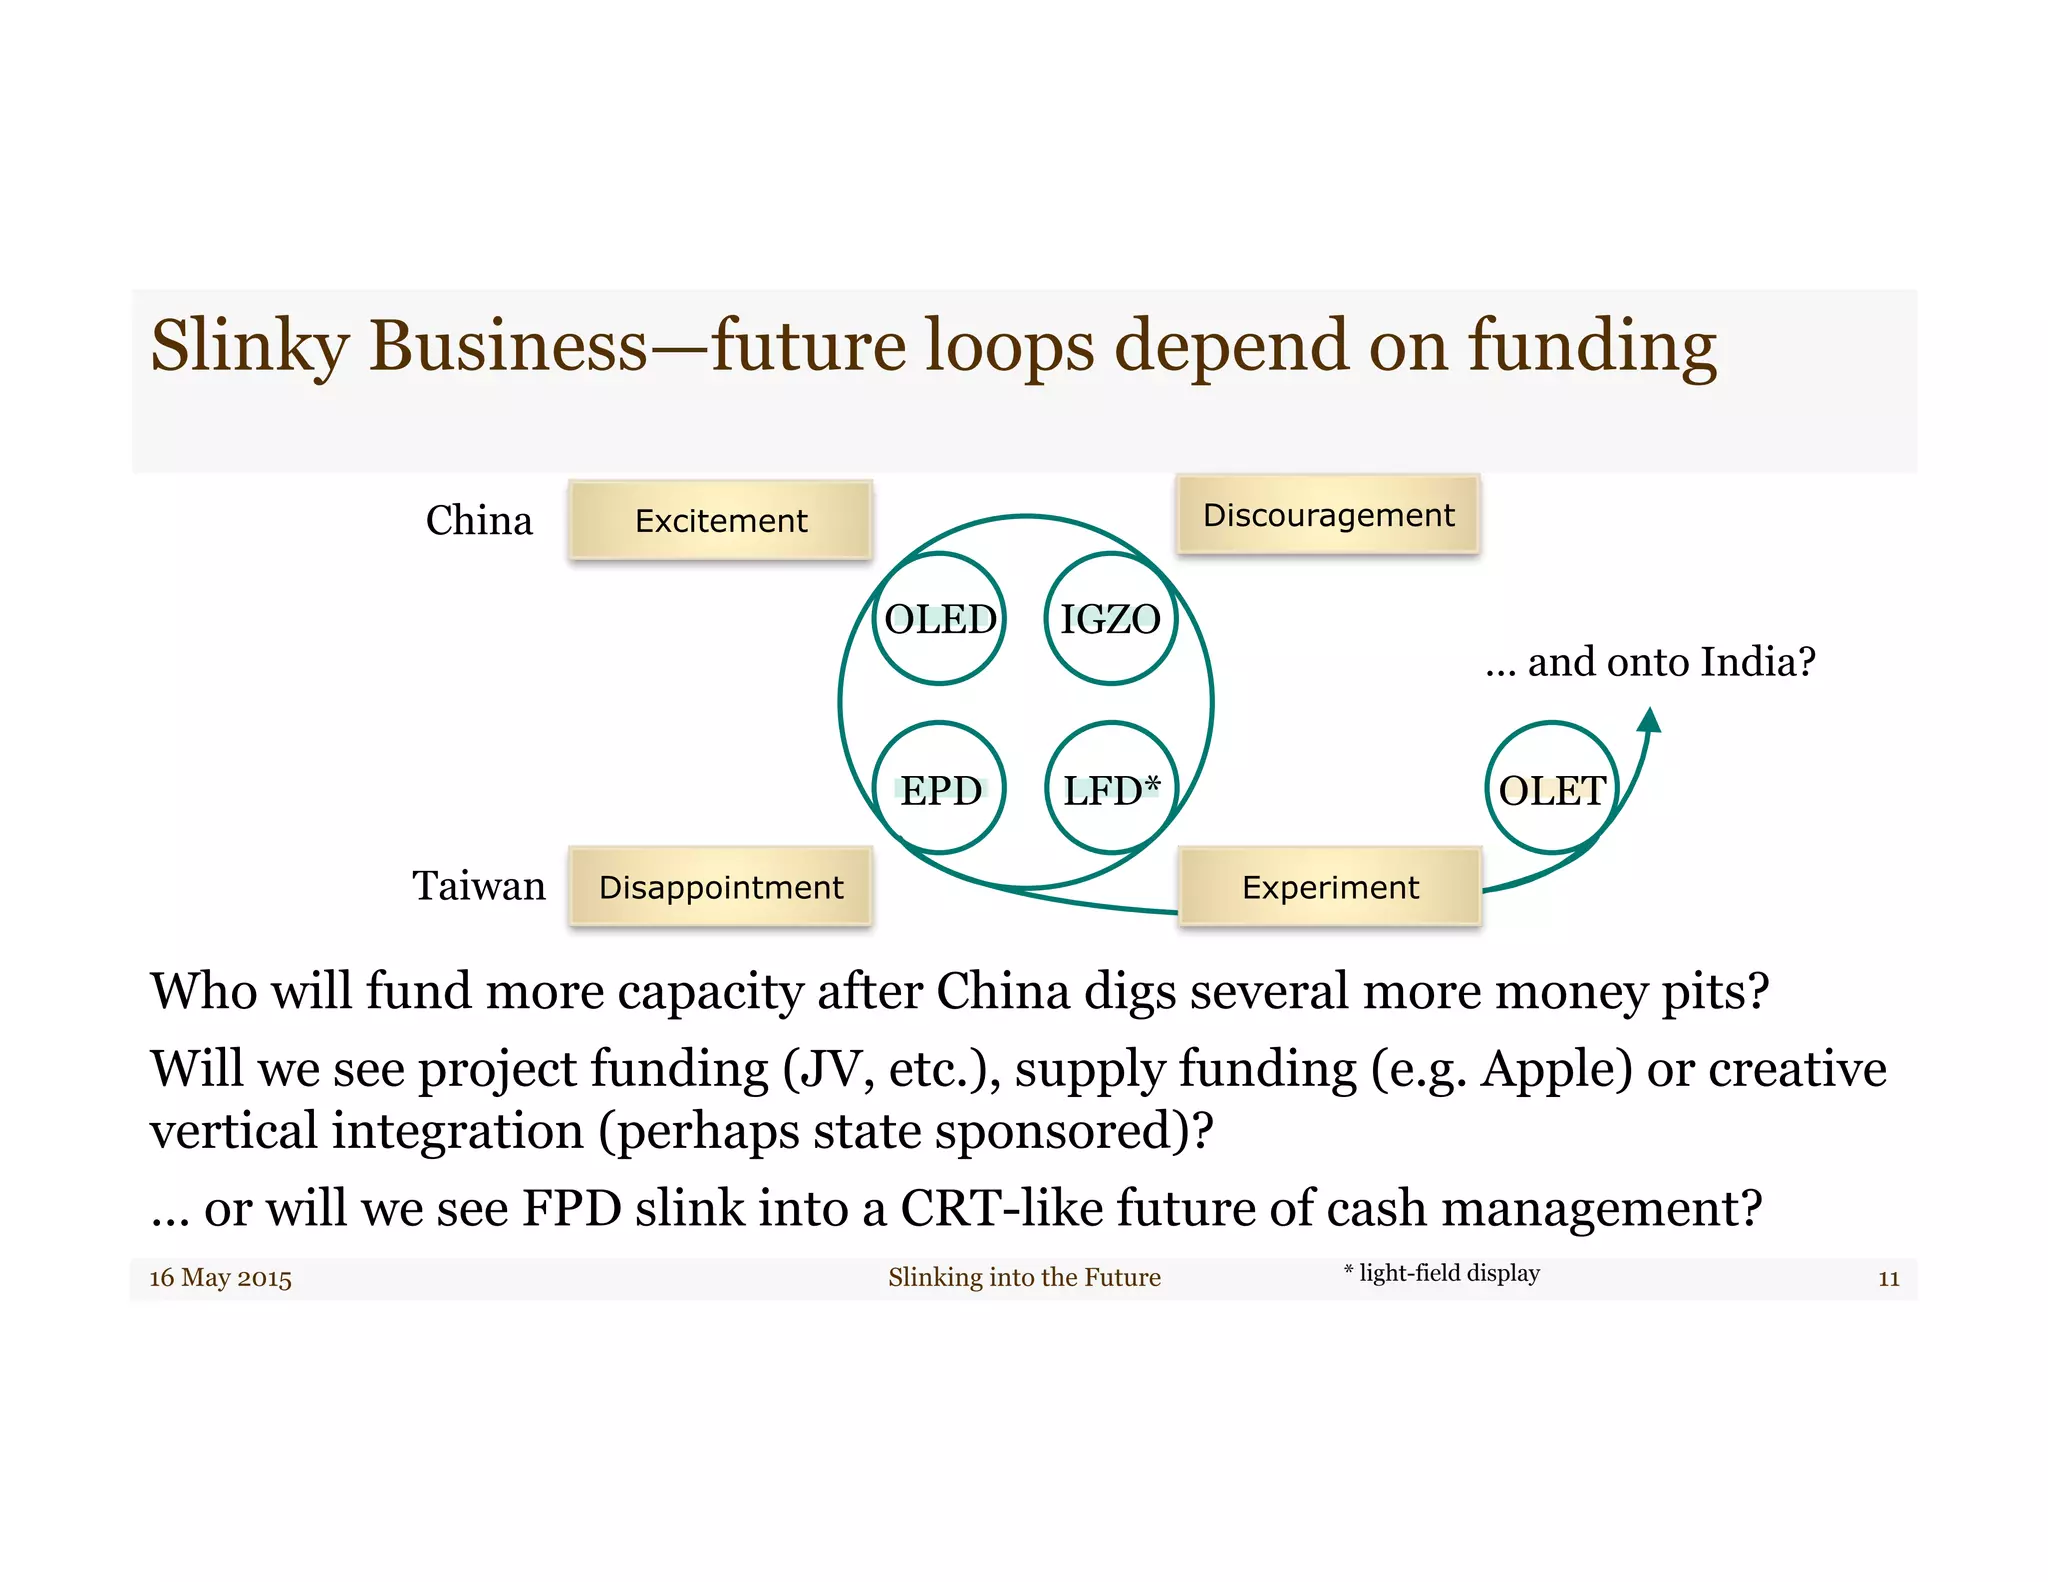

The display industry has gone through cycles of experimentation, discouragement, excitement, and disappointment over the past two decades. Liquid crystal display (LCD) technology has become the predominant display type, growing from capturing 54% of display sales in 1999 to near monopoly by 2014. LCD panel prices have declined exponentially over time, driven by aggressive capacity expansion until peaking in 2009. This has benefitted consumers but caused financial difficulties for LCD manufacturers, especially in Taiwan. The future remains uncertain, as continued growth depends on new technologies and business models for funding further capacity increases.


