Downloaded 14 times
![American Journal of Humanities and Social Sciences Research (AJHSSR) 2024
A J H S S R J o u r n a l P a g e | 215
American Journal of Humanities and Social Sciences Research (AJHSSR)
e-ISSN :2378-703X
Volume-08, Issue-02, pp-215-224
www.ajhssr.com
Research Paper Open Access
Implementation of SEM Partial Least Square in Analyzing the
UTAUT Model
Mariani, Embun Suryani, Akhmad Saufi, Raden Roro Dhiya AulianaSoesetio
(Faculty of Economics and Business, University of Mataram, Indonesia)
ABSTRACT:Partial Least Squares (PLS) Structural Equation Modeling (PLS-SEM) is a statistical technique
used to analyze the expected connections between constructs by evaluating the existence of correlations or
impacts among these constructs. The objective of this work is to employ the Structural Equation Modeling
(SEM) technique, specifically Partial Least Squares (PLS), to investigate the Unified Theory of Acceptance and
Use of Technology (UTAUT) model in the specific domain of payment technology acceptance and utilization.
The UTAUT model encompasses latent variables classified into independent, mediator, moderator, and
dependent categories. Hence, the appropriate approach, the partial least squares structural equation modeling
(PLS-SEM) method, was chosen. The rationale behind this decision is the capability of PLS-SEM to assess
models with a relatively limited dataset, as demonstrated in this study, which included a sample of 50
participants. This study employs a quantitative methodology utilizing a survey-based approach to gather data via
questionnaires. The UTAUT model in the technology acceptance and use domain was accurately assessed by
PLS-SEM, as evidenced by the findings. The findings have substantial implications for comprehending the
factors that influence the adoption of payment technology, specifically focusing on the linkages between
constructs in the UTAUT model. This research validates the model and establishes a foundation for a more
profound comprehension of user behavior in accepting and utilizing payment technologies. Ultimately, using
PLS-SEM demonstrated its efficacy in examining the UTAUT model.
KEYWORDS :Structural Equation Model, Partial Least Square, UTAUT
I. INTRODUCTION
Along with advancing the business landscape and technology, research in various fields, including
management programs, is increasing. Management research is not only confirmatory but also leads to predictive
analysis. One method that is often used is Structural Equation Modeling.
Structural Equation Modeling, also known as covariance structure analysis, latent variable analysis,
confirmatory factor analysis, and Linear Structural Relations (Lisrel) analysis, is recognized by several names
[24]. SEM can be defined as an analytical method that integrates the methodologies of factor analysis,
structural model, and path analysis. SEM is a statistical analytic technique that deals with several variables. The
procedure for processing SEM data differs from regression data processing or path analysis. SEM data analysis
is fundamentally complex, encompassing both measurement and structural models inside the SEM framework.
Structural Equation Modeling (SEM) is a collection of statistical methods that examine intricate relationships
that cannot be sufficiently explored using linear regression equations. SEM can be seen as an amalgamation of
regression analysis and factor analysis. Alternatively, it is known as Path Analysis or Confirmatory Factor
Analysis, as both are distinct versions of Structural Equation Modeling (SEM). A relationship between variables
influenced by other factors and one or more variables that impact the former can be established.
According to [6], Structural Equation Modeling (SEM) is an influential technique for conducting
comprehensive investigations of hypotheses and concepts. The outer/measurement model facilitates the
assessment of latent variables at the observational level. In contrast, the inner/structural model enables the
examination of the relationship between latent variables at the theoretical level. Structural equation modeling
(SEM) techniques offer analytical advantages by elucidating the intricate connections between variables and the
direct and indirect impacts of one or more variables on others [12]. Presently, two prevalent types of SEM are
frequently employed in research, particularly in management: covariance-based SEM (CB-SEM) and
component-based SEM.](https://image.slidesharecdn.com/v24802215224-240315055021-277ca38b/85/Implementation-of-SEM-Partial-Least-Square-in-Analyzing-the-UTAUT-Model-1-320.jpg)
![American Journal of Humanities and Social Sciences Research (AJHSSR) 2024
A J H S S R J o u r n a l P a g e | 215
American Journal of Humanities and Social Sciences Research (AJHSSR)
e-ISSN :2378-703X
Volume-08, Issue-02, pp-215-224
www.ajhssr.com
Research Paper Open Access
Implementation of SEM Partial Least Square in Analyzing the
UTAUT Model
Mariani, Embun Suryani, Akhmad Saufi, Raden Roro Dhiya AulianaSoesetio
(Faculty of Economics and Business, University of Mataram, Indonesia)
ABSTRACT:Partial Least Squares (PLS) Structural Equation Modeling (PLS-SEM) is a statistical technique
used to analyze the expected connections between constructs by evaluating the existence of correlations or
impacts among these constructs. The objective of this work is to employ the Structural Equation Modeling
(SEM) technique, specifically Partial Least Squares (PLS), to investigate the Unified Theory of Acceptance and
Use of Technology (UTAUT) model in the specific domain of payment technology acceptance and utilization.
The UTAUT model encompasses latent variables classified into independent, mediator, moderator, and
dependent categories. Hence, the appropriate approach, the partial least squares structural equation modeling
(PLS-SEM) method, was chosen. The rationale behind this decision is the capability of PLS-SEM to assess
models with a relatively limited dataset, as demonstrated in this study, which included a sample of 50
participants. This study employs a quantitative methodology utilizing a survey-based approach to gather data via
questionnaires. The UTAUT model in the technology acceptance and use domain was accurately assessed by
PLS-SEM, as evidenced by the findings. The findings have substantial implications for comprehending the
factors that influence the adoption of payment technology, specifically focusing on the linkages between
constructs in the UTAUT model. This research validates the model and establishes a foundation for a more
profound comprehension of user behavior in accepting and utilizing payment technologies. Ultimately, using
PLS-SEM demonstrated its efficacy in examining the UTAUT model.
KEYWORDS :Structural Equation Model, Partial Least Square, UTAUT
I. INTRODUCTION
Along with advancing the business landscape and technology, research in various fields, including
management programs, is increasing. Management research is not only confirmatory but also leads to predictive
analysis. One method that is often used is Structural Equation Modeling.
Structural Equation Modeling, also known as covariance structure analysis, latent variable analysis,
confirmatory factor analysis, and Linear Structural Relations (Lisrel) analysis, is recognized by several names
[24]. SEM can be defined as an analytical method that integrates the methodologies of factor analysis,
structural model, and path analysis. SEM is a statistical analytic technique that deals with several variables. The
procedure for processing SEM data differs from regression data processing or path analysis. SEM data analysis
is fundamentally complex, encompassing both measurement and structural models inside the SEM framework.
Structural Equation Modeling (SEM) is a collection of statistical methods that examine intricate relationships
that cannot be sufficiently explored using linear regression equations. SEM can be seen as an amalgamation of
regression analysis and factor analysis. Alternatively, it is known as Path Analysis or Confirmatory Factor
Analysis, as both are distinct versions of Structural Equation Modeling (SEM). A relationship between variables
influenced by other factors and one or more variables that impact the former can be established.
According to [6], Structural Equation Modeling (SEM) is an influential technique for conducting
comprehensive investigations of hypotheses and concepts. The outer/measurement model facilitates the
assessment of latent variables at the observational level. In contrast, the inner/structural model enables the
examination of the relationship between latent variables at the theoretical level. Structural equation modeling
(SEM) techniques offer analytical advantages by elucidating the intricate connections between variables and the
direct and indirect impacts of one or more variables on others [12]. Presently, two prevalent types of SEM are
frequently employed in research, particularly in management: covariance-based SEM (CB-SEM) and
component-based SEM.](https://image.slidesharecdn.com/v24802215224-240315055021-277ca38b/75/Implementation-of-SEM-Partial-Least-Square-in-Analyzing-the-UTAUT-Model-1-2048.jpg)
![American Journal of Humanities and Social Sciences Research (AJHSSR) 2024
A J H S S R J o u r n a l P a g e | 216
[6] argues that the difference between CB-SEM and PLS-SEM is based on the contrasting objectives of
the research. If the study aims to confirm and strengthen the hypothesis, then covariance-based structural
equation modeling (CB-SEM) is the appropriate methodology. Conversely, if the objective of the research is to
generate forecasts and develop theories, then the proper method would be Partial Least Squares Structural
Equation Modeling (PLS-SEM). PLS-SEM is a statistical method used for causal modeling to maximize the
explained variance in the dependent construct. Additionally, it evaluates the data's quality by analyzing the
characteristics of the measurement model.
Meanwhile, [3]states that SEM, based on components or variance, is called Partial Least Square (PLS).
This analysis tests the causality/theory model and makes predictions. PLS is utilized for doing causal-predictive
research in scenarios characterized by high complexity and limited theoretical support. It is a powerful method
based on only a few assumptions. Another opinion is that Partial Least Square (PLS) is another approach of the
Structural Equation Modeling (SEM) method that can address conflicts where the interaction between variations
is very complicated. Still, the sample size is relatively small [8]. PLS-SEM aims to examine the predicted
association between constructs by assessing the presence of a relationship or influence between them [3].
In addition, [6] present a detailed table that outlines specific criteria (Rules of Thumb) for choosing
between CB-SEM or PLS-SEM. One of the objectives is to articulate the research objectives unambiguously.
One of the tasks is to define the research goals clearly. Apply Partial Least Squares Structural Equation
Modeling (PLS-SEM) when the research aims to forecast important target constructs or uncover influential
'driving' constructs and when the study is either exploratory or an expansion of an already established structural
theory. CB-SEM is utilized when the research aims to scrutinize, authenticate, or compare various approaches.
The discussion of SEM categorizes the model's qualities into three distinct groups: focused, unfocused,
and balanced [6]. The concentrated model has limited internal variables, which are elucidated by a more
extensive set of external factors (with a minimum ratio of twice as many external variables to internal variables).
The model lacks clarity and includes multiple hidden variables and intermediary effects, in contrast to a small
number of external variables (where the number of hidden variables is at least twice the number of external
variables). Equilibrium models lie between concentrated and diffuse. The concentrated and balanced models
align with the predictive objective of PLS-SEM. CB-SEM is more suited for models that lack concentration.
[15] elucidated in their scholarly publication that biased outcomes in structural equation modeling
(SEM) occur when researchers lack knowledge of the underlying nature of the population data, whether
common factors, covariances, composites, or components characterize it. This issue is prevalent in social
science research, thus making partial least squares (PLS) the method of choice in such circumstances. In this
study, [15]examine the contrast between utilizing Partial Least Squares (PLS) for estimating standard factor
models and Covariance-Based Structural Equation Modeling (CBSEM) for evaluating composite models.
Multiple investigations using Partial Least Squares (PLS) have demonstrated that the bias resulting from PLS
estimation of standard component models is negligible, and the measurement models satisfy the minimum
suggested criteria. Furthermore, when the specific model type and population data are unknown, employing
Partial Least Squares (PLS) is the most dependable option to avoid any potential bias in the parameters.
The validity test assesses whether the measuring instrument effectively fulfills its measuring function
in alignment with the measurement objectives, ensuring that each instrument component can accurately measure
the research variable. The reliability test is conducted to assess the internal consistency of an indicator for a
latent variable and its capacity to accurately measure a constructed variable (a variable that cannot be directly
observed). A measuring equipment is deemed reliable if it continuously yields identical outcomes when
employed repetitiously.
Creating a latent variable score component is contingent upon the specification of the inner model,
which connects latent variables and represents the substantive theory, and the outer model establishes the
relationship between indicators and constructs in the measurement model. The reference is from Ghozali's work,
precisely on page 19 of the 2006 publication.
II. LITERATURE REVIEW
In the Partial Least Squares (PLS) context, evaluating the measurement model involves analyzing the
convergent and discriminant validity of the reflective indicators in the outer model and the composite reliability
for the indicator block. The coefficient of determination (R2) is the primary metric used to assess the accuracy
of the internal model. It measures the amount of variability explained by each endogenous latent variable. Aside
from the R2 value, evaluating the construct model also involves assessing the Q2 predictive relevance. This
statistic measures the degree to which the model and its parameter guesses accurately produce the observed
results.
In light of the prevailing conditions, we employed Structural Equation Modeling (SEM) with Partial
Least Squares (PLS) to examine the Unified Theory of Acceptance and Use of Technology (UTAUT) model as
the primary subject of this investigation. The UTAUT model, also known as the Unified Theory of Acceptance](https://image.slidesharecdn.com/v24802215224-240315055021-277ca38b/85/Implementation-of-SEM-Partial-Least-Square-in-Analyzing-the-UTAUT-Model-2-320.jpg)
![American Journal of Humanities and Social Sciences Research (AJHSSR) 2024
A J H S S R J o u r n a l P a g e | 217
and Use of Technology, is well recognized as a fundamental theoretical framework used to assess the
acceptability and usage of technology. The model in question was established in 2003 by Venkatesh, Morris,
Davis, and Davis, who integrated various preexisting theoretical models, including TAM (Technology
Acceptance Model), TPB (Theory of Planned Behavior), and IDT (Model of Innovation Diffusion).
The UTAUT model posits that an individual's propensity to adopt new technology is influenced by four
primary factors: Performance Expectations, Effort Expectations, Social Influence, and Facilitating Conditions.
Performance expectations are to the anticipated benefits and advantages of using technology. Effort expectation
refers to utilizing and acquiring proficiency in a particular technology. Social influence refers to the perceived
pressure or support exerted by colleagues and social networks to adopt technology. Facilitating conditions
encompass vital resources and infrastructure for enabling technology usage [24].
The UTAUT model includes both mediating and moderating variables. The association between
exogenous and endogenous dimensions in model construction frequently necessitates elucidation through
connecting or mediating factors. In SEM, aspects that establish a connection between other variables are known
as intervening variables. An intervening variable, as defined by [22], is a mediating variable that acts as an
intermediary between the independent variable (predictor) and the dependent variable (predictor). However, it is
widely recognized that Moderate Regression Analysis (MRA) is a frequently employed technique in multiple
linear regression analysis. It involves incorporating a third variable as the product of two independent variables
(exogenous) as a moderating variable [3]. Using latent variables in MRA estimation leads to an inconsistent and
biased measurement error of the estimation coefficient, resulting in a non-linear relationship. One possible
method to address this measurement inaccuracy is to utilize the SEM (Structural Equation Model) and
incorporate the interaction effect into the model [3]. Hence, the more compelling the need for employing SEM
PLS Analysis for testing in this study.
The study utilizes Smart PLS 3.0 software designed explicitly for Structural Equation Modeling (SEM)
PLS analysis. This software provides many tools that simplify user investigation of complex theoretical models.
PLS-SEM and Smart PLS 3.0 software to analyze the UTAUT model offers numerous advantages. Firstly, it
enables testing intricate theoretical models, including those with causal connections between latent variables.
Secondly, it does not necessitate data normality assumptions, allowing for examining models with abnormal
data and a limited number of samples. Lastly, it provides various features that facilitate the analysis of
theoretical models, such as bootstrapping and power analysis capabilities.
III. METHOD
General Background
The author of this paper used a quantitative methodology to examine and assess data, specifically
focusing on causal links. This analysis additionally encompasses statistical computations. The study will utilize
associative-causality research, a quantitative research method to establish the causal relationship between the
independent and dependent variables [15]. This study examines the impacts of utilizing digital payment methods
within the UTAUT framework, considering demographic variables as moderators. Additionally, there are
several techniques employed to gather data.
Data Collection Method
The authors gathered data from the source for this investigation. [22]identifies two categories of data
collecting based on the source:
1. Primary data refers to information collected directly from respondents through the completion of surveys.
2. Secondary data refers to additional information acquired from sources such as books, journals, or other
relevant materials that support this research.
The data collection was conducted utilizing the sample survey methodology. The method described involves
collecting data from a natural environment through administering a questionnaire [1]. This technique is
implemented because the chosen sample accurately represents the members of the population at the research
site. The data-gathering process will employ the questionnaire technique, which involves providing respondents
with questions or written statements to answer [21].
Population and Sample
The population encompasses the complete set of individuals, instances, or objects to whom the research
findings will be generalized [23]. The study focuses on MSME practitioners in Lombok, Indonesia. The sample
consists of individuals selected from the population and can serve as a representative sample [17]. The sampling
methodology employed in this study utilized a convenience sampling strategy. The study's sample size is
selected based on the parameters outlined by [6], which recommend that the number of samples should be 5-10
times greater than the indicator of the entire latent variable. The study's sample size comprised 50 participants.](https://image.slidesharecdn.com/v24802215224-240315055021-277ca38b/85/Implementation-of-SEM-Partial-Least-Square-in-Analyzing-the-UTAUT-Model-3-320.jpg)
![American Journal of Humanities and Social Sciences Research (AJHSSR) 2024
A J H S S R J o u r n a l P a g e | 218
Data Analysis Technique
This study utilizes the Partial Least Squares (PLS) approach with the SmartPLS 3 software package.
Partial Least Squares (PLS) is a suitable method for doing Structural Equation Modeling. It is beneficial when
dealing with complex variables, data that does not follow a Gaussian distribution, and small sample sizes (less
than 100 samples). Partial Least Squares (PLS) is a statistical technique used to reveal the relationship between
many variables and analyze structural equations. Furthermore, PLS offers the capability to do concurrent
measurement model testing and structural model testing. Measurement models are utilized to assess the
precision and reliability of tests, whereas structural models are employed for hypothesis testing to prove
causality [18].
Performing the model evaluation stage is essential in "PLS analysis." This assessment follows a two-
step methodology. Firstly, it assesses the measurement model to determine its compliance with the specified
standards. Secondly, it analyzes the structural framework and then evaluates the overall excellence of the model
[25].
Evaluation of the Measurement Model
The measuring methodology employed in this work utilizes reflective indicators, as the latent variable
indicators influence the observed indicators. The assessment of the measuring model by examining the value in
(Yamin, 2022):
a. The Loading Factor (LF) or outer loading represents the degree of correlation between each measurement
item and the variable. This metric measures the extent to which the item precisely represents or characterizes the
measurement of the variable. Based on the research conducted [11,12], it is considered appropriate to have a
latent factor (LF) value of 0.70 or higher. However, according to [2], an LF value greater than 0.50 is considered
acceptable or legitimate.
b. Composite reliability (CR) is a metric that assesses a variable's internal consistency, indicating its reliability
level. The CR value should be at least 0.6 or higher, according to [12]. According to the research conducted by
[6], a Composite Reliability score of more than 0.70 is deemed acceptable. Values within the range of 0.60 to
0.70 are considered suitable in this study.
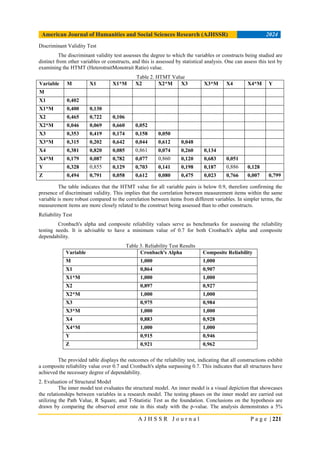
c. The Average Variance Extracted (AVE) is a statistical metric that quantifies the average amount of variance
accounted for by each measurement item within a variable. How much can the overarching variable explain the
differences in measurement items? This metric also illustrates the strong convergent validity displayed by the
variable. According to Hair et al., in 2021, the AVE value is more than or equivalent to 0.50.
Discriminant validity refers to the extent to which variables or constructs are distinct from other
variables/constructs and are subjected to statistical analysis. Discriminant validity testing is conducted at both
the variable and indicator levels. The cross-loadings measure is employed at the indicator level. At the same
time, the Fornell-Lacker Criterion is used at the variable level to compare the AVE root with the correlation
between variables. Another measure used to test discriminant validity is HTMT (HeterotraitMonotrait Ratio). It
evaluates the validity by checking if the HTMT value is less than 0.9 [11,12].
Structural Model Evaluation
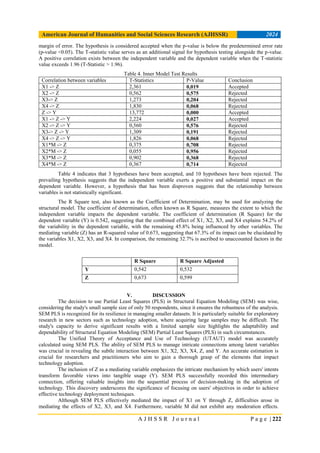
This structural model evaluation aims to perform hypothesis testing to determine causation. Hypothesis
testing utilizes the bootstrapping technique, explicitly employing the percentile approach. The t-test is the
statistical test used in this approach. The t-values obtained from the two-way test (two-tailed test) suggest a
significance level of 5% and have a value of 1.96. The test conditions for the t-test comprise evaluating whether
the t-statistic value exceeds the critical t-value or if the significance value is below 0.05. If any of these
conditions are satisfied, it can be inferred that there is a substantial impact on the relationship between variables
[25].
Evaluation of Model Quality and Fit
Assessing the model's quality involves analyzing the model. The model's acceptability can be evaluated
by many measures, including R square, Q square, F square, and SRMR [25].
1. R Square
The R square value quantifies the collective impact of exogenous and endogenous variables on the remaining
endogenous variables in the model. [2] found that the R square value is 0.67, which suggests a significant
correlation. Additionally, the value of 0.33 indicates a moderate link, while the value of 0.19 suggests a weak
association.
2. Q Square
Q Square assesses the predictive importance of the model by evaluating its accuracy in making predictions and
its capacity to forecast endogenous variables based on changes in external variables. A positive value of Q](https://image.slidesharecdn.com/v24802215224-240315055021-277ca38b/85/Implementation-of-SEM-Partial-Least-Square-in-Analyzing-the-UTAUT-Model-4-320.jpg)
![American Journal of Humanities and Social Sciences Research (AJHSSR) 2024
A J H S S R J o u r n a l P a g e | 219
square suggests that the exogenous factors have predictive relevance for the endogenous variables. Q square
values of 0, 0.25, and 0.50 correspond to low, moderate, and good predictive accuracy, respectively [9].
Calculation of the area of a square
3. F Square
The F square measures the extent of the impact that the variables in the structural model or the exogenous latent
variables have on the endogenous variables. This measure is determined by comparing the R square value
achieved when variables are added or removed from the structural model. The F square value in [6] study can be
interpreted as follows: 0.02 indicates a little impact size, 0.15 indicates a moderate effect size, and 0.35 indicates
a big effect size.
IV. RESULTS
The process of data analysis in PLS-SEM involves splitting the test into two distinct sections: the
Evaluation of the Measurement Model and the Evaluation of the Structural Model.
1. Evaluation of the Measurement Model
The Measurement Model refers to a framework used to quantify and assess various aspects or variables
of interest systematically and precisely. Evaluation elucidates the connection between the construct and its
indicators. The measurement model assesses data to ascertain its validity and reliability. When evaluating the
measurement model, two validity tests are conducted: Convergent validity pertains to the extent to which two
measures, intended to assess the same concept, exhibit a meaningful relationship with each other. Discriminant
validity pertains to the extent to which two measures, intended to assess distinct variables, exhibit no correlation.
Convergent Validity Test
The assessment of the measurement model's convergent validity is established by examining the values
of the outer loadings and applying the AVE parameter. The threshold value employed for outer loadings in
confirmatory research is 0.5. For explanatory research, the maximum limit for outside loadings is set at 0.6. The
upper threshold for outside loadings in development studies is 0.5. The maximum threshold for the outer
loadings in this investigation is set at 0.7.
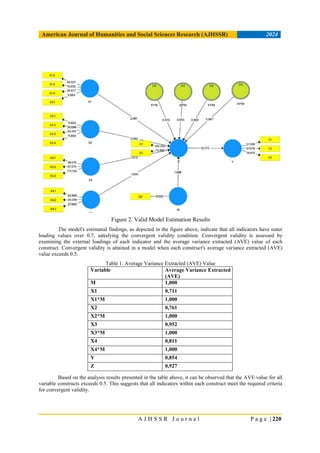
Figure 1. Overall Model Estimation Results
According to the data analysis, there are certain indicators with outer loading values below
0.7, which makes them invalid and necessitates their removal from the model. The estimation results
obtained after excluding several indicators from the model are as follows:](https://image.slidesharecdn.com/v24802215224-240315055021-277ca38b/85/Implementation-of-SEM-Partial-Least-Square-in-Analyzing-the-UTAUT-Model-5-320.jpg)
![American Journal of Humanities and Social Sciences Research (AJHSSR) 2024
A J H S S R J o u r n a l P a g e | 223
These issues indicate that the connections within the UTAUT model are complex and impacted by elements
that were not considered in this study. Subsequent investigations could examine supplementary factors or
contextual intricacies to tackle these intricacies.
VI. CONCLUSION
This study effectively showcased the application of SEM-PLS analysis to examine the UTAUT model
in the specific context of acceptance and utilization of payment technology. The utilization of SmartPLS 3
software enabled a thorough and unambiguous assessment of the measurement and structural models. This
methodology can be utilized to assess the UTAUT model in many contexts, producing reliable and credible
results. The findings of this study have significant ramifications for scholars and practitioners involved in the
field of Structural Equation Modeling (SEM) using Partial Least Squares (PLS).
VII. ACKNOWLEDGEMENTS
This research is supported by Mataram University, where the author pursued education. We express
our gratitude to Embun Suryani, SE., M.Si., Ph.D., and H. Akhmad Saufi, SE., M.Bus., Ph.D., the thesis adviser,
for providing moral support, valuable advice, and consistent supervision, which are essential to the realization of
the study. We thank the American Journal of Humanities and Social Sciences Research (AJHSSR) for allowing
the author to share insights with the community through its scholarly journal. Our appreciation also goes to all
parties who guided and assisted in completing this research.
REFERENCES
[1] Arifin, Z. (2020). MetodologiPenelitian Pendidikan Education Research Methodology. STIT Al-Hikmah
Bumi Agung Way Kanan, 1(1), 1–3.
[2] Chin, W. W. (1998). The Partial Least Squares Approach to Structural Equation Modeling. Modern
Methods for Business Research, 295, 336.
[3] Ghozali, H.I & Latan, H. (2015). Partial Least Squares, Konsep, Teknik dan Aplikasi, menggunakan
program Smart PLS 3.0. Badan Penerbit-Undip.
[4] Hair, et al.(1998). Multivariate Data Analysis, Fifth Edition, Prentice Hall, Upper Saddle. River: New
Jersey
[5] Hair J.F., et al. (2010). Multivariate Data Analysis. Seventh Edition. New Jersey: Pearson Prentice Hall.
[6] Hair, et al. (2011). Multivariate Data Analysis (7th ed.). New Jersey: Pearson Prentice Hall.
[7] Hair, J.F., Ringle, C.M. & Sarstedt, M. (2011). PLS-SEM: Indeed, A Silver Bullet. Journal of Marketing
Theory and Practice. Vol. 19. No. 2. Pp. 139-151.
[8] Hair, J.F., Sarstedt, M., Ringle, C.M. & Mena, J.A. (2011). An Assessment of the Use of Partial Least
Squares Structural Equation Modeling in Marketing Research. Journal of the Academic Marketing
Science.
[9] Hair, J. F., et al. (2019). Partial Least Squares Structural Equation Modeling-Based Discrete Choice
Modeling: An Illustration In Modeling Retailer Choice. Business Research. 12(1): 115-142.
[10] Hair, J. F., J. J. Risher, M. Sarstedt, dan C. M. Ringle. (2019). When to Use and How to Report the
Results of PLS-SEM. European Business Review. 31(1): 2-24.
[11] Hair et al. (2021). A Primer on Partial Least Squares Structural Equation Modeling (PLS-SEM) Using R.
United States of America: SAGE Publications, Inc.
[12] Jorg Henseler et al. (2009), The Use Of Partial Least Squares Path Modeling In International Marketing,
New Challenges to International Marketing, Advances in International Marketing, Volume 20, 277–319,
Copyright 2009 by Emerald Group Publishing Ltd., 2009.
[13] K, Naresh. Malhotra. (2009). Riset PemasaranPendekatanTerapan (EdisiKeempat). Indeks. Economic
and Business Review.
[14] Mustafa, Z., dan Wijaya, T. (2012). Panduan Teknik Stastistik SEM & PLS dengan SPSS AMOS:
Konsep Dasar SEM dan PLS, Pengenalan AMOS dan SmartPLS, Contoh dan Penerapan SPSS AMOS
dan Smart PLS. Cahaya Atma Pustaka, Yogyakarta.
[15] Sarstedt, M., Hair, J.F., Ringle, C.M. &Gudergan, S.P. (2016). Estimation Issues with PLS and CBSEM:
Where the Bias Lies! Journal of Business Research. Vol. 69.
[16] Schermelleh-Engel, K., Moosbrugger, H., & Müller, H. (2003). Evaluating the fit of structural equation
models: Tests of significance and descriptive goodness-of-fit measures, Methods of Psychological
Research Online, 8(2), hlm. 23-74.
[17] Sekaran, Uma dan Roger Bougie. (2017), Metode PenelitianBisnis, Edisi 6, Jakarta: Penerbit
SalembaEmpat.
[18] Setiaman, S. (2023). Tutorial Analisa Parsial Model PersamaanStrukturalDengan Software SMART-PLS
Versi 3 Untuk Tenaga Kesehatan. Sumedang: Yayasan Bakti Mulia.
[19] Siregar, Syofian. 2016. StatistikaDeskriptifuntukPenelitianDilengkapiPerhitungan Manual dan Aplikasi](https://image.slidesharecdn.com/v24802215224-240315055021-277ca38b/85/Implementation-of-SEM-Partial-Least-Square-in-Analyzing-the-UTAUT-Model-9-320.jpg)
![American Journal of Humanities and Social Sciences Research (AJHSSR) 2024
A J H S S R J o u r n a l P a g e | 224
SPSS Versi 17. Jakarta: PT Raja GrafindoPersada.
[20] Sugiyono. (2014). Metode Penelitian Pendidikan PendekatanKuantitatif, Kualitatif, dan R&D. Bandung:
Alfabeta.
[21] Sugiyono. (2018). Metode PenelitianKombinasi (Mixed Methods). Bandung: CV Alfabeta.
[22] Sugiyono. (2018). Metode PenelitianKuantitatif. Bandung: Alfabeta.
[23] Swarjana, K. (2022). Populasi-Sampel Teknik Sampling dan Bias Dalam Penelitian. Yogyakarta: Andi.
[24] Venkatesh, V Moris, M.G., Davis, G.B., and Davis F.D., 2003, “User Acceptance of Information
Technology: Toward a Unified View,” MIS Quarterly, Vol.27, No.3, September, pp.425-475.
[25] Yamin, S. (2022). Olah Data StatistikSmartPLS 3 SmartPLS4 AMOS STATA (EdisiKedua). Penerbit
DewanggaEnergiInternasional.](https://image.slidesharecdn.com/v24802215224-240315055021-277ca38b/85/Implementation-of-SEM-Partial-Least-Square-in-Analyzing-the-UTAUT-Model-10-320.jpg)

This research paper investigates the application of Partial Least Squares Structural Equation Modeling (PLS-SEM) to analyze the Unified Theory of Acceptance and Use of Technology (UTAUT) model in the context of payment technology adoption. Employing a quantitative methodology involving a sample of 50 participants, findings indicate significant relationships among constructs within the UTAUT framework, providing insights into factors influencing payment technology acceptance. The study demonstrates the effectiveness of PLS-SEM in modeling complex relationships and the utility of Smart PLS software for analysis.


