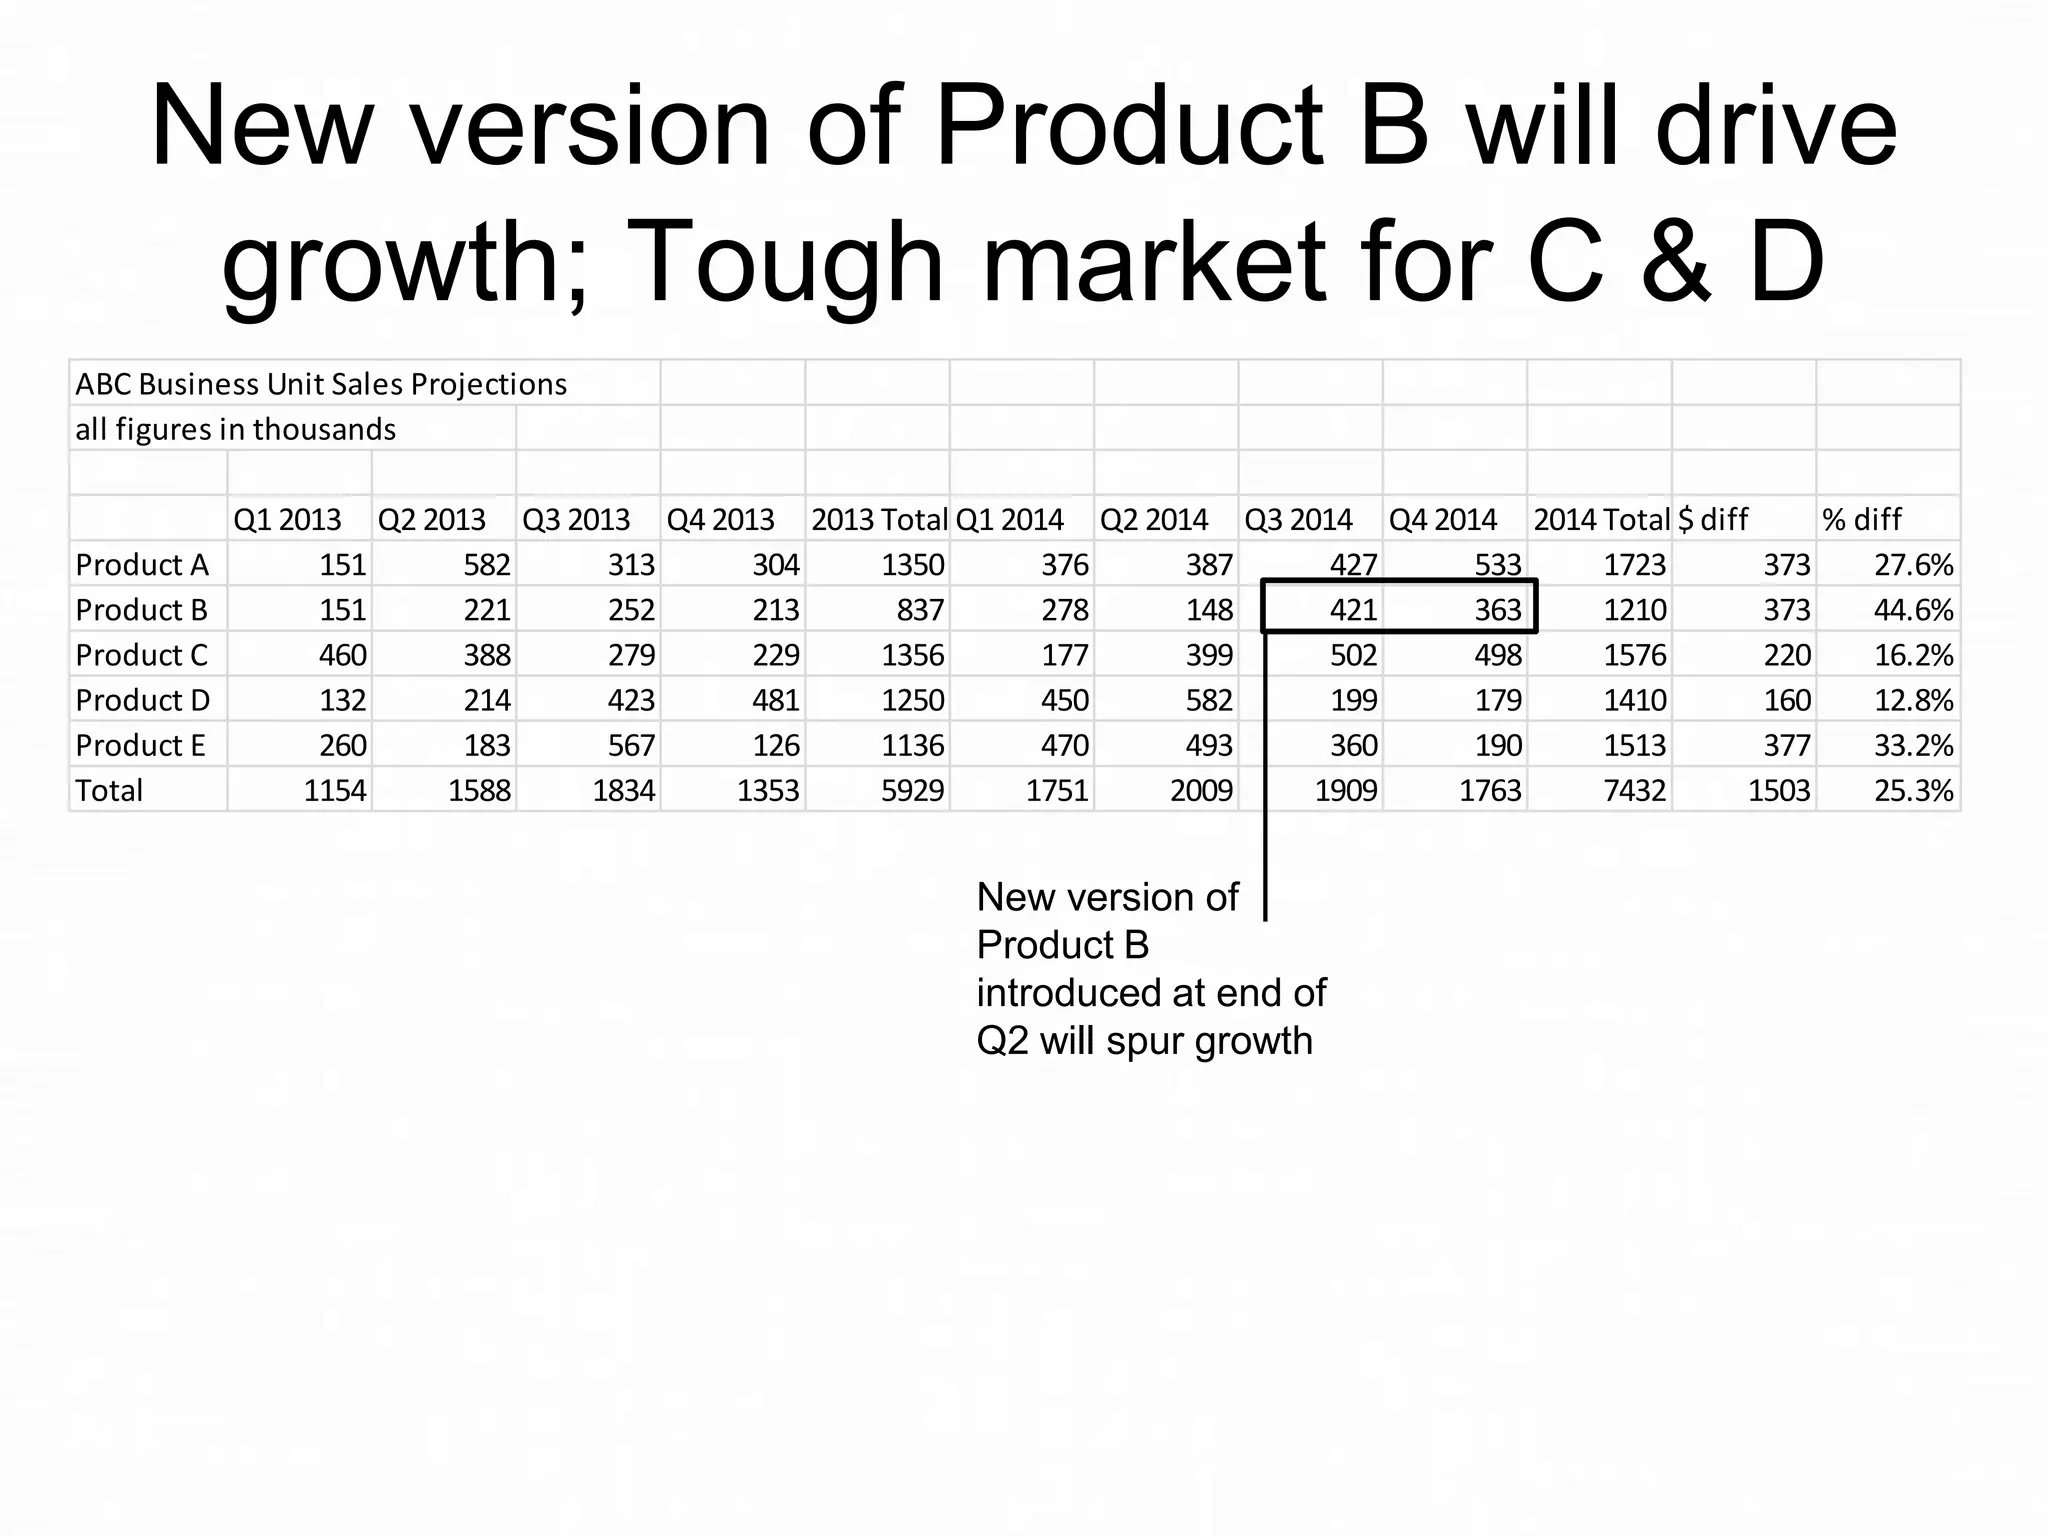
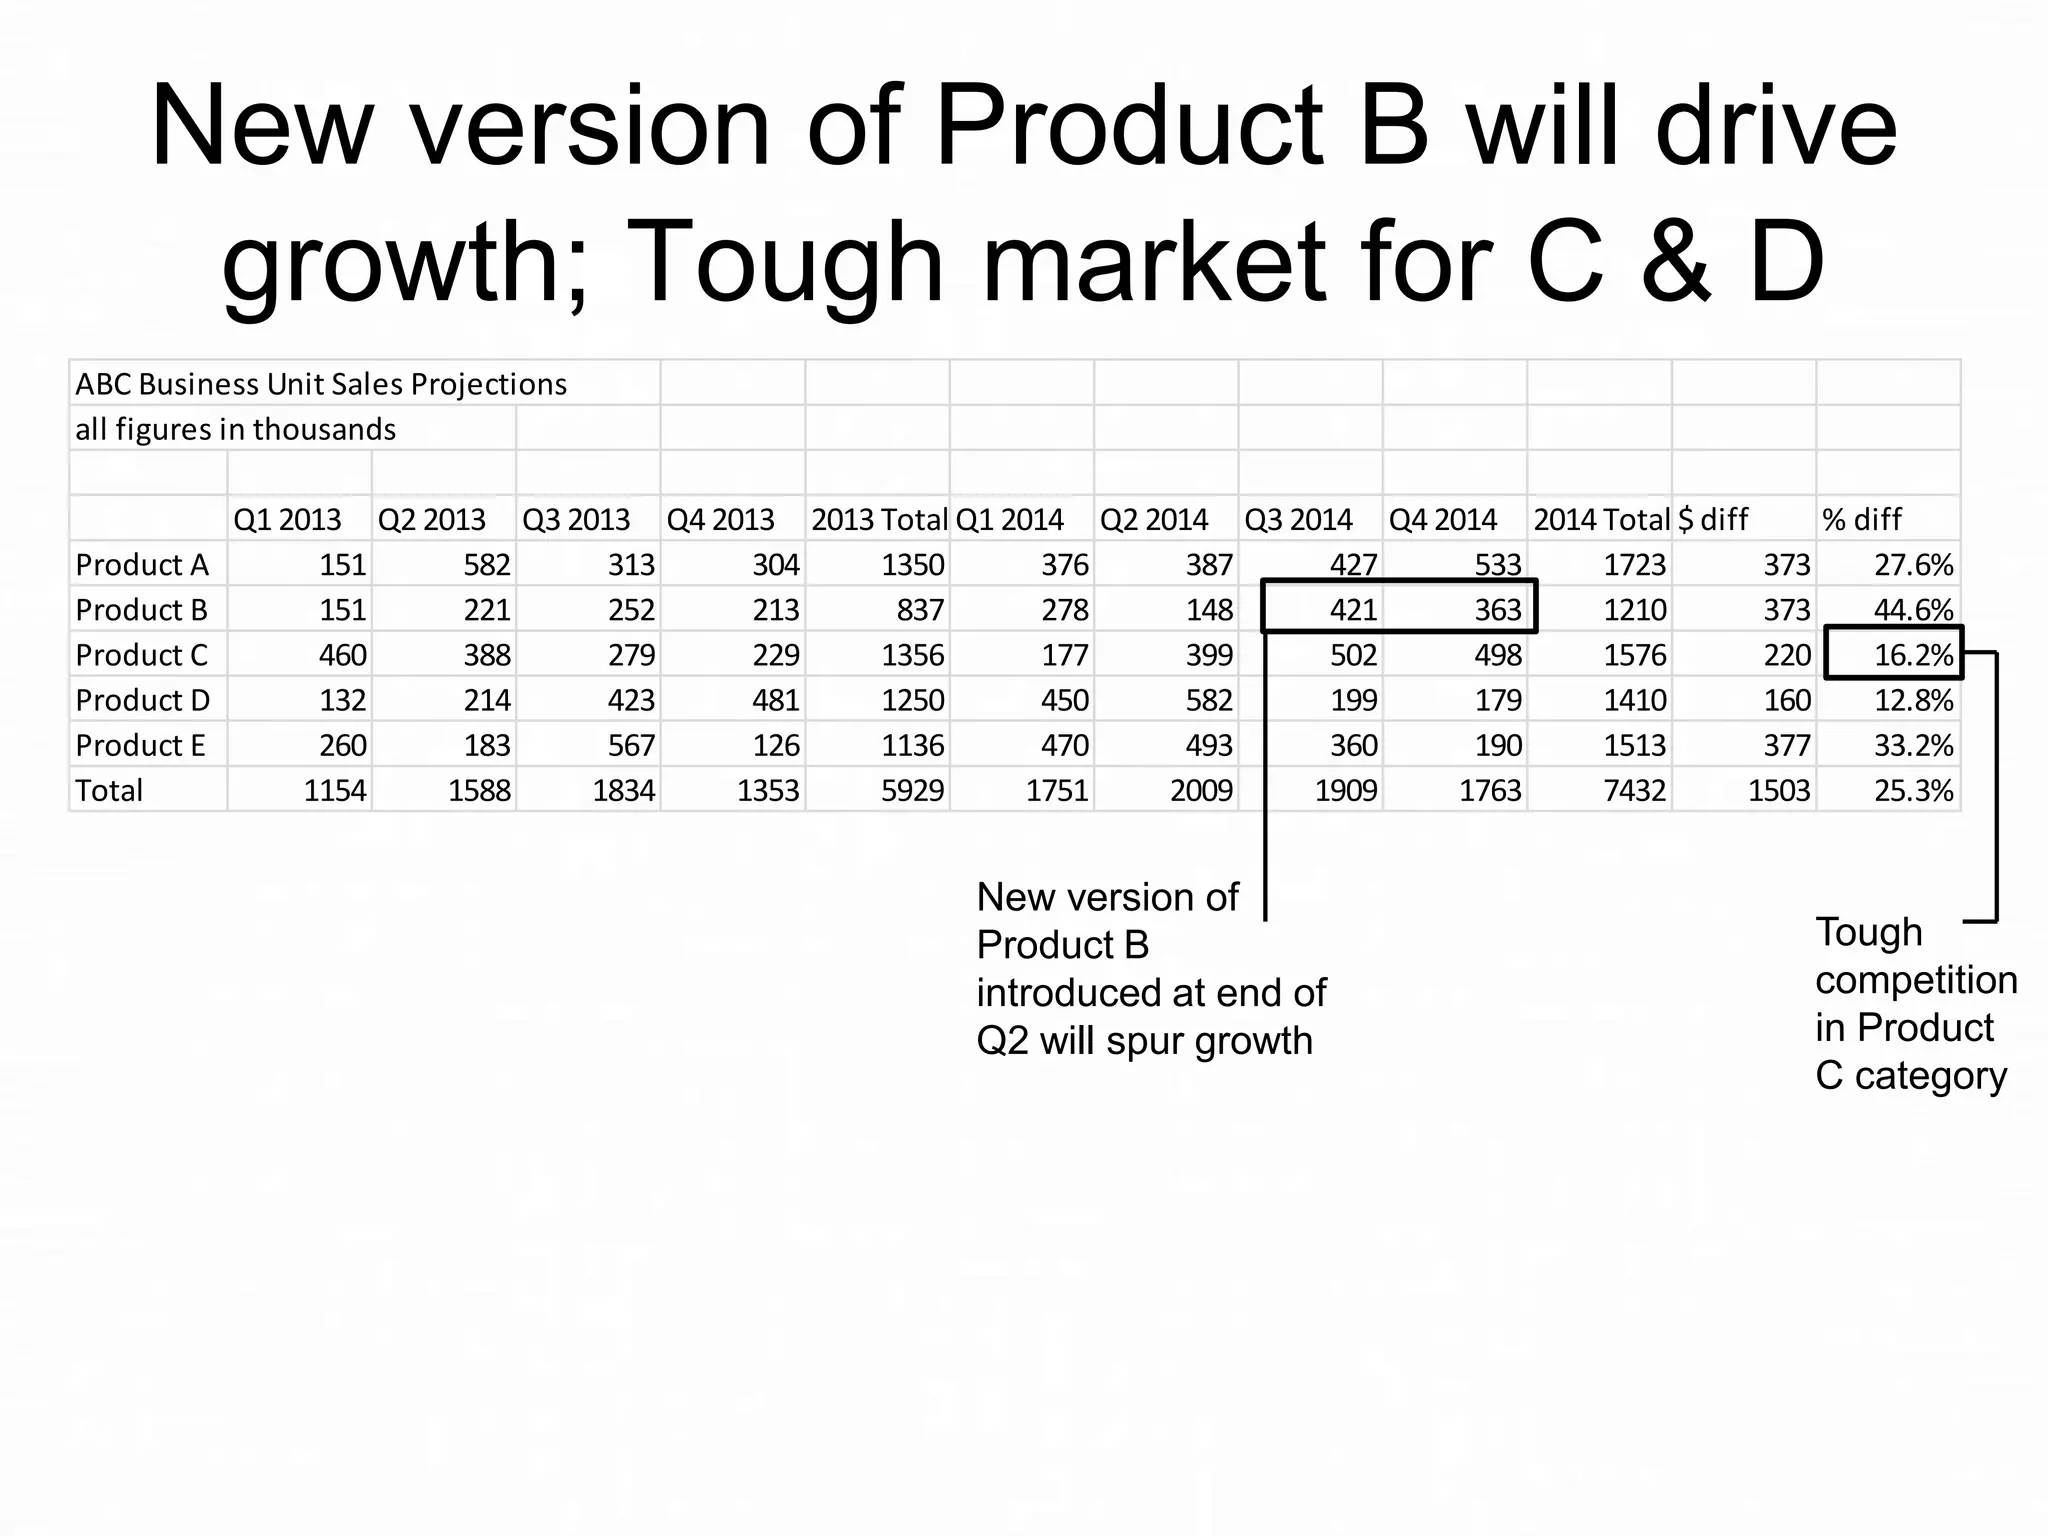
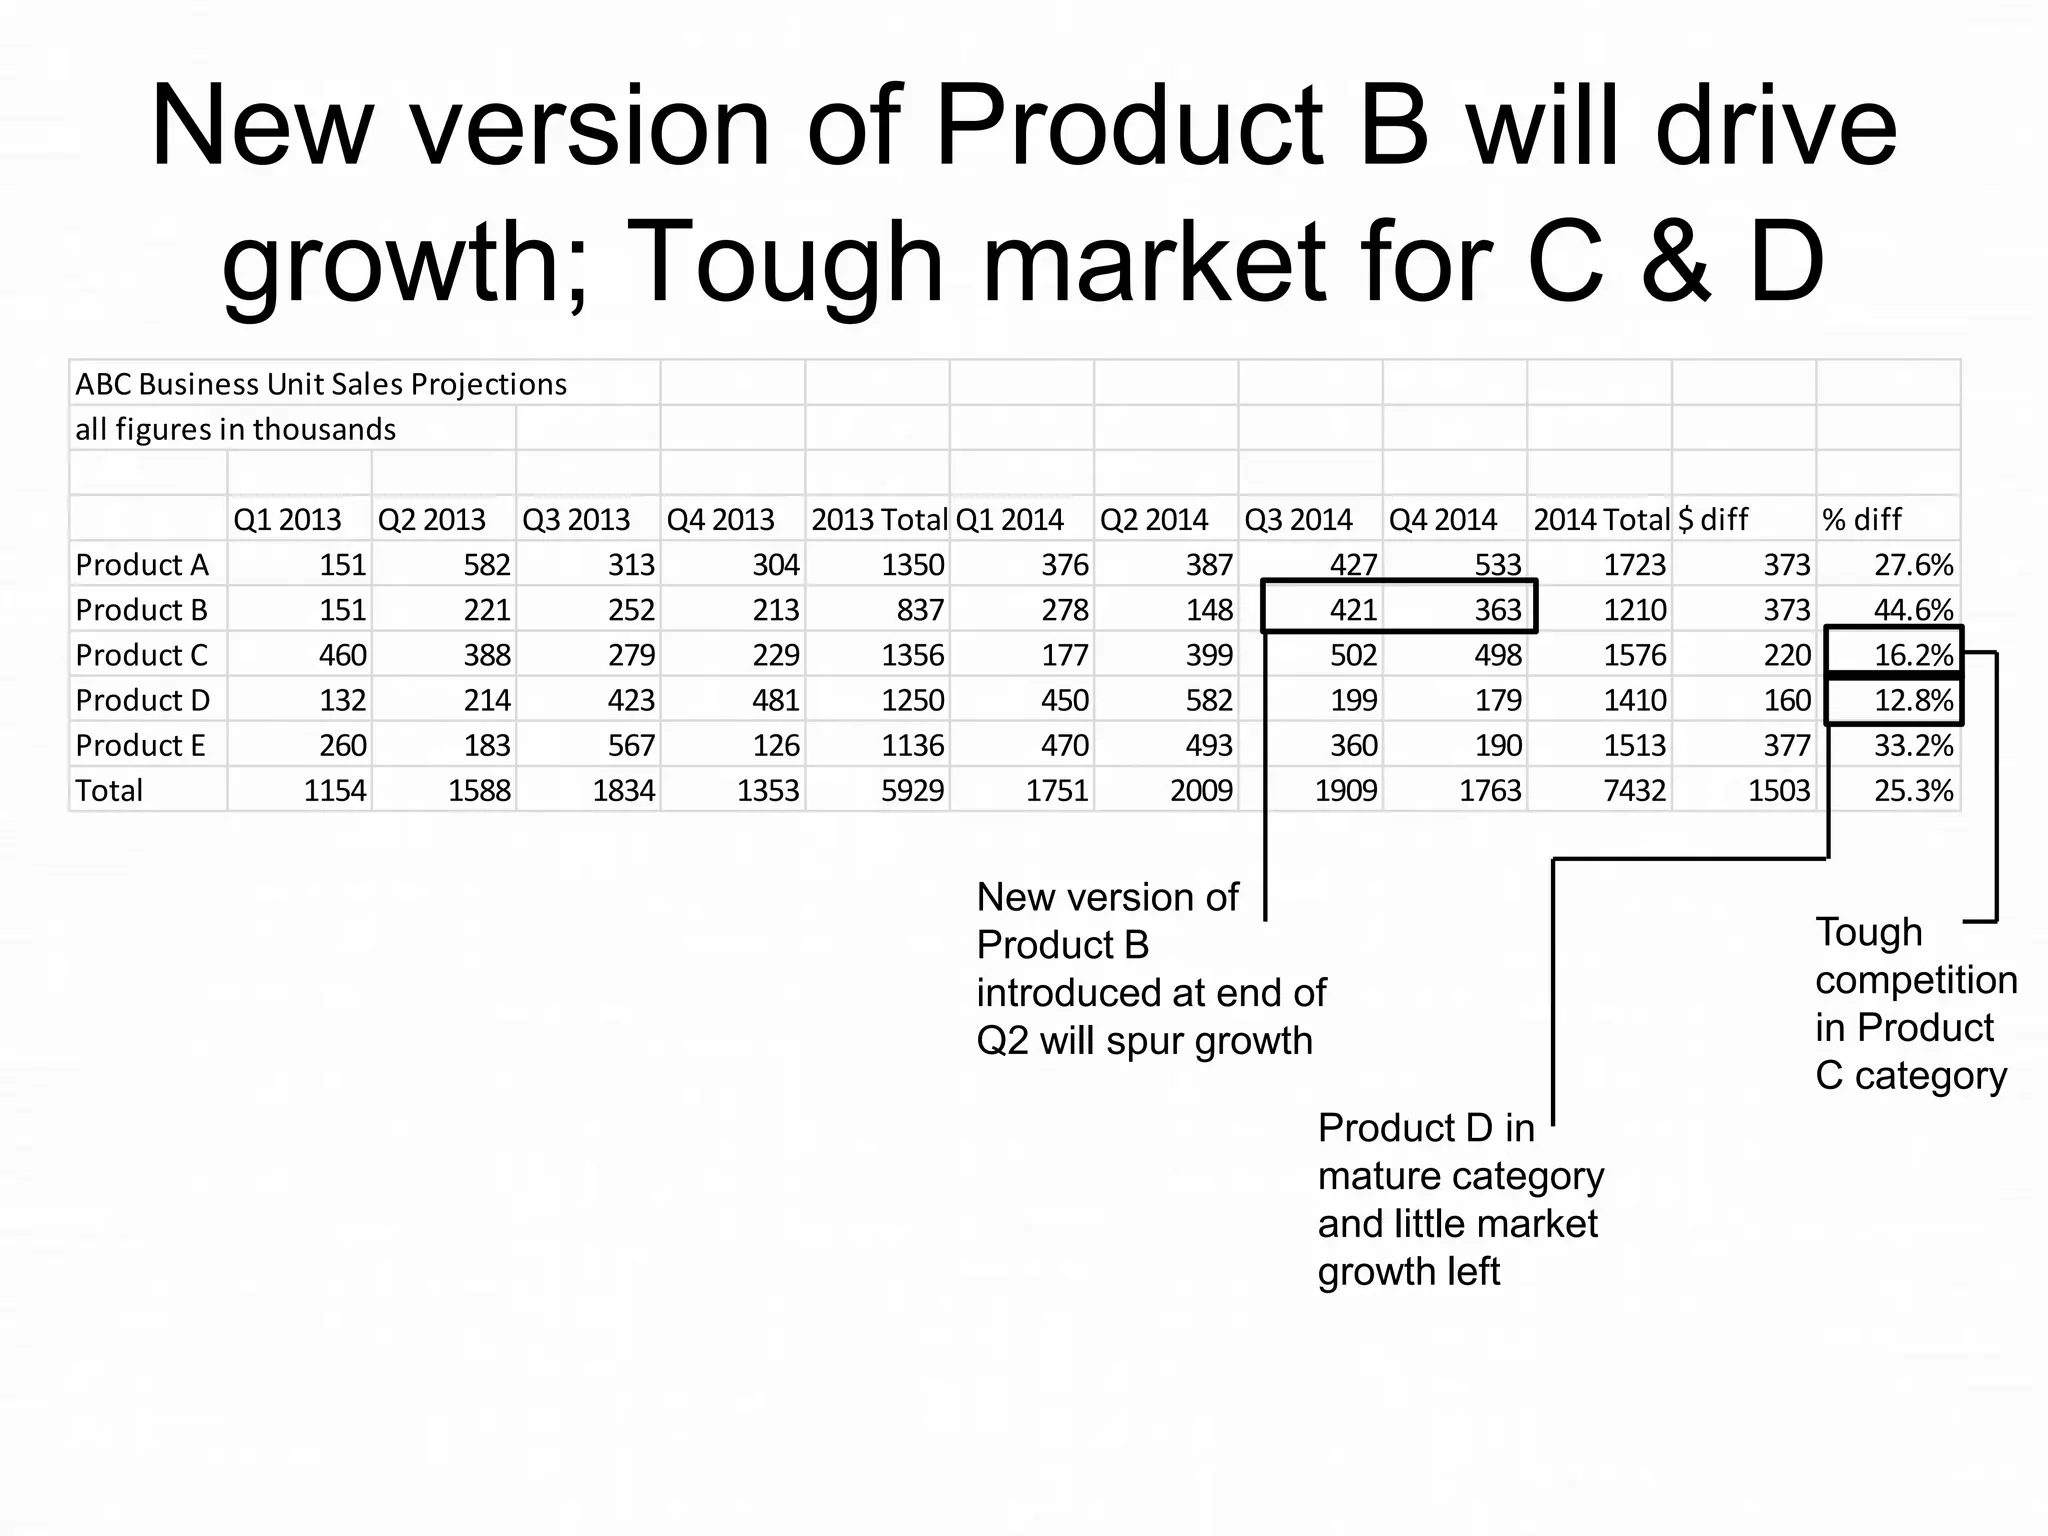
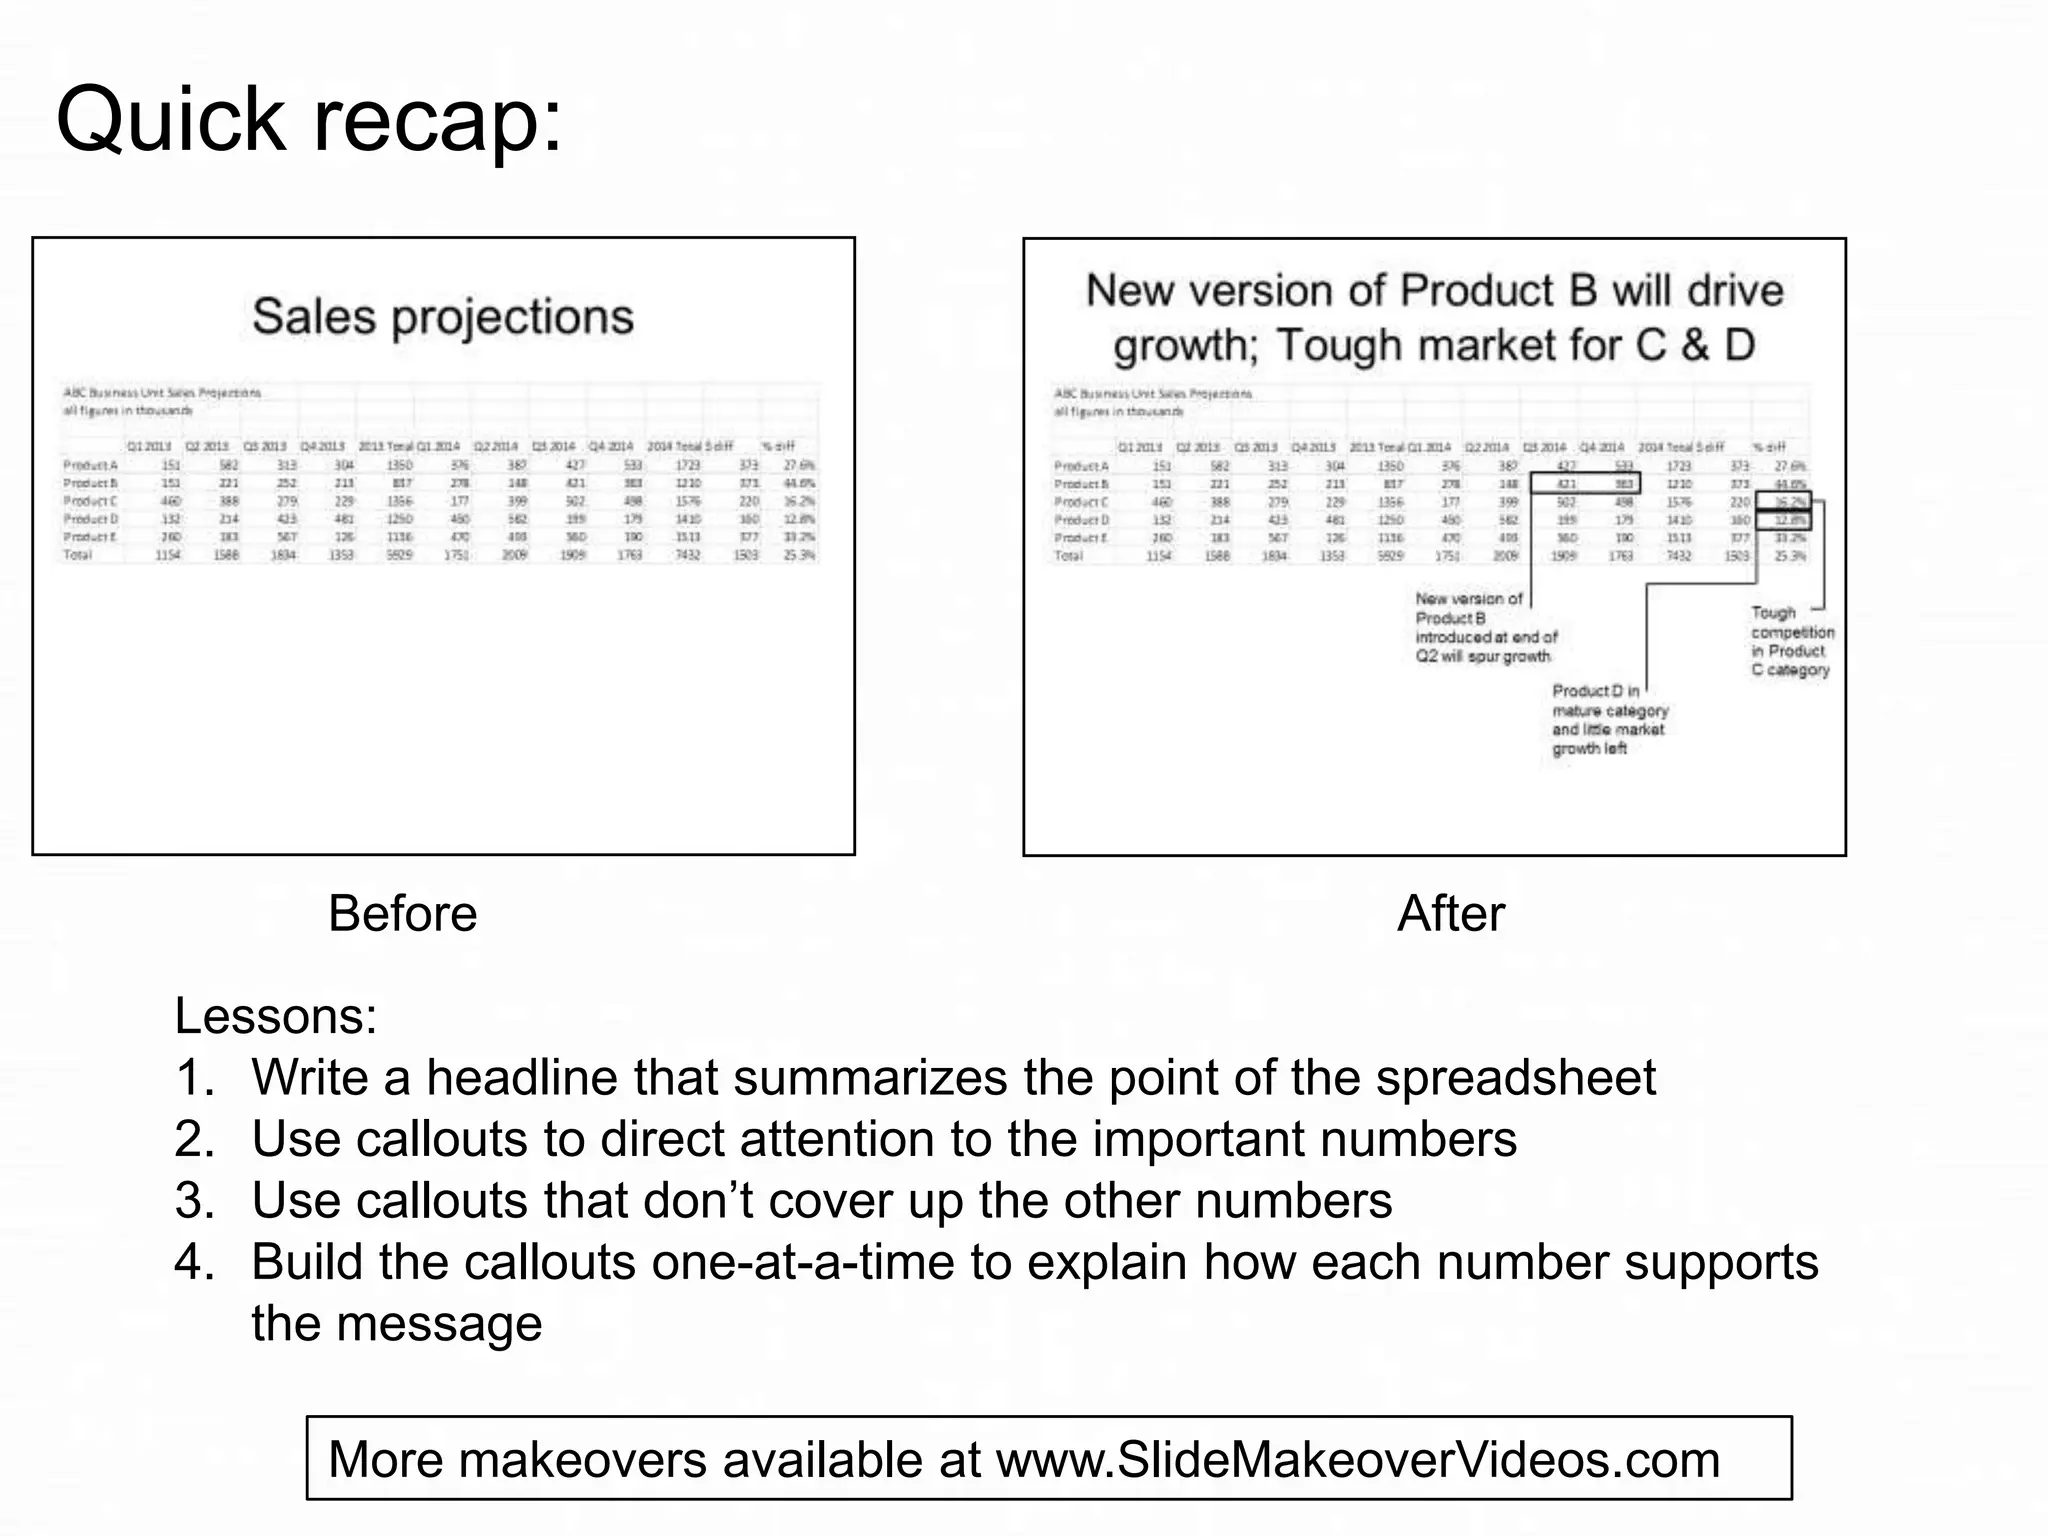
Slide Makeover
Video Podcast #77:
When you are forced to show a
large spreadsheet
Based on the ideas in
“Present It So They Get It”
by Dave Paradi
www.PresentItSoTheyGetIt.com
In my recent survey, audiences
shared how annoyed they are
when the presenters copies a large
spreadsheet onto a slide.

Like this slide …
Sales projections
ABC Business Unit Sales Projections
all figures in thousands

Product A
Product B
Product C
Product D
Product E
Total

Q1 2013 Q2 2013 Q3 2013 Q4 2013 2013 Total Q1 2014 Q2 2014 Q3 2014 Q4 2014 2014 Total $ diff
% diff
151
582
313
304
1350
376
387
427
533
1723
373
27.6%
151
221
252
213
837
278
148
421
363
1210
373
44.6%
460
388
279
229
1356
177
399
502
498
1576
220
16.2%
132
214
423
481
1250
450
582
199
179
1410
160
12.8%
260
183
567
126
1136
470
493
360
190
1513
377
33.2%
1154
1588
1834
1353
5929
1751
2009
1909
1763
7432
1503
25.3%
I recently did a slide makeover of a
slide similar to the one you just
saw. I created a summary table of
the percentage change year to
year, included green arrows to
indicate growth, and showed it to
the client.
They rejected it.
Why?
Because the boss has mandated
that they show the whole
spreadsheet on the slide.
When it comes to choosing
between keeping your job or
creating the best slide possible, I
will always tell you to keep your
job. Even if that means putting a
large spreadsheet on a slide.
What can you do to make that
spreadsheet more meaningful?

Make the message of the
spreadsheet clear, and focus the
audience on the key numbers.
Here is what I suggested to them…
New version of Product B will drive
growth; Tough market for C & D
ABC Business Unit Sales Projections
all figures in thousands

Product A
Product B
Product C
Product D
Product E
Total

Q1 2013 Q2 2013 Q3 2013 Q4 2013 2013 Total Q1 2014 Q2 2014 Q3 2014 Q4 2014 2014 Total $ diff
% diff
151
582
313
304
1350
376
387
427
533
1723
373
27.6%
151
221
252
213
837
278
148
421
363
1210
373
44.6%
460
388
279
229
1356
177
399
502
498
1576
220
16.2%
132
214
423
481
1250
450
582
199
179
1410
160
12.8%
260
183
567
126
1136
470
493
360
190
1513
377
33.2%
1154
1588
1834
1353
5929
1751
2009
1909
1763
7432
1503
25.3%

New version of
Product B
introduced at end of
Q2 will spur growth

Tough
competition
in Product
C category
New version of Product B will drive
growth; Tough market for C & D
ABC Business Unit Sales Projections
all figures in thousands

Product A
Product B
Product C
Product D
Product E
Total

Q1 2013 Q2 2013 Q3 2013 Q4 2013 2013 Total Q1 2014 Q2 2014 Q3 2014 Q4 2014 2014 Total $ diff
% diff
151
582
313
304
1350
376
387
427
533
1723
373
27.6%
151
221
252
213
837
278
148
421
363
1210
373
44.6%
460
388
279
229
1356
177
399
502
498
1576
220
16.2%
132
214
423
481
1250
450
582
199
179
1410
160
12.8%
260
183
567
126
1136
470
493
360
190
1513
377
33.2%
1154
1588
1834
1353
5929
1751
2009
1909
1763
7432
1503
25.3%

New version of
Product B
introduced at end of
Q2 will spur growth
Product D in
mature category
and little market
growth left

Tough
competition
in Product
C category
By using a headline that
summarizes the key message and
callouts that directed the audience
to the numbers that supported that
message, the large spreadsheet
becomes easier to understand.
What lessons can we learn about
making a large spreadsheet make
sense on a slide?
Lesson #1:
Write a headline that summarizes
the key message (so they don’t
have to try to figure it out from the
“wall of numbers”).
Lesson #2:
Use callouts to direct attention to
the numbers that support the
message.
Lesson #3:
Use callouts that do not cover up
the other numbers in the
spreadsheet (a box around the
number and a line leading to the
area outside the spreadsheet can
work well).
Lesson #4:
Explain each callout one-at-a-time
so the audience understands how
each highlighted number supports
the message.
Quick recap:

Before

After

Lessons:
1. Write a headline that summarizes the point of the spreadsheet
2. Use callouts to direct attention to the important numbers
3. Use callouts that don’t cover up the other numbers
4. Build the callouts one-at-a-time to explain how each number supports
the message
More makeovers available at www.SlideMakeoverVideos.com
If you would like me to help
your team create more
effective presentations, get
in touch:

P: 905-510-4911
E: Dave@ThinkOutsideTheSlide.com
W: www.ThinkOutsideTheSlide.com

Slide Makeover #77: When you are forced to show a large spreadsheet

  • 1.
    Slide Makeover Video Podcast#77: When you are forced to show a large spreadsheet Based on the ideas in “Present It So They Get It” by Dave Paradi www.PresentItSoTheyGetIt.com
  • 2.
    In my recentsurvey, audiences shared how annoyed they are when the presenters copies a large spreadsheet onto a slide. Like this slide …
  • 3.
    Sales projections ABC BusinessUnit Sales Projections all figures in thousands Product A Product B Product C Product D Product E Total Q1 2013 Q2 2013 Q3 2013 Q4 2013 2013 Total Q1 2014 Q2 2014 Q3 2014 Q4 2014 2014 Total $ diff % diff 151 582 313 304 1350 376 387 427 533 1723 373 27.6% 151 221 252 213 837 278 148 421 363 1210 373 44.6% 460 388 279 229 1356 177 399 502 498 1576 220 16.2% 132 214 423 481 1250 450 582 199 179 1410 160 12.8% 260 183 567 126 1136 470 493 360 190 1513 377 33.2% 1154 1588 1834 1353 5929 1751 2009 1909 1763 7432 1503 25.3%
  • 4.
    I recently dida slide makeover of a slide similar to the one you just saw. I created a summary table of the percentage change year to year, included green arrows to indicate growth, and showed it to the client. They rejected it.
  • 5.
    Why? Because the bosshas mandated that they show the whole spreadsheet on the slide.
  • 6.
    When it comesto choosing between keeping your job or creating the best slide possible, I will always tell you to keep your job. Even if that means putting a large spreadsheet on a slide.
  • 7.
    What can youdo to make that spreadsheet more meaningful? Make the message of the spreadsheet clear, and focus the audience on the key numbers. Here is what I suggested to them…
  • 8.
    New version ofProduct B will drive growth; Tough market for C & D ABC Business Unit Sales Projections all figures in thousands Product A Product B Product C Product D Product E Total Q1 2013 Q2 2013 Q3 2013 Q4 2013 2013 Total Q1 2014 Q2 2014 Q3 2014 Q4 2014 2014 Total $ diff % diff 151 582 313 304 1350 376 387 427 533 1723 373 27.6% 151 221 252 213 837 278 148 421 363 1210 373 44.6% 460 388 279 229 1356 177 399 502 498 1576 220 16.2% 132 214 423 481 1250 450 582 199 179 1410 160 12.8% 260 183 567 126 1136 470 493 360 190 1513 377 33.2% 1154 1588 1834 1353 5929 1751 2009 1909 1763 7432 1503 25.3% New version of Product B introduced at end of Q2 will spur growth
  • 9.
    New version ofProduct B will drive growth; Tough market for C & D ABC Business Unit Sales Projections all figures in thousands Product A Product B Product C Product D Product E Total Q1 2013 Q2 2013 Q3 2013 Q4 2013 2013 Total Q1 2014 Q2 2014 Q3 2014 Q4 2014 2014 Total $ diff % diff 151 582 313 304 1350 376 387 427 533 1723 373 27.6% 151 221 252 213 837 278 148 421 363 1210 373 44.6% 460 388 279 229 1356 177 399 502 498 1576 220 16.2% 132 214 423 481 1250 450 582 199 179 1410 160 12.8% 260 183 567 126 1136 470 493 360 190 1513 377 33.2% 1154 1588 1834 1353 5929 1751 2009 1909 1763 7432 1503 25.3% New version of Product B introduced at end of Q2 will spur growth Tough competition in Product C category
  • 10.
    New version ofProduct B will drive growth; Tough market for C & D ABC Business Unit Sales Projections all figures in thousands Product A Product B Product C Product D Product E Total Q1 2013 Q2 2013 Q3 2013 Q4 2013 2013 Total Q1 2014 Q2 2014 Q3 2014 Q4 2014 2014 Total $ diff % diff 151 582 313 304 1350 376 387 427 533 1723 373 27.6% 151 221 252 213 837 278 148 421 363 1210 373 44.6% 460 388 279 229 1356 177 399 502 498 1576 220 16.2% 132 214 423 481 1250 450 582 199 179 1410 160 12.8% 260 183 567 126 1136 470 493 360 190 1513 377 33.2% 1154 1588 1834 1353 5929 1751 2009 1909 1763 7432 1503 25.3% New version of Product B introduced at end of Q2 will spur growth Product D in mature category and little market growth left Tough competition in Product C category
  • 11.
    By using aheadline that summarizes the key message and callouts that directed the audience to the numbers that supported that message, the large spreadsheet becomes easier to understand.
  • 12.
    What lessons canwe learn about making a large spreadsheet make sense on a slide?
  • 13.
    Lesson #1: Write aheadline that summarizes the key message (so they don’t have to try to figure it out from the “wall of numbers”).
  • 14.
    Lesson #2: Use calloutsto direct attention to the numbers that support the message.
  • 15.
    Lesson #3: Use calloutsthat do not cover up the other numbers in the spreadsheet (a box around the number and a line leading to the area outside the spreadsheet can work well).
  • 16.
    Lesson #4: Explain eachcallout one-at-a-time so the audience understands how each highlighted number supports the message.
  • 17.
    Quick recap: Before After Lessons: 1. Writea headline that summarizes the point of the spreadsheet 2. Use callouts to direct attention to the important numbers 3. Use callouts that don’t cover up the other numbers 4. Build the callouts one-at-a-time to explain how each number supports the message More makeovers available at www.SlideMakeoverVideos.com
  • 18.
    If you wouldlike me to help your team create more effective presentations, get in touch: P: 905-510-4911 E: Dave@ThinkOutsideTheSlide.com W: www.ThinkOutsideTheSlide.com