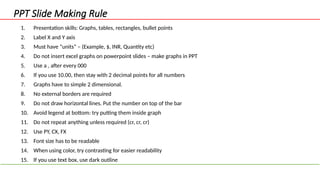
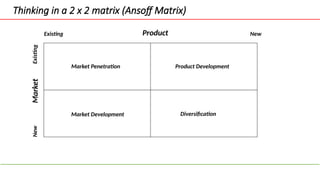
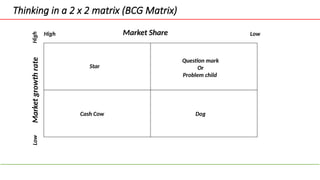
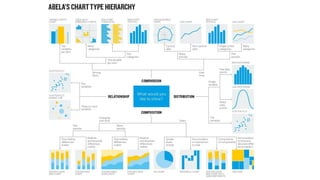
Strategy & Management Consulting 101
Powerpoint Skills
Importance
Your slide making skills and presentation (PPT or
Canva) will play a major role in your career growth.
https://www.coursera.org/videos/presentations-speaking-so-that-people-listen/HgGEC
Powerpoint Skills
PPT Slide Making Rule
1. Presentation skills: Graphs, tables, rectangles, bullet points
2. Label X and Y axis
3. Must have “units” – (Example, $, INR, Quantity etc)
4. Do not insert excel graphs on powerpoint slides – make graphs in PPT
5. Use a , after every 000
6. If you use 10.00, then stay with 2 decimal points for all numbers
7. Graphs have to simple 2 dimensional.
8. No external borders are required
9. Do not draw horizontal lines. Put the number on top of the bar
10. Avoid legend at bottom: try putting them inside graph
11. Do not repeat anything unless required (cr, cr, cr)
12. Use PY, CX, FX
13. Font size has to be readable
14. When using color, try contrasting for easier readability
15. If you use text box, use dark outline
Template (Calibri Light Bold Italic 32)
• Calibri 20
• Calibri 18
Slide compartments
1 2
3 4
Key takeaway
Write your important takeaways from the slide
Tracker
1 2 3 4 5 6 7 8 9 10
1 2 3 4 5 6 7 8 9 10
1 2 3 4 5 6 7 8 9 10
1 2 3 4 5 6 7 8 9 10
1 2 3 4 5 6 7 8 9 10
1 2 3 4 5 6 7 8 9 10
Thinking in a 2 x 2 matrix
Variable 1
Variable 2
Thinking in a 2 x 2 matrix (Ansoff Matrix)
Product
Market Existing New
New
Existing
Market Penetration Product Development
Market Development Diversification
Thinking in a 2 x 2 matrix (BCG Matrix)
Market Share
Market
growth
rate High Low
Low
High
Star
Question mark
Or
Problem child
Cash Cow Dog
MUST remember
1. Graphs
2. Tables
3. Rectangular boxes to show MECE or Issue Tree
4. Bullet points (Short)
Ranking of how you make slides
Excel sheet

Session 4 - Powerpoint & Mekko learning to make ppt.pptx

  • 1.
    Strategy & ManagementConsulting 101 Powerpoint Skills
  • 2.
    Importance Your slide makingskills and presentation (PPT or Canva) will play a major role in your career growth.
  • 3.
  • 4.
    PPT Slide MakingRule 1. Presentation skills: Graphs, tables, rectangles, bullet points 2. Label X and Y axis 3. Must have “units” – (Example, $, INR, Quantity etc) 4. Do not insert excel graphs on powerpoint slides – make graphs in PPT 5. Use a , after every 000 6. If you use 10.00, then stay with 2 decimal points for all numbers 7. Graphs have to simple 2 dimensional. 8. No external borders are required 9. Do not draw horizontal lines. Put the number on top of the bar 10. Avoid legend at bottom: try putting them inside graph 11. Do not repeat anything unless required (cr, cr, cr) 12. Use PY, CX, FX 13. Font size has to be readable 14. When using color, try contrasting for easier readability 15. If you use text box, use dark outline
  • 5.
    Template (Calibri LightBold Italic 32) • Calibri 20 • Calibri 18
  • 6.
  • 7.
    Key takeaway Write yourimportant takeaways from the slide
  • 8.
    Tracker 1 2 34 5 6 7 8 9 10 1 2 3 4 5 6 7 8 9 10 1 2 3 4 5 6 7 8 9 10 1 2 3 4 5 6 7 8 9 10 1 2 3 4 5 6 7 8 9 10 1 2 3 4 5 6 7 8 9 10
  • 9.
    Thinking in a2 x 2 matrix Variable 1 Variable 2
  • 10.
    Thinking in a2 x 2 matrix (Ansoff Matrix) Product Market Existing New New Existing Market Penetration Product Development Market Development Diversification
  • 11.
    Thinking in a2 x 2 matrix (BCG Matrix) Market Share Market growth rate High Low Low High Star Question mark Or Problem child Cash Cow Dog
  • 12.
    MUST remember 1. Graphs 2.Tables 3. Rectangular boxes to show MECE or Issue Tree 4. Bullet points (Short) Ranking of how you make slides
  • 31.