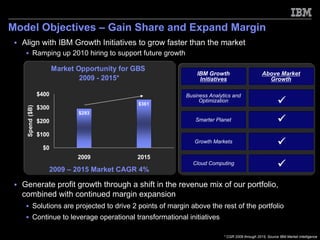
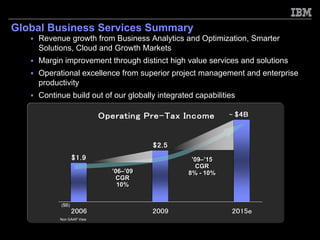
1) IBM's Global Business Services division aims to grow revenue faster than the market through business analytics, smarter solutions, cloud computing, and growth markets.
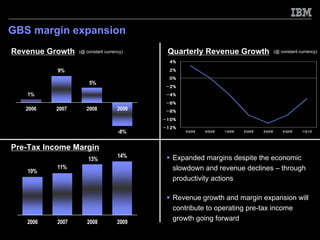
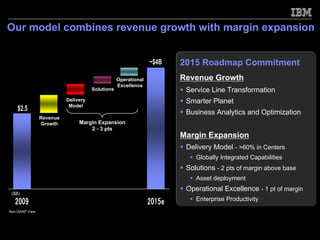
2) GBS will expand margins through shifting to higher value services and solutions, leveraging operational transformation initiatives, and improving delivery model efficiency.
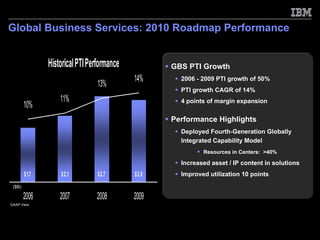
3) From 2009 to 2015, GBS forecasts compound annual growth rates of 8-10% in operating pre-tax income and revenue, reaching $4 billion and continued profit expansion through these strategies.