Downloaded 12 times


![NOTES TO CONSOLIDATED FINANCIAL STATEMENTS
In 2006, GE Capital Solutions made available term loan facilities of up to $28,000 USD, consisting of a Capex/Acquisition loan facility of up to $10,000, and
a Debenture Retirement loan facility of up to $18,000. On May 15, 2007, the Company borrowed $10,000 USD against these facilities for the acquisition of
land, building, and production equipment in El Segundo, California. On May 7, 2008, and July 7, 2008, the Company borrowed an additional $14,000 USD
and $4,000 USD respectively, against these facilities for the acquisition of certain assets of ETI-PMD. The interest rate applicable to both facilities is the
LIBOR rate plus a rate that varies between 2.25% and 3.60%.
The collateral for these arrangements includes a general security agreement on the capital assets of the Company as well as assignment of insurance policies.
The GE Capital Solutions loans are being amortized over 5 years with quarterly payments of principal and interest of $4,302 ($4,270 USD) in 2008
($643 [$606 USD] in 2007). Interest paid on the GE Capital Solutions loan in the year was $1,036 ($1,030 USD) and $202 ($190 USD) in 2007.
The Company has a product development agreement with Technology Partnerships Canada (TPC) that provides partial funding for certain research and
development projects. Royalties of 4.9% are to be paid on annual gross product revenues resulting from the project to March 1, 2013. If total royalties paid by
March 1, 2013 are equal to or exceed $3,263, the payment obligation will be terminated. If total royalties paid at that date are less than $3,263, the payment
obligation shall continue until March 1, 2016 or until $3,263 is paid, whichever comes first. A royalty payment of $17 was made in 2008 ($12 in 2007). It is
not possible to determine the timing of the ultimate amount that will be repaid in connection with this arrangement and accordingly, no amount is accrued.
The Government of Canada loan in conjunction with TPC is without interest or specific security with payments due annually until March 2013. The carrying
value of the Government of Canada loan of $518, included in loans payable as at November 1, 2006, was adjusted through the opening deficit to a carrying
value of $405 using a discount rate of 6% (Note 1). During 2008 and 2007, installment payments totaling $74, net of the effective interest, were made,
reducing the carrying value to $310 as at October 31, 2008 ($358 in 2007).
10. FINANCIAL INSTRUMENTS – RISk MANAGEMENT OBJECTIVES AND POLICIES
For the Company’s cash and cash equivalents, accounts receivables, accounts payable and accrued liabilities and discontinued operations liabilities, the fair
values approximate their respective carrying amounts due to their short maturities. The fair values of foreign currency call and put option contracts have been
estimated using market quoted rates of foreign currencies. The Government of Canada loan, included in loans payable, has a fair value at October 31, 2008
of $312 ($358 in 2007) that approximates the carrying value of $310. The fair value of the Government of Canada loan is calculated using discounted cash
flows with a discount rate comprised of the Bank of Canada prime rate plus 2% which is indicative of the Company’s borrowing rate. The fair value of the
GE Capital loans, included in loans payable, approximates the carrying value due to their variable interest rate terms policy.
Foreign Currency Risk
Transaction Exposure
The Company is exposed to foreign exchange risk as a result of transactions in currencies other than its functional currency, the Canadian dollar. The majority
of the Company’s revenues are transacted in U.S. dollars. Portions of the revenues are denominated in Canadian dollars, British pounds, and Euros.
Purchases of raw materials, and other expenses, consisting primarily of the majority of salaries, certain operating costs and manufacturing overhead, are
incurred primarily in Canadian dollars. The Company utilizes foreign exchange put options and related call options contracts to hedge the net cash flow risk
associated with forecasted transactions in foreign currencies but does not enter into derivatives for speculative purposes. The Company does not designate
or measure the effectiveness of the derivative instruments as hedges or specific firm commitments or forecasted transactions and accordingly, does not
meet the requirements of CICA Handbook Section 3865, Hedges. The Company generally uses foreign exchange put options and related call options to
manage foreign currency risk related to sales to customers in the United States and United Kingdom. Management policy is to hedge between 75% and
100% of expected U.S. dollar net cash flows.
Translation Exposure
The Company’s foreign operations, CDE and Xian, are considered self-sustaining. Accordingly, assets and liabilities are translated into Canadian dollars
using the exchange rates in effect at the balance sheet dates. Unrealized translation gains and losses are deferred in AOCI. The accumulated currency
translation adjustments are recognized in income when there has been a reduction in the net investment of the self-sustaining foreign operations.
50](https://image.slidesharecdn.com/comdev2008annualreport-090906111249-phpapp01/85/Com-Dev-2008-Annual-Report-52-320.jpg)


![CORPORATE DATA
Directors Officers Investor Relations Contact
Keith Ainsworth John Keating Gary Calhoun
Chairman Chief Executive Officer Tel: (519) 622-2300 Ext. 2826
COM DEV International Ltd. Fax: (519) 622-2158
Cambridge, ON Gary Calhoun gary.calhoun@comdev.ca
Chief Financial Officer
James Adamson Jeff Codispodi
President & CEO Michael Pley The Equicom Group
Monarch Precision, LLC Chief Operating Officer Tel: 416-815-0700 Ext. 261
Fishersville, Virginia, USA Fax: 416-815-0080
Corporate Locations jcodispodi@equicomgroup.com
Kym Anthony Cambridge, Canada
Chairman Ottawa, Canada Website
DFGIA Inc., New York Aylesbury, U.K. www.comdevintl.com
Toronto, ON El Segundo, California, USA
Xi’an, China Year End
John Keating October 31
CEO Head Office
COM DEV International Ltd. Auditors
COM DEV International
Cambridge, ON Ernst & Young LLP
155 Sheldon Drive
Cambridge, ON Kitchener, Ontario, Canada
Christopher O’Donovan
Canada N1R 7H6
Lecturer in Physics Legal Counsel
University of Waterloo Tel: (519) 622-2300
Fax: (519) 622-1691 Gardiner Roberts LLP
Waterloo, ON
Toronto, Ontario, Canada
Terry Reidel Exchange Listing
Toronto Stock Exchange Transfer Agent
Vice Chairman
COM DEV International Ltd. Computershare Investor Services Inc.
Stock Symbol
Kitchener, ON Toronto, Ontario, Canada
CDV
Peter Scovell Annual Meeting Notice
President The Annual Meeting of shareholders
Newlyn Technologies Ltd. will be held at the Holiday Inn
Ottawa, ON Cambridge, 200 Holiday Inn Drive,
Cambridge, Ontario on Wednesday,
Douglas Wright April 22, 2009 at 6:00 p.m.
President Emeritus
University of Waterloo
Waterloo, ON
Photo Credits:
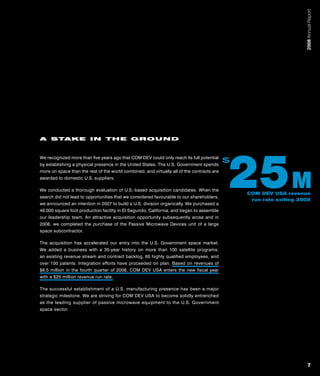
Cover: COM DEV International head office in Cambridge, Ontario, as photographed from the QuickBird satellite.
Page 4: (background) Hubble data: NASA [http://www.nasa.gov], ESA [http://www.spacetelescope.org], and A. Zezas (Harvard-Smithsonian
Center for Astrophysics); GALEX data: NASA [http://www.nasa.gov], JPL-Caltech, GALEX Team, J. Huchra et al. (Harvard-Smithsonian
Center for Astrophysics); Spitzer data: NASA [http://www.nasa.gov]/JPL/Caltech/Harvard-Smithsonian Center for Astrophysics
The triangular logo and the word COM DEV are each registered trademarks and the property of COM DEV Ltd. All rights reserved.
Design & Production by Equicom, a TMX Group Company.](https://image.slidesharecdn.com/comdev2008annualreport-090906111249-phpapp01/85/Com-Dev-2008-Annual-Report-63-320.jpg)


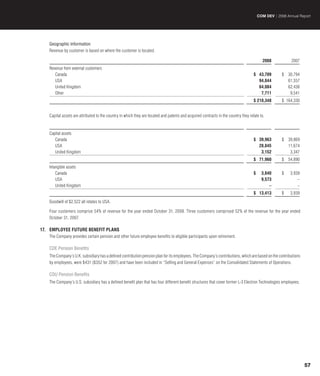
COM DEV International is a space technology company that has been in operation for 35 years with over 1,200 employees across 4 countries. It has earned 238 patents and worked on over 750 satellite contracts. In recent years, the company has focused on its core space business, investing in new technologies and markets. This has led to significant growth, with revenues increasing from $88 million in 2003 to $210 million in 2008, significantly outperforming the industry average. The company has also diversified into new segments like civil and military space. A key part of its strategy was expanding its presence in Canada and the United States, growing its Canadian civil space revenues from $8 million in 2004 to $50 million in 2008 and acquiring a U


![[WEBINAR] Accessing the U.S. Retail Audience: A 'Blue Sky' Opportunity](https://cdn.slidesharecdn.com/ss_thumbnails/2012q3-blueskynoscript-forslideshare-121107095411-phpapp01-thumbnail.jpg?width=640&height=640&fit=bounds)


