This document presents a master's thesis that defines a reconfigurable framework for ECG-based patient monitoring systems using programmable system-on-chip (PSoC) technology. The framework includes a procedure for detecting abnormal ECG signals. As a case study, an ECG monitoring system was implemented on a PSoC chip using the defined framework. Additionally, a custom IP block was developed to provide an implementation base for the ECG detection framework. The results demonstrate that PSoC technology enables fast and flexible development of ECG monitoring systems, and detecting abnormalities close to the patient can reduce data transfer and power consumption.

![1
1 INTRODUCTION
The field of public healthcare around the world is facing new financial and social
challenges, as it needs to provide medical care for increasing number of senior citizens.
In about 40 years’ time, the amount of people in the group older than 65 years is forecasted
to be three times larger than today [1]. Within the near future, for the first time in its
statistical history, this age group is estimated to exceed the age group of children under 5
years old. The reasons for this change are twofold. Firstly, vaccinations and other
successful public health projects throughout the 20th
century led to a drastic decline in
communicable diseases, allowing for younger age groups to avoid premature death.
Secondly, the average life expectancy in the overall population has grown dramatically
and will continue to do so, resulting in a wider age span in the over 65 age group.
Consequently, this change in the age range, together with the improved global control
over communicable diseases, has led to a shift in disease patterns. The non-communicable
diseases and chronical conditions will now cause more deaths and disability than the
communicable diseases. Moreover, the non-communicable diseases such as heart disease,
cancer, and diabetes will not only be the scourge of the average or high-income countries,
but will also be prevalent in lower income countries. Hence, the amount of people
globally suffering hearth disease or other non-communicable diseases will significantly
increase within the coming decades and this will stress the public health care systems
economically and socially worldwide [2].](https://image.slidesharecdn.com/ae85dd04-08fc-4c3b-9c1d-305c86daa3ce-150905063655-lva1-app6891/85/Siirila_Antti_master_thesis_final_june_2015-9-320.jpg)
![2
As the pressure on the field of public healthcare increases, many nations have initiated
projects targeting novel solutions for the healthcare systems [3]. These initiatives along
with the rapid development of information and communication technologies (ICT) has
given birth to a new field of research called eHealth. The eHealth concept combines
medical science focused on development of new applications in healthcare with ICT.
These eHealth applications include, among many others, telemedicine, patients’ data
sharing, and intelligent home care.
Heart diseases, described in medical terms as Cardio Vascular Diseases (CVD), are the
largest group in the family of non-communicable diseases. CVD kills globally more than
17 million people every year, particularly in low and middle income countries [4]. In
2010, the global expenditures resulting from CVD were estimated to be more than 850
billion dollars and this trend is continuing.
Early diagnosis of a latent heart problem is the key to the successful treatment in any
abnormalities in the heart [5]. The key method for early diagnosis is Electrocardiography
(ECG). It captures the heart’s electrical activity expressed in waveform. This waveform
provides doctors with visually expressed evidence of a wide variety of heart conditions.
As a consequence, the study of ECG based monitoring systems has been one of the
leading research topics in the eHealth field [6].
1.1 Motivation
Architectural model for a remote ECG monitoring system is generally divided into several
communication domains [6]. Firstly, the ECG signal is collected from sensors placed on
the patient’s body and transferred to a gateway device. Communication between sensors
and gateway is normally made over a short-range wireless connection commonly referred
to as Body Area Network (BAN). The gateway device can be either portable (a
smartphone carried on the patient) or stationary (a dedicated device located near the
patient). Before the gateway device relays the ECG signal to the next communication
domain, it typically performs some de-noising on the signal. The middle ware device at
the border with the next communication domain is typically situated at the patient’s home.
Desktop, laptop, or similar computers are common examples of this middle ware device.
Transfer of the ECG signal from the gateway device to the middle ware device generally
occurs over wireless connection such as Wi-Fi, Bluetooth, or similar. In addition, the](https://image.slidesharecdn.com/ae85dd04-08fc-4c3b-9c1d-305c86daa3ce-150905063655-lva1-app6891/85/Siirila_Antti_master_thesis_final_june_2015-10-320.jpg)
![3
middle ware device provides some signal processing and storage services as well as
further connectivity to a health care centre. Likewise, the middle ware device is capable
of analysing the signal and, based on its analysis it can generate alarms or provide
statistical information to the health care centre. Alternatively, the signal can be relayed
directly to the health care centre for further analysis. The health care centre builds a real-
time view of the patient’s health condition using the data received from the middle ware
device. Based on the built view, the health professionals are then able to take any required
actions concerning the patient’s health. Finally, the physical distance between health care
centre and middle ware can be vast, thus the communication between them typically relies
on internet protocols.
For the gateway device to maintain an adequately long battery life, low power
consumption is crucial. As is commonly known, long battery life is clearly an advantage
to the user, since recharging or battery replacements occur less frequently. For this reason,
in order to reduce computational burden on the gateway device and hence power
consumption, the ECG signal is commonly relayed directly to the middle ware device.
For this reason all signal data, even that containing normal sinus rhythm, is constantly
transferred to the middle ware. However, the communication task is also known to be a
large-scale power consumer which again stresses the battery life of the gateway [6]. On
the other hand, if pre-analysis of the ECG signal in the gateway device already detects
normal sinus rhythm, the communication cost could be reduced. Thus, only the samples
containing data of an abnormal ECG signal would be transferred to the middle ware and
the normal ECG signals could be ignored. For this scenario, the ECG signal analysis
should be robust enough so that misinterpretations could be avoided. Therefore, the rules
for detecting a normal ECG signal should be extremely strict. That is to say, no
compromise can be allowed for the ECG detector. Any suspicious ECG signal, which by
human interpretation could be analysed as normal, would get the status of abnormal in
the machine interpretation. Even in this case, the decline of the communication cost could
be significant. Additionally, statistical data could be extracted from the ECG signal during
normal sinus rhythm. The results could then be sent to the middle ware, if so desired.
A novel Programmable System-on-Chip (PSoC) technology has recently been introduced
which offers a tempting platform for the applications performing Digital Signal
Processing (DSP) or other computationally intensive tasks. It is tempting in the sense that](https://image.slidesharecdn.com/ae85dd04-08fc-4c3b-9c1d-305c86daa3ce-150905063655-lva1-app6891/85/Siirila_Antti_master_thesis_final_june_2015-11-320.jpg)

![6
2 HEART
To be able to build a system that captures, processes, and outputs the electrical activity of
a human heart, it is crucial to understand the very basic biological and physiological
phenomena controlling that activity. This chapter will therefore outline these phenomena.
2.1 Anatomy of the Human Heart
The heart is an autonomously and periodically contracting and relaxing muscle that makes
the blood circulate within the circulatory system. The principal parts of the heart muscle
are the atria and ventricles (Figure 2.1), which can be further divided into the left and
right segments.
2.1.1 Cardiac Cycle
The two main phases of the cardiac cycle are illustrated in Figure 2.1. The phase in which
the blood flows into the heart via the atria, filling the ventricles, is called diastole [7].
systole, respectively, refers to the phase when both ventricles are contracted and the blood
is pumped out from the heart.](https://image.slidesharecdn.com/ae85dd04-08fc-4c3b-9c1d-305c86daa3ce-150905063655-lva1-app6891/85/Siirila_Antti_master_thesis_final_june_2015-14-320.jpg)
![7
Figure 2.1 Human heart in diastole and systole states [8].
2.1.2 Chambers
The heart consist of four isolated chambers, the right and left atrium chambers, and
similarly the right and left ventricle chambers. The chambers in the right side of the heart
are responsible for pumping the deoxygenated blood returning from the circulation to the
lungs to be oxygenated. The left atrium chamber then receives the oxygenated blood from
the lungs and pumps it to the left ventricle chamber which again pumps it back to the
circulation.
2.1.3 Valves
Atria-ventricular blood flow occurs through the atrioventricular valves [7]. The right
Atrioventricular valve is called the Tricuspid valve. This valve allows the blood to flow
from the right atrium to the right ventricle in the diastole phase and blocks the reflux
during the systole. The left Atrioventricular valve is called the Mitral (or Bicuspid) valve
and it has the similar function on the left side as the Tricuspid has on the right side. In
addition, there are two more unidirectional valves. The Semilunar valves, which allow
the blood to run out from the ventricles. The Pulmonary valve (right Semilunar valve)](https://image.slidesharecdn.com/ae85dd04-08fc-4c3b-9c1d-305c86daa3ce-150905063655-lva1-app6891/85/Siirila_Antti_master_thesis_final_june_2015-15-320.jpg)
![8
controls the blood flow from the right ventricle to the lungs. When the ventricle pressure
reaches a certain threshold during the ventricle contraction, the pulmonary valve opens
allowing the blood to run via the Pulmonary Artery to the lungs. Similarly, the Aortic
valve (left Semilunar valve) works in between the left ventricle and Aorta, allowing the
unidirectional bloodstream to flow out from the left ventricle.
2.2 Electrophysiology
Electrical activity in a cell is caused by bidirectional flow of ions, in and out of the cell,
causing changes in electrical potential between the intracellular space and the
extracellular space. The forces that drive the ions to flow are diffusion and electromotive
force. However, those physical phenomena do not solely define the movement of the ions,
which is also highly regulated by various biological processes occurring in a lipid layer
between the cell exterior and the interior called membrane. The equivalent circuit can be
used to model the ionic concentration differences on a miniaturist spot of membrane [9].
2.2.1 ION Current and Membrane
Some elementary ions involved in the electrical activity of an animal cell are: Sodium
(Na+
), Potassium (K+
), Calcium (Ca2+
) as cation, and Chlorine (Cl-
) as anion [10]. Na+
and K+
are the most active when it comes to the ion current across the membrane.
However, Ca2+
has an important role in some cells, such as heart muscle cardio myocytes.
Typically, in an animal cell, there is a higher concentration gradient of K+
inside the
membrane than outside and respectively a higher concentration of Na+
outside the
membrane than inside. The membrane controls the otherwise passively occurring ion
current, caused by diffusion and electrical force, through biological processes such as
voltage gated and resting ion channels, and ion pumps.
2.2.2 Membrane Potentials
Electrical potential difference between the outside and inside of the membrane is
generally called membrane potential, and it can be measured [10]. Different membrane
potentials indicate different functional states of the cell. Typically excitable cells, for
example, the cardio myocytes, have three types of membrane potentials: resting, graded,
and action.](https://image.slidesharecdn.com/ae85dd04-08fc-4c3b-9c1d-305c86daa3ce-150905063655-lva1-app6891/85/Siirila_Antti_master_thesis_final_june_2015-16-320.jpg)
![9
When a cell is in a resting potential, there is none or little ion flow through the membrane,
and therefore the membrane potential stabilizes at a certain level. Commonly, the resting
potential of an excitable cell is around -70mV.
As mentioned earlier, membrane controls the ion flow in and out of the cell. A
mechanical, electrical, or molecular external stimulus affects the permeability of the
membrane, making it permeable only for certain ions [10]. Usually Na+
ions are allowed
to flow in the cell. When more Na+
ions flow in the cell, the Na+
current’s membrane
potential becomes more and more positive. At a certain point when the membrane
potential reaches a threshold level (around -55mV), voltage gated Na+
channels open and
the inward Na+
current increases rapidly causing the cell to depolarize with the membrane
potential becoming positive compared to the exterior of the cell. With the Na+
streaming
into the cell, the membrane potential shoots up seeking the Na+
equilibrium potential.
However, when the membrane voltage reaches the 40mV level at which the voltage gated
K+
channels open in the membrane, the level drops downwards as fast as it had risen, due
to the K+
now streaming out of the cell. The exiting K+
now causes the cell to repolarize
below to the resting potential. This polarization phenomenon, which signals the cell to
perform its job, is called the action potential. For example, in a muscle cell, the
depolarization causes the cell to contract and the repolarization returns the muscle cell
back to relaxation.
Right after the action potential there is a phase called the Refractory period [11], during
which the ion concentration of the cell is restored to the state prior to the action potential
and the membrane potential reverts to the resting potential. During the refractory period,
K+
and Na+
ions are exchanged through the membrane via ion pumps (against their
driving force). This requires work, which again needs energy, provided by ATP within
the cell. The subsequent action potential cannot occurs in a cell until the refractory period
ends.
2.3 Cardio Electrophysiology
Cardio electrophysiology includes the electrophysiological phenomena that occur in the
heart muscle. Although it follows the basic rules of electrophysiology, it consists of
mechanisms that are not expressed in any other part of the human body and hence it will
be discussed in the following paragraphs.](https://image.slidesharecdn.com/ae85dd04-08fc-4c3b-9c1d-305c86daa3ce-150905063655-lva1-app6891/85/Siirila_Antti_master_thesis_final_june_2015-17-320.jpg)
![10
2.3.1 Cardio Myocytes
Heart muscle consists of cardio myocytes that are a specific type of muscle cell existing
only in the heart. Cardio myocyte has the similar contraction and relaxation features as a
skeletal muscle cell initiated by the action potential. However, cardio myocytes are
electrically interconnected with each other and therefore are able to propagate the action
potential throughout the muscle tissue. In addition, a cardio myocyte automatically
adjusts its contraction pace in relation to the adjacent cardio myocyte having the highest
contraction pace. Hence, all cardio myocytes connecting to each other strive towards a
uniform contraction pace [12].
2.3.2 Cardio Conduction System
The systole and diastole phases are controlled by the conduction system [13]. The
conduction system consists of a special type of cardio myocyte that generate, control, and
carry the action potential throughout the heart muscle. The main tissues in the conduction
system (Figure 2.2) are the Sinoatrial (SA) node, also known as pacemaker node, the
Atrioventricular (AV) node, the bundle of HIS, and the Purkinje Fibres (PF).
Figure 2.2 Location of the SA and AV nodes, AV bundles, and Purkinje Fibres [14].
In general, the SA node lies at the top part of the right atrium spreading downwards and
finally connecting to the AV node via internodal pathways. The AV node sits in between
the right atrium and ventricle, and is the only conduction point between the atria and the](https://image.slidesharecdn.com/ae85dd04-08fc-4c3b-9c1d-305c86daa3ce-150905063655-lva1-app6891/85/Siirila_Antti_master_thesis_final_june_2015-18-320.jpg)
![11
ventricles. Continuing down from the AV node, the bundle of HIS further divides into
two branches. One extends down to the bottom of the right ventricle and the other to the
left ventricle respectively. At the ends of those branches, there are Purkinje Fibres that
spread around the ventricles.
2.3.3 Action Potential in Cardio Myocytes
The properties of the action potential in cardio myocytes vary depending on their
anatomical location. The action potential in myocytes, forming the SV node, is similar
with the ones in nerve and skeletal muscle cells. However, that action potential is
autonomously excited by an ion current that is generally referred to the funny current
[15], [16]. The funny current occurs during the refractory phase of the cell causing a slow
continuous increase in the membrane potential. Since the membrane potential is steadily
rising, it finally reaches to the threshold voltage leading to another action potential.
The myocytes in the AV node have a similar mechanism for generating the action
potential. However, since the action potential in the SV node occurs at a higher frequency
than in AV node or in any other part of the cardio conduction system, the SV node is
responsible for setting the heart’s pace [16]. Hence, the name pacemaker node.
In the action potential of atrial and Ventricular myocytes, the repolarization phase is
delayed due to Ca2+
influx [17]. The delay causes a plateau phase in the action potential,
which prolongs the depolarization of the myocyte. The plateau directly defines the
duration of the systole. Although, the plateau phase in action potential is expressed in
both the atrial and ventricular myocytes, it is particularly significant in the ventricular
myocytes.
The plateau phase also defines the length of a period called Effective Refractory Period
(ERP) [18]. During ERP, a new action potential cannot be generated in the
cardiomyocyte. Hence, ERP protects the heart from too intensive beating. A typical ERP
length varies from 150 ms to over 500 ms depending on the heart rate and the location of
the cyrdiomyocyte.](https://image.slidesharecdn.com/ae85dd04-08fc-4c3b-9c1d-305c86daa3ce-150905063655-lva1-app6891/85/Siirila_Antti_master_thesis_final_june_2015-19-320.jpg)
![12
2.4 Sinus Rhythms
The heart is said to be in sinus rhythm, if the pace of the heart origins form the SA node.
The normal sinus rhythm is in between 60 – 100 Beats Per Minute (bpm) depending on
the individual [19]. If the pace is below 60 bpm, the rhythm is called sinus bradycardia.
The sinus bradycardia is a normal condition and it often exists with persons in strong
physical condition such as athletics. Conversely, when the heart rate increases over 100
bpm, the rhythm is then called sinus tachycardia. Sort-term sinus tachycardia is normal,
especially when the person is under physical or mental stress. Elevated heart rate is also
normal for infants. However, a long-term sinus tachycardia with no notable cause may
indicate an abnormal behaviour of the heart. Ultimately, an irregularly beating heart,
which is still excited from the SA node, is said to be in sinus arrhythmia. Sinus arrhythmia
is usually a normal condition for young people, caused by the respiration cycle. However,
in some case the sinus arrhythmia may be an indication of abnormal heart functions.
A human heart is a complex system regulated by a vast number of different biological
and physiological mechanisms, many of which still remain undiscovered. This chapter
hopefully has brought up the essential information of those issues guiding the way to a
better understanding of the following Electrocardiogram chapter.](https://image.slidesharecdn.com/ae85dd04-08fc-4c3b-9c1d-305c86daa3ce-150905063655-lva1-app6891/85/Siirila_Antti_master_thesis_final_june_2015-20-320.jpg)
![13
3 ELECTROCARDIOGRAM
Electrocardiogram refers to a method in which the electrical activity of the heart is
captured and then visualised as a commonly known waveform of ECG. The resulted ECG
waveform provides the means for doctors to point out different functions of the hearth. In
addition, the waveform provides valuable information in the process of diagnosing
abnormal behaviours of the heart.
An ECG device can roughly be divided into three different units. Firstly, the signal
acquisition unit captures an analogue ECG signal through a set of electrodes placed on
the human body. Secondly, the signal processing unit filters the acquired signal aiming
to reduce noise and other artefacts. In addition, the signal processing unit is responsible
of converting the acquired signal into the digital domain via an A/D converter. The exact
point where the conversion takes place varies depending on the system specifications.
Finally, the processed ECG signal can be read from a user interface unit.
How ECG describes the functionality of the heart is revealed in an interpretation process.
The interpretation process focuses on the five key waves of the ECG waveform namely
P, Q, R, S, and T [20]. Each wave represents a certain functionality in the heart. For
instance, the Q, R, and S waves – generally called as QRS-complex – relate to the
contraction in the ventricles. Alteration in any of the five waves may indicate an abnormal
functionality of the heart. However, noise and other artefacts as well as the de-noising](https://image.slidesharecdn.com/ae85dd04-08fc-4c3b-9c1d-305c86daa3ce-150905063655-lva1-app6891/85/Siirila_Antti_master_thesis_final_june_2015-21-320.jpg)
![14
process may equally alter the ECG output. Therefore, the de-noising of the ECG signal
must be carefully designed and implemented in an ECG detection system.
Since the ECG filtering is such a crucial part of an ECG detection system, the complete
chapter 4 has been dedicated for it, and therefore it is not discussed in this chapter. This
chapter, on the other hand, deals with the ECG electrodes and their placements as well as
how electrodes in different locations provides different views from the heart. Finally, the
ECG interpretation process is discussed.
3.1 ECG Signal Acquisition
The ECG waveform is formed by measuring potential differences between two electrodes
placed on human body as function of time. The shape of the waveform, or the Lead as it
is generally referred, depends on from which direction the heart is measured. The
direction again is defined by the placement of the electrodes in relation to the heart. The
amount of measuring electrodes vary from 3-4 in ECG monitoring devices up to 10 in
more accurate diagnosis device [21, p. 15].
The ECG electrodes works as an interface between the body and the ECG device. As
mentioned earlier, the number of electrodes can vary from 3 to 10 depending on the ECG
device. The devices used for the ECG monitoring is based on four electrodes namely the
extremity electrodes or the limb electrodes (an electrode in each extremity). Very often,
however, the number of electrodes is only three as defined by the father of ECG, William
Einthoven [22]. The more accurate 12 Lead ECG devices provide a more thorough view
of the heart by introducing six more electrodes referred as chest electrodes. The 12 Lead
ECG devices are mainly used in the clinical environment for diagnosis purposes. Since
the emphases of this study is on the ECG monitoring devices, this chapter concentrates
only on the ECG acquisition with four or less electrodes.
According to the Einthoven’s Triangle [22], the ECG electrodes are attached on the both
upper limbs and on the left lower extremity. This three electrodes setup creates a triangle-
like formation around the heart, in which the heart forms the centre point for the triangle.
The legs of the triangle are called Leads.](https://image.slidesharecdn.com/ae85dd04-08fc-4c3b-9c1d-305c86daa3ce-150905063655-lva1-app6891/85/Siirila_Antti_master_thesis_final_june_2015-22-320.jpg)
![15
Figure 3.1 The placement of the ECG electrodes on human body. The green arrows
represent the I, II, III – basic Leads that are formed between the electrodes. The blue
arrows on the other hand illustrate the three extra Leads provided by the insertion of the
fourth electrode, the permanent ground electrode.
The three Leads and their relation to the polarity of the electrodes are illustrated in Figure
3.1. The polarity of the electrode, which is not participating to the lead, is set to neutral.
In other words, it is set to the ECG device’s reference point which in many cases is the
ground. Another interesting point that was defined by Mr. Einthoven is that the sum of
the outputs of Leads I and III must be equal with the output of Lead II. Hence, the lead II
provides the most extensive view from the heart. For that reason, it is often used in ECG
monitoring devices.
In addition to the three base Leads (I, II, III), it is possible to acquire three more lead
forms by increasing the number of electrodes to four. The fourth electrode works as a
permanent ground electrode whereas the actual ECG acquisition is done with the three
other electrodes placed according to the Einthoven’s Triangle. The three extra leads are
called augmented leads and generally referred as aV-leads [21, p. 16]. There is one aV
for each electrode namely aVR towards the right arm, aVL towards the left arm, and
finally aVF towards the left leg. The aV signals are acquired by combining two of the
three electrodes to a single negative electrode, which is then compared against the
remaining positive electrode. For instance, aVR equals to combination of LL+LA as
negative electrode and RA as positive electrode. The other two aV-signals can similarly
be constructed as indicated in Figure 3.1. Besides the four electrodes ECG devices, it has
RA LA
LL
Lead I](https://image.slidesharecdn.com/ae85dd04-08fc-4c3b-9c1d-305c86daa3ce-150905063655-lva1-app6891/85/Siirila_Antti_master_thesis_final_june_2015-23-320.jpg)
![16
been suggested that by combining the RL and LL electrodes to a single LL electrode, it
would be possible to acquire all the six Leads by using only three electrodes [23].
Figure 3.2 The axial reference system defines the viewing angle for each Lead in
relation to the heart [24].
Each Lead provides a specific viewpoint to the heart. The extremity leads works on the
vertical plane only whereas the additional chest leads provides a second – horizontal –
plane to the system [21, p. 17]. Figure 3.2 illustrates the vertical plane and defines the
viewpoints on it for each Lead. The Leads are represented on an axil reference system as
vectors that start from the centre of the hearth. The Lead I looks the heart from the east
on the horizontal centreline. That point is the 0° point to which the other viewpoints relate.
Hence, the Lead II diverts 60° and the Lead III 120° from the Lead I. Moreover, the
equation of I + III = II can easily be proven from the axial reference system. If one moves
the Lead III to the right until its other endpoint meets the endpoint of the Lead I then the
remain endpoint of the Lead III will meet the endpoint of the Lead II.](https://image.slidesharecdn.com/ae85dd04-08fc-4c3b-9c1d-305c86daa3ce-150905063655-lva1-app6891/85/Siirila_Antti_master_thesis_final_june_2015-24-320.jpg)
![17
Each of the six monitoring Leads generates a different ECG response for a cardiac cycle
[21, p. 21]. The sample deflections for the all six monitoring Leads are shown in the figure
3.3. A positive ECG deflection is generated whenever a depolarization wave propagates
toward the positive electrode. The same applies if a repolarization wave is moving away
from the positive electrode. In contrast, a depolarization traveling away from the positive
electrode and a repolarization wave approaching to it are shown as a negative deflection
on ECG.
Figure 3.3. The ECG deflections acquired with the four electrodes [25].
As mentioned earlier, the depolarization first travels downwards and then upwards in the
ventricles. Since the Lead II is located under the ventricle, the ventricle depolarization
first propagates towards the positive electrode of the Lead II (R-wave) and then away
from it (S-wave). As a result, the Lead II provides the greatest deflection for QRS-
complex [21, p. 21]. In addition, it can be clearly noticed from Figure 3.3 that the Lead II
is the sum of the other two Leads, I and II. The same rules apply for the augmented Leads
as for the limb Leads. However, the viewing angles are different and therefore the
deflections change accordingly.
There exists a vast variety of commercially available electrodes for long-term ECG
monitoring. A common factor among these electrodes is that they require skin contact.
Typically, an ECG electrode is equipped with a self-adhesive, which allows it to be fasten](https://image.slidesharecdn.com/ae85dd04-08fc-4c3b-9c1d-305c86daa3ce-150905063655-lva1-app6891/85/Siirila_Antti_master_thesis_final_june_2015-25-320.jpg)
![18
on the body. The electrode is in contact with the body through some conductive gel that
improves the conductivity between the electrode and the skin, and reduces signal noise.
Table 3.1 The list of ECG electrodes and their placement on the body.
Electrode name Placement on the body
Right Leg (RL) Within the range of the ankle and sub-torso
Right Arm (RA) Within the range of the shoulder and wrist
Left Leg (LL) Within the range of the ankle and sub-torso
Left Arm (LA) Within the range of the shoulder and wrist
The location of the extremity electrodes can be freely chosen within the range defined in
Table 3.1. However, the placement shall be consistent. For instance, if the RA electrode
is placed on the shoulder level then LA shall also be placed on the same level. Moreover,
the further the electrode is from the heart the weaker is the acquired signal. Therefore, it
is a good practice to place the electrodes as close to the heart as possible with the respect
of Einthoven’s Triangle [26, p. 23]. This approach also reduces the amount of artefacts
caused by the limb muscles. In addition, when considering the noise, it is equally
important to make sure that there is no hair or other impurity between the body and the
electrode.
The skin contact oriented electrodes usually introduces discomfort for the patient being
monitored. The discomfort is a sum of many factors such as regular electrode
replacement, routing the wiring of the electrode through the clothing, skin irritation
caused by the self-adhesive or the conductive gel, to mention some of them. This has
motived many researchers to find a solution for a long-term contactless ECG electrodes
[27]–[30]. Contactless ECG electrode would ease the long-term ECG monitoring
tremendously from the patient’s point of view. However, there are still many unsolved
issues when it comes to the signal quality of the contactless ECG electrodes. Therefore,
relying on the traditional ECG electrodes requiring skin contact would be wise when
concerning the signal quality. Especially ECG monitoring devices with autonomous
abnormality detection would benefit from electrodes with high quality signal acquisition
capabilities.](https://image.slidesharecdn.com/ae85dd04-08fc-4c3b-9c1d-305c86daa3ce-150905063655-lva1-app6891/85/Siirila_Antti_master_thesis_final_june_2015-26-320.jpg)
![19
3.2 Interpreting ECG Response
The ECG waveform is an electrical interpretation of the different states of cardiac cycle.
By analysing the waveform, it is possible to monitor the condition of the heart.
Furthermore, in the case of an abnormally behaving heart, the ECG analysis provides
robust means for diagnosis. When designing an autonomous ECG detection system, it is
crucial to understand the interpretation process of the ECG signal and also how the signal
maps to the cardiac cycle of a healthy heart.
3.2.1 ECG Waves and Cardiac Cycle
The mapping of the ECG waveform to the cardiac cycle in normal sinus rhythm is shown
in Figure 3.4. Each of the five waves PQRST can directly be map to a certain state of the
cardiac cycle.
Figure 3.4 Wiggers Diagram maps the ECG signal to the cardiac cycle [31].
As mentioned, the cardiac cycle starts at the diastole phase during which the heart muscle
is relaxed. At the end of the diastole, the atria contracts and pushes the blood into the
ventricle. The atria contraction is caused by the SA node which generates a stimulus that](https://image.slidesharecdn.com/ae85dd04-08fc-4c3b-9c1d-305c86daa3ce-150905063655-lva1-app6891/85/Siirila_Antti_master_thesis_final_june_2015-27-320.jpg)
![20
leads to the action potential. With the help of the Bachmann’s bundle and since the
cardiomyocytes are interconnected, the action potential rapidly propagates around the
atria leading to atrial contraction [13]. This part of the cardiac cycle is expressed as P-
wave on the ECG waveform and it is the start of the atrial systole state [19, p. 18]. P-wave
detection is important, since its presence with acceptable PQ-interval indicates that the
patient is in sinus rhythm. The Lead II has the most profound response for the P-wave.
Once the Action Potential reaches the AV node, its propagation velocity decreases,
delaying the signal. Since the cardiomyocytes in the atria and those in the ventricles are
electrically connected only via the AV node [13], [32], the contraction in the ventricles is
also delayed. This delay is an important part of the contraction cycle allowing the blood
from the atrial chambers to flow into the ventricle chambers before the start of the systole.
After the delay caused by the AV node, the stimulus propagates rapidly down to the
ventricle via the bundle of His. This is shown as Q- and R-waves in ECG [19, p. 18]. The
Q-wave is the first negative deflection following the P-wave whereas the R-wave starts
right after the peak of the Q-wave.
The systole starts when the stimulus reaches the Purkinje Fibres. This is the R-peak in the
QRS-complex [19, p. 19]. The S-wave deflection on ECG is caused by the stimulus
moving upwards from the bottom of the ventricles via the Purkinje fibres leading to the
contraction in the ventricles. The plateau phase in the action potential of the
cardiomyocytes defines the duration of the systole phase. As a result, this can be seen as
flat line (ST-segment) on ECG. The final state in the cardiac cycle and the end of the
systole is the relaxation of the ventricles. This is due to the repolarization of the ventricle
cardiomyocytes, which reflects as the T-wave on ECG. The atria repolarization on the
other hand occurs in parallel with the stimulus propagation in the ventricles. Therefore, it
mixes with the QRS-complex response.
3.2.2 ECG Intervals and Segments
The previous section explained the ECG waves in amplitude wise and mapped them to
the individual phenomenon of the cardiac cycle. Another equally important extraction of
ECG is the distance between the different waves and it will be discussed in this section.](https://image.slidesharecdn.com/ae85dd04-08fc-4c3b-9c1d-305c86daa3ce-150905063655-lva1-app6891/85/Siirila_Antti_master_thesis_final_june_2015-28-320.jpg)
![21
Figure 3.5 The points of interests in the ECG signal are PR-, QT-, QRS intervals and ST
segment.
Figure 3.5 defines the important distances between the waves of a normal ECG response.
The distances that include a wave response are referred as intervals. Segments on the
other hand refer to periods during which the ECG response is flat.
The RR-interval defines the distance between two subsequent QRS-complexes from
where the heart rate can be extracted. Similarly, the PP-interval – does not show in the
figure – is another way for defining the heart rate. The RR-interval tells more about the
ventricles contraction pace whereas the PP-interval targets on the atria.
The first interval in the cardiac cycle is the PR-interval [19, p. 19]. The PR-interval
indicates the time from the start of the P-wave to the start of the Q-wave. Thus, it covers
the atrial depolarization and the delay in the AV node. Normally, the duration for PR-
interval is within the range of 120-200 ms for adults. A shorter interval may refer to an
extra conduction pathway between atria and ventricles whereas longer interval usually
indicates a prolonged delay in the AV node.
The QRS- and QT-intervals start form the end of PR-interval [19, p. 19]. The QRS-
interval reveals how rapidly the depolarization propagates in the ventricles. The end of](https://image.slidesharecdn.com/ae85dd04-08fc-4c3b-9c1d-305c86daa3ce-150905063655-lva1-app6891/85/Siirila_Antti_master_thesis_final_june_2015-29-320.jpg)
![22
QRS-interval is at the point where the S-wave return back to zero level and its duration
is from 70 to 100 ms. Problems in the ventricle conduction systems usually reflects as
prolonged QRS-interval. Besides the QRS-interval, the QT-interval measures the
duration of a full ventricle contraction cycle. It contains the whole systole of the ventricles
starting from the rapid shoot up of the action potential (QRS), illustrating the plateau
phase (ST-segment) and finally returning back to membrane potential at the point where
T-wave return back to zero level. It is important to notice that the duration of the QT-
interval varies in relation to the RR-interval as defined in the following equation.
𝑸𝑻 𝒄 =
𝑸𝑻
√𝑹𝑹
Prolonged QTC often refers to serious problems in ventricles. Differing from the QT-
interval, the TQ-interval indicates the relaxation – diastole – period of the ventricles. TQ
starts from where the QT-interval ends and ends to the beginning of the next QRS-
complex. Together the QT- and TQ –intervals contain the complete cardiac cycle starting
from a QRS-complex to the next QRS.
The segments describe the plateau phase of the action potential in the atria and ventricles
[19, p. 19]. The PR-segment relates to the atria whereas the ST-segment follows the
plateau of the ventricles cardiomyocytes. As being part of the PR-interval, the PR-
segment indicates the delay of the sinus excitation while it is propagating from the atrial
to the ventricles. A short PR-segment indicates existents of possible additional pathways
from the atrial to the ventricles. Conversely, a propagation block in the AV node appears
as prolonged PR-segment on ECG. Just like PR-segment in atria, the ST-segment
indicates the contraction phase of the ventricles. Elevation or depression of the ST-
segment generally refers to some problems of the blood circulation in the ventricle
myocardia. However, a reliable detection of the ST-segment usually requires a diagnostic
level ECG devices with 10 or more electrodes to be used, hence it is less attractive
derivate when it comes to the ECG monitoring devices [33].
3.3 Discussion
As shown in this chapter, the ECG signal captures the electrical activity of the heart. The
ECG signal is acquired through a set of electrodes that form a set of Leads. Depending](https://image.slidesharecdn.com/ae85dd04-08fc-4c3b-9c1d-305c86daa3ce-150905063655-lva1-app6891/85/Siirila_Antti_master_thesis_final_june_2015-30-320.jpg)
![25
4.1 Basic Concepts of the Filtering
Signal filtering may be done on signals in both analogue and digital domains. The main
difference between these two is that signals in the analogue domain have a continuous
amplitude as a function of continues time whereas signals in the digital domain have a
discrete amplitude and time [34, p. 11]. The signal transition from analogue to digital
domain occurs through the Analogue-to-Digital Conversion (ADC). In the ADC process,
the amplitude of the analogue signal is measured periodically with a constant predefined
and fixed time-interval called sampling rate. The result is an ordered stream of discrete
samples, digital values which each represent the amplitude of the analogue signal at the
time of measurement. The ADC resolution is defined as the number of bits used for
presenting the amplitude value. The higher the resolution the finer the digital spectrum of
the amplitude value. The sample rate on the other hand defines the time interval between
two consecutive samples. According to the Nyquist-Shanon sampling theorem, in order
to be able to recreate the original signal from the digital samples, the original signal must
be sampled with at least twice the frequency of its highest frequency component. If this
is not the case, a phenomenon called aliasing occurs leading to a distortion in the recreated
signal.
Some advantages of the Digital Signal Processing (DSP) are that it enables an accurate
and reliable filtering process, an ability to store and replay the signal, an easy transform
from time domain to the frequency domain and an introduction of linearity to the system.
Drawbacks with the DSP filtering are that it requires more processing power and
significantly more resources than analogue filtering. Analogue signal processing on the
other hand offers better real-time filtering features with lower processing power and less
resource utilisation. However, an analogue system is more susceptible to noise and is less
accurate since it depends directly on the physical components. In addition, the signal noise
tends to accumulate in multi-stage analogue filtering systems. As a result, a filtering
system is often established as a hybrid mixed-signal system, combining the advantages
of both analogue and digital signal processing [35].
Signal filtering systems are hard to categorize, since they contain many dimensions which
overlap each other. As discussed earlier, one way of categorizing the signal filtering
systems is to divide them based on their input signals to either the analogue or digital](https://image.slidesharecdn.com/ae85dd04-08fc-4c3b-9c1d-305c86daa3ce-150905063655-lva1-app6891/85/Siirila_Antti_master_thesis_final_june_2015-33-320.jpg)
![26
filtering system. Similarly, a filtering system can be categorized based on its output
frequency band. A Low-Pass Filter (LPF) attenuates the input frequencies above the cut-
off frequency of the filter. In contrast to LPF, a High-Pass Filter (HPF) passes the
frequencies above its cut-off frequency and attenuates those falling below the cut-off. A
Band-Pass Filter (BPF) allows only a certain frequency band of the input signal to pass
through the filter, while both Band-Stop Filters (BSF) and Notch Filters (NF) attenuate a
predefined frequency band, letting all the other frequencies pass through the filter. The
difference between BSF and NF is that the latter, as the name implies, only attenuates a
very narrow band from the overall frequency band, whereas the stop-band of BSF can be
wider.
Another way of categorization is to divide the filtering systems based on their properties.
These properties include linearity, causality, time variance, and stability [34, p. 112]. In
a linear system, if an input x1 produces an output y1 and similarly another input x2
produces an output y2 then any one of the two inputs scaled with a factor c will produce
the output that is scaled with the same factor of c. A causal filtering system is a real-time
system that only works with the inputs of current time or inputs from the past. Thus,
causality does not allow the system to predict inputs from the future. A time-invariant
system produces the same output for an input no matter if the input is fed to the system
at time t or at time t+T. That is, the output is only delayed in time by the amount of T. In
a time-variant system, however, the delay T does not propagate through the system but
varies causing the output to be produced after some time (t+T +tv). The length of the delay
depends on the input and hence makes the time-variant system hard to predict. Stability
simply refers to a system that produces a bounded output for a bounded input.
Impulse response is yet another way of categorizing filtering systems [34, p. 112]. The
impulse response of a system is defined as the output for an input signal having an
amplitude other than zero for a short period while otherwise the amplitude is zero. The
definition of the impulse signal depends on whether the signal is analogue or digital. The
filtering systems producing a Finite Impulse Response (the impulse response settles back
to zero within a finite period) are called FIR systems. In contrast to FIR, the systems
outputting an Infinite Impulse Response (the impulse response approaches zero but never
settles back to it) are generally referred as IIR systems. FIR and IIR implementations in
the digital domain rely on cascaded filter components called taps. A filter can be either](https://image.slidesharecdn.com/ae85dd04-08fc-4c3b-9c1d-305c86daa3ce-150905063655-lva1-app6891/85/Siirila_Antti_master_thesis_final_june_2015-34-320.jpg)
![27
recursive or non-recursive depending on whether or not it uses a feedback loop from the
output to the input. A basic tap contains a delay unit, multiplier and adder. The input
sample is stored in the delay unit. The multiplier has two inputs, one for the sample and
the other for the coefficient. The coefficient defines that portion of the sample passed to
the adder. The adders and the delay units are cascaded to form a digital filter of a certain
length, of order N. The number of taps in a non-recursive FIR filter, which is the most
common form of digital filter, is N+1.
Although ways of categorizing the signal processing systems are many, none of them is
comprehensive. An analogue system may be linear or non-linear, time-variant or time-
invariant, just as an IIR filter can be stable or unstable depending. However, two
properties play an important role in system characterization: linearity and time-
invariance. A linear and time-invariant system (LTI) have many advantages that are
commonly exploited in DSP systems [34, p. 69]. The FIR systems are typical linear and
time-invariant (LTI) systems and hence are commonly used in DSP.
Figure 4.1 Graphical illustration of a waveform and its Fourier Series
The French mathematician Jean-Baptiste Fourier (1968 – 1830), states that any periodic
signal, as well as any quasiperiodic signal, can be presented as a Fourier Series consisting
of a finite or infinite set of sine and cosines waves (Figure 4.1). These sinusoidal signals,
or harmonics, vary in their frequency as well as their amplitude. Harmonics with a lower
frequency have a greater amplitude than those with higher frequencies. This being so, the
low frequency signals have the greatest effect on the original periodical signal.](https://image.slidesharecdn.com/ae85dd04-08fc-4c3b-9c1d-305c86daa3ce-150905063655-lva1-app6891/85/Siirila_Antti_master_thesis_final_june_2015-35-320.jpg)
![28
Additionally, the signal amplitudes in a Fourier Series can be presented in either the time
or the frequency domain. The transform from time domain to frequency domain is called
Fourier transform and it is the basis for the modern DSP.
4.2 Fourier Series of the ECG Signal
As we known, the PQRST waves in ECG repeat periodically. However, the duration of
the ECG period is not constant, since the heart may beat faster or slower depending on
the physical or emotional stress to which the body is exposed. Due to its time-varying
nature, the ECG signal is quasiperiodic, as are all bioelectrical signals. Despite the
variations in period length, the ECG signal can be presented as a Fourier Series. A recent
study showed that a typical ECG signal can be decomposed to 169 harmonics of which
the first 40 most influence the shape of the original ECG signal [36].
Table 4.1 The key frequency bands of the ECG signal [37].
ECG Wave Frequency Band of the
Harmonics (Hz)
Description
R-R interval 0,67 – 5 R-R interval is the distance in time between two
subsequent heartbeats. Heart rate can vary between 40
– 300 bpm depending on the body strain. Typical
resting heart rate for adults falls in the range of 60 –
100 bpm.
P-wave 0,67 – 5 P-wave reflects the depolarization in the atria. The
pacemaker node resides in the right atrium and its
frequency range equates with the R-R interval.
QRS-complex 10 – 50 QRS-complex reflects the depolarization in the
ventricles. The propagation velocity is higher in the
ventricles than in the atria, hence higher frequency
harmonics.
T-wave 1 – 2 Repolarization in the ventricles deflects as T-wave in
ECG, revealing the membrane potential. The ION
current against the driving force is slow, hence the
lower frequency.
Table 4.1 lists the typical frequencies in which the harmonics comprising the different
ECG waves fall. The table suggests that the required frequency band for an ECG signal
is between 0.5 and 50 Hz. However, an ECG signal may also contain higher frequency
components such as pacemaker signals which can reach up to 150 Hz in adults and even
250 Hz in infant hearts. Therefore, the required frequency band for a diagnostic level
ECG device must cover frequencies up to that range.](https://image.slidesharecdn.com/ae85dd04-08fc-4c3b-9c1d-305c86daa3ce-150905063655-lva1-app6891/85/Siirila_Antti_master_thesis_final_june_2015-36-320.jpg)
![29
The ECG signal also contains Furrier Series from unwanted noise sources. Noise sources
are typically muscle noise from body movements, respiration noise, noise from skin-
electrodes and external electrical noise. Some of these noise components are relatively
easy to filter out while others require much more attention since they mix with the original
ECG signal band.
Table 4.2 Typical noise components that interfere with the ECG signal.
Noise source Frequency Band of the
Harmonics (Hz)
Description
DC 0 The DC component introduced by skin-electrodes has
a high amplitude that shifts the baseline of the ECG
signal above zero. Always present.
Respiratory 0,12 – 0,5 Respiration noise causes the ECG baseline to wander
according to the in- and exhalation. Always present.
Muscles 5 and higher The EMG signals from other body muscles mix with
the ECG harmonics and are therefore extremely
problematic. Always present.
Power line 50/60 Power line noise is a significant noise factor in an ECG
device. Depending on the power grid system, the
frequency is 50 or 60 Hz. Typically the power
frequency in Europe is 50Hz and 60Hz in the USA.
Usually present.
Other ambient 50 and higher RF noise and other external electrical noise. Usually
present.
As can be seen in Table 4.2, DC and respiratory signals do not mix with the ECG signal’s
frequency band whereas the other noise components do. All noise causes distortion in the
ECG signal and therefore its presence needs to be minimized. The DC component has a
constant amplitude, which elevates the baseline of the ECG signal on the y-axis. Thus, a
reliable amplitude measurement becomes impossible. The DC component therefore needs
to be cancelled from the ECG signal. Respiratory noise and some other low frequency
muscle noise cause alterations in the ECG baseline. In other words, although PQRST-
complexes look normal, their baseline drifts, wandering above or sinking below the zero
level over the course of time. This introduces problems in ECG interpretations, especially
in the detection of ECG parts with zero amplitude such as in PT and ST-segments. Muscle
noise inflicts the most distortion on the ECG signal, mixing with the ECG band. This
makes the filtering process a real challenge [38]. Another problem with the muscle noise
is that it is unpredictable. The EMG noise is minimal or none when the patient is at rest.
Once the patient moves his/her limbs, starting to walk or run, the EMG noise is present](https://image.slidesharecdn.com/ae85dd04-08fc-4c3b-9c1d-305c86daa3ce-150905063655-lva1-app6891/85/Siirila_Antti_master_thesis_final_june_2015-37-320.jpg)
![30
and its frequency band is constantly changing according to the body movements.
Similarly, ambient electrical noise mixes with the ECG band. However, it is more
predictable and is usually expressed only on a narrow frequency band. Hence, the filtering
process of power line or other ambient noise is more straightforward.
4.3 De-noising ECG Signal
In general, there are two approaches to the de-noising of ECG signal [39]. The signal can
be pre-filtered in the analogue domain and then further de-noised in the digital domain.
Figure 4.2. A typical set up for a hardware based de-noising of ECG signal. The
analogue ECG is band limited and amplified before the A/D conversion [39].
Hardware based analogue de-noising of ECG signal is illustrated in Figure 4.2. The
system contains an HPF and LPF with two stages of gain. Since the de-noising has already
been performed in the analogue domain, ADC resolution of 8 to 16 bits is usually
sufficient to obtain a high enough Signal-to-Noise Ratio (SNR). SNR refers to the ratio
of original signal power to the power of the noise. The higher the SNR is the better are
the chances of detecting the original signal.
Alternatively, an analogue ECG signal can be directly converted to the digital domain
where the de-noising is done [39]. In such a case, the resolution of the ADC-converter
must be greater than in the hardware based de-noising system in order to achieve a
sufficient SNR ratio. Digital de-noising reduces the overall signal resolution, hence the
higher SNR is required. The advantages of this approach are reduced hardware cost and
more accurate and flexible filtering. Despite the chosen de-noising approach, the DSP
filtering plays a crucial role in modern ECG monitoring devices. This is the case also in
this study, where ECG signal filtering of the proposed ECG monitoring framework will
partially rely on DSP filtering techniques.](https://image.slidesharecdn.com/ae85dd04-08fc-4c3b-9c1d-305c86daa3ce-150905063655-lva1-app6891/85/Siirila_Antti_master_thesis_final_june_2015-38-320.jpg)
![31
4.3.1 Filtering systems
Digital de-noising of the ECG signal is typically done using FIR or IIR filters. These
filters can be used for basic filtering systems such as LPF, HPF, notch filters or as
components of more complex filtering systems. Some complex filtering systems
commonly used in ECG filtering are adaptive and wavelet filters. The benefit of these
complex systems is that they are generally better suited than basic filtering systems for
de-noising signals containing artefacts, such as all biometric signals which often mix with
each other. The drawback of using the complex filtering systems is that they introduce
more computational complexity and hence consume more processing power and area.
An adaptive filter is typically a digital FIR filter or any other fixed length filter in which
the filter coefficients are adjusted over the course of time [40]. Coefficient adjustment is
based on the difference between the obtained input signal containing some noise and a
desired signal fed to the system as second input. Wavelet filers, based on the Discrete
Wavelet Transform (DWT), also rely on FIR filters. The very basic concept of the wavelet
filter is that it first decomposes the input signal into wavelet coefficients using DWT. It
then compares the coefficients against a threshold value and substitutes them with zero if
they fall under the threshold. The signal is finally reconstructed or synthesised from the
wavelet coefficients. DWT is implemented using a finite length FIR filter bank containing
cascaded pairs of LP and HP filters each followed by a downsampler [41]. Each cascade
level represents a wavelet scale. The highest scale is at the first level, where the raw signal
enters the filtering bank, whereas the last level has the lowest scale. The LP and HP filters
divide the frequency band of the input signal in half, resulting in two separated low and
high frequency bands. Both bands are then downsampled. The downsampling process is
based on Nyqvist’s frequency theorem and alleviates further signal processing. After that,
output of the high frequency band represents the detailed wavelet coefficients and
requires no more processing, while the low frequency band, referred to as approximation
coefficients, and are passed to the next filtering level. There, the low frequency band is
once again divided and downsampled, creating a new pair of low and high frequency
bands. After each level, a new frequency division is introduced. The process stops when
the downsampling process fails to take any samples. The result at this point is a time-
frequency domain representation of the input signal in the form of wavelet coefficients.
The HPF output at the root of the filtering bank – the first filter pair – has the finest time](https://image.slidesharecdn.com/ae85dd04-08fc-4c3b-9c1d-305c86daa3ce-150905063655-lva1-app6891/85/Siirila_Antti_master_thesis_final_june_2015-39-320.jpg)
![32
resolution and the most coarse frequency resolution of the input signal. The resolutions
change on each level so that the frequency resolution increases while the time resolution
decreases as it moves on down the cascaded filter bank. The actual filtering is done by
altering the obtained wavelet coefficients. The coefficients with a small amplitude value
have little or no effect on the original signal and can simply be set to zero. Typically, a
predefined threshold level is used to decide whether a particular coefficient is to be taken
into the reconstruction process or zeroed. The coefficients falling under the threshold
level represent the noise components of the original signal and hence can be removed.
The synthesis is simply a reverse procedure of DWT that starts from the lowest level. The
samples on each level are upsampled by a factor of two and then summed. Finally, the
output of the wavelet filter is available on the highest level of the synthesis tree.
4.3.2 ECG De-noising Techniques
The low frequency noise, that is respiratory and DC noise outside the ECG band, is
typically attenuated with a high-pass IIR or FIR filter. IIR is often chosen since it
introduces less computational complexity and delay into the system than FIR. However,
IIR filters have non-linear phase response. In other words, signal components from the
lower frequencies are delayed more than components from the higher frequencies. This
leads to a distortion in the original ECG signal and is especially problematic when
considering the ST-segment. The harmonics, between 0.05 – 0.5 have the most effect on
the ST-segment [36]. More precisely, if the harmonics from that frequency range were
filtered out, the ST-segment would be significantly distorted in the ECG output. The main
reason for this distortion is actually not the attenuation of the low frequency components,
but the non-linear phase shift over the harmonics caused by the IIR filtering. As a result,
when it comes to the precision of the ST-segment, the cut-off point for the high-pass IIR
filter should be no higher than 0.05 Hz. However, choosing such a cut-off frequency
reduces the efficiency of the baseline wander removal. Balanced against that, if a FIR
filter is used the cut-off frequency of HPF can be increased up to 0.5 Hz (the lowest
possible ECG signal component). The reason being that in FIR all frequency components
of the filtered signal are equally delayed. A FIR filter can therefore be used as DC and
baseline wander-remover with minimal distortion in the ST-segment and hence its use as
HPF in an ECG monitoring device is justified [42].](https://image.slidesharecdn.com/ae85dd04-08fc-4c3b-9c1d-305c86daa3ce-150905063655-lva1-app6891/85/Siirila_Antti_master_thesis_final_june_2015-40-320.jpg)
![33
As in the de-noising process of baseline wander and DC component, the power line or
other ambient electrical noise can similarly be filtered using either FIR or IIR filters. The
filter type is typically a notch, narrow band, or an adaptive filter. In any case, the goal is
to sufficiently attenuate the unwanted noise band without distorting the ECG signal.
Depending on which part of the ECG band is attenuated, the filtering may cause distortion
in the ECG signal. For instance, a simple notch filter used to attenuate the 50Hz power
line noise may result in a distorted QRS-complex since their frequency bands overlap.
Another cause of distortion can be the non-linear phase response of the de-noising filter.
Optionally, the power line noise can be cancelled by using an adaptive filter for this
purpose [43]. In this case, the desired signal (the second input of the adaptive filter) is
extracted from the power line directly. The desired signal and filter output is used to
produce an estimate of the noise which is then subtracted from the ECG signal. Power
line noise is mainly a problem of more accurate diagnostic ECG devices with a frequency
band from 0.05Hz to 150 or even up to 250Hz in some cases.
Since the EMG noise mixes with the ECG band and varies in time, use of traditional static
filtering techniques for its removal, such as HPF, LPF, or notch filters, could lead to a
severely distorted ECG signal [44]. Therefore, filters used for that purpose are typically
adaptive or wavelet filers. The desired signal of the adaptive filter can be a correlated
noise estimate or an estimate of a clean ECG signal [43]. The wavelet filter on the other
hand provides a simultaneous view of the frequency and time domain components of the
ECG signal. This can be used to determine and suppress the presence of the EMG noise
in the ECG signal. In recent decades, much research has been devoted to this issue of
EMG removal. The consensus is that wavelet filtering is perhaps the most promising
approach to the problem. However, an all-embracing filtering system for EMG or other
artefact-removal still remains to be discovered [45].
4.4 Automated ECG Signal Detection
Automated detection of PQRST-waves, their relationships and intervals is the
fundamental task of an automated ECG monitoring device. Reliably detected ECG waves
allow the device to decide whether the ECG response is within its normal limits. A
reliable ECG wave detection is based on a robust signal peak detection and on an
intelligent decision logic that is able to map the ECG waves to the detected peaks.](https://image.slidesharecdn.com/ae85dd04-08fc-4c3b-9c1d-305c86daa3ce-150905063655-lva1-app6891/85/Siirila_Antti_master_thesis_final_june_2015-41-320.jpg)
![34
Peak detection is a fundamental requirement of any signal processing system and has
likewise been a very active research topic over the last three decades. More than 40
publications are listed in reference [46] describing different peak detection methods. The
peak detection process locates the points where the signal amplitude is at its minimum or
maximum. Typically, the area where detection of amplitude and location can occur is
limited by a threshold level which defines the minimum or maximum amplitude value
that a candidate peak must obtain before it is accepted as such. Similarly, in time as in
frequency, rules must be applied to determine which of the adjacent min/max-values are
to be detected as a peak.
4.4.1 QRS-complex detection
The QRS-complex produces the most significant signal response in the ECG waveform.
For this reason, it provides a solid and easily detectable reference point to the cardiac
cycle. Once the QRS-complex is detected, the extraction of the other ECG waves and
their intervals can be done in relation to the detected QRS. Similar methods can be applied
for the detection of P and T waves and ECG intervals, as in the QRS-complex. Another
important feature of QRS is that the monitored heart rate can be determined from their
interval, measuring the time distance of two consecutive R-waves. Heart rate information
is not only valuable for the end users but also it plays an important role in correlating an
ECG detection system with a varying heart rate. The heart rate reveals the time-varying
nature of the ECG signal and can be used to adjust the system parameters of ECG
monitoring device to better match with the current situation. The heart rate information
could for instance be used in a de-noising process based on an adaptive filter system or
in threshold adjustment in various detection algorithms. Consequently, a robust detection
method of the QRS-complex is one of the fundamental parts of an ECG monitoring
device.
A vast number of differing methods for QRS detection have been introduced within the
past four decades [47], [48]. However, many of them share the same algorithmic structure
that divides the detection into two separated stages. In the first stage, called the pre-
processing stage, a feature signal is extracted from ECG. The pre-processing stage is
further divided into linear and non-linear filtering sub-stages. The second stage, the
decision stage, takes the feature signal as an input and detects the presence of the QRS-](https://image.slidesharecdn.com/ae85dd04-08fc-4c3b-9c1d-305c86daa3ce-150905063655-lva1-app6891/85/Siirila_Antti_master_thesis_final_june_2015-42-320.jpg)
![35
complex, based on certain decision logic. The decision stage is similarly divide into two
sub-stages: the peak detection logic and the decision sub-stages. Firstly, the peak
detection logic detects the QRS-complex based on static or adaptive thresholds. After
that, possible false detections are then exposed in the decision sub-stage. The decision is
typically based on certain heuristic methods.
The earliest and still commonly used QRS detection methods are based on the digital
filters and differentiators [48]–[50]. At the pre-processing stage, a digital BPF first
attenuates the ECG signal components other than the ones forming the QRS-complex.
Subsequently, the narrow band signal is passed to a differentiator. The final stage of the
pre-processor is the generation of the feature signal. This is done by first squaring the
difference signal and then integrating the result over a predefined window length. From
now on, the feature signal enters into the peak detection stage. The peak detection
continuously monitors the feature signal and stores its most recent maximum into a max
variable. Simultaneously, the detector compares the feature signal with the max variable
and once the signal level descends below half of the max variable, the peak is detected.
At this point, the narrow band signal is examined within a time window preceding the
peak detection. The so- called fiducial mark is set to the location of the highest peak of
the narrow band signal. The window length and location is defined so that if possible it
includes the QRS-complex. After the peak detection, the max variable is updated to the
current value of the feature signal and the detection continues. The fiducial mark and the
height of the highest peak in the narrow band signal are stored into an event vector.
Finally, the decision sub-stage decides which of the peaks in the event vector is the R-
wave. The decision is based on a set of adaptive thresholds.
Another approach uses DWT filtering banks at the pre-processing stage to divide the ECG
signal into wavelet scales [51]. The wavelet scales that contain most of the energy of the
QRS-complex are chosen for the detection process. The QRS-complex shows on the
DWT scales as two modulus maxima with opposite signs and zero crossing in between.
The QRS-complex is detected when a simultaneous modulus maxima on the different
scales produces a signal in the threshold logic.
Many other QRS-detection methods have also been introduced. Some examples of these
include the neural network, matched filter, and adaptive filter methods. Despite their](https://image.slidesharecdn.com/ae85dd04-08fc-4c3b-9c1d-305c86daa3ce-150905063655-lva1-app6891/85/Siirila_Antti_master_thesis_final_june_2015-43-320.jpg)
![37
5 TECHNOLOGIES AND MATERIALS
This chapter concentrates on the technologies and materials used in this study. The main
emphasis is placed on the Programmable System-on-Chip (PSoC) technology to which
the proposed ECG Detection Framework is targeted. In addition, the chapter takes a brief
look at the ECG signal acquisition and transmission devices that were used in the case
study for this thesis.
PSoC typically contains a Reconfigurable Unit (RU), a hard core Processing Unit (PU),
reconfigurable interconnectivity buses within the chip, interfaces for external
communication, and finally a flexible design flow via a collection of development tools
[52]–[54]. PU is a collection of hard core devices inside PSoC that are able to interconnect
with RU and external peripherals. The heart of PU is the processor core. All major PSoC
vendors use an ARM core for this purpose. In addition, PU usually contains two levels of
cache memory, on-chip-memory, interfaces for various communication standards and an
interconnection bus allowing internal and external data transfer. RU sits right next to PU.
RU contains a large FPGA fabric and some domain specific programmable logic units
such as DSP blocks and A/D converters. Interconnections between and within units
occurs via a standardized interconnection bus [55]. For the ARM core, the bus protocol
standard is AMBA [56]. Furthermore, the system design and implementation is done
through a collection of development tools. The development environment seamlessly
combines HDL based hardware design to the software design in a Graphical User](https://image.slidesharecdn.com/ae85dd04-08fc-4c3b-9c1d-305c86daa3ce-150905063655-lva1-app6891/85/Siirila_Antti_master_thesis_final_june_2015-45-320.jpg)
![38
Interface (GUI). Finally, the development tools offer ready-made accelerators or other
data path units in their Intellectual Property (IP) block libraries. The tools also allow the
creation of a custom IP block through a guided procedure. As a result, PSoC combines
all the essential features for system development on multiple application fields. Systems
requiring optimized parallelism and power consumption can in particular benefit from the
PSoC technology.
5.1 Zynq - All Programmable SoC by Xilinx
Xilinx introduced the first FPGA chip in the early 1980’s and has dominated the FPGA
markets ever since [57]. The recently released Xilinx Zynq-7000 series belongs to the
family of PSoCs and is known in Xilinx as All Programmable SoC (AP SoC). The Zynq
family packages two ARM cores and a vast FPGA fabric into a single chip [58].
Moreover, there are seven devices in the Zynq series each having a different size of FPGA
fabric [59]. In addition, Xilinx offers an extensive development tool set that allows a rapid
and flexible development flow for the Zynq devices.
5.1.1 Architecture
Figure 5.1 Architecture of the Zynq AP SoC by Xilinx [52]](https://image.slidesharecdn.com/ae85dd04-08fc-4c3b-9c1d-305c86daa3ce-150905063655-lva1-app6891/85/Siirila_Antti_master_thesis_final_june_2015-46-320.jpg)
![39
Figure 5.1 illustrates the architecture of the Zynq AP SoC. In the Xilinx terminology, PU
is referred to as PS (Processing System) and RU is called PL (Programmable Logic). The
centre of PS is the Application Processing Unit (APU) [60, p. 16]. APU contains two
ARM Cortex-A9 cores, shared level 2 cache, On-Chip-Memory (OCM), Snoop Control
Unit (SCU), Direct Memory Access (DMA) unit, timer units, and other controller units.
Surrounding APU is the interconnect bus [60, p. 197]. The AXI interconnect bus of ARM
AMBA family provides configurable connectivity between the different units inside PS.
Furthermore, it allows PL to communicate with PS and vice versa. Moreover, APU has
dedicated bus interfaces to DRAM memory controller and to PL thus optimising L2 cache
access and coherence. Finally, PS can be linked via the interconnect bus to the
Multiplexed I/O (MIO) interface for external peripherals. As can be seen from the Figure
5.1, Zynq is able to interface with several different serial communication protocols. For
each protocol, Zynq offers two separated interfaces. In addition, there are also two Gigabit
Ethernet interfaces and a SD memory interface. The connections between the interfaces
and MIO are configurable and, within some limits, can also be expanded to the PL side
using the Extended MIO (EMIO). Whereas the PS side only offers the coarse-grained re-
configurability, the PL side provides the FPGA fabric with highly fine-grained
configurability. The size of FPGA varies between 17000 and almost 300000 Look Up
Tables (LUT) depending on the Zynq device. Additionally, the Zynq embeds special
coarse-grained units – DSP slices and Block RAMs – within the FPGA fabric, allowing
for a more optimized implementation of certain types of application specific systems as
in signal processing. Moreover, PL contains two 12-bit A/D converters for internal
condition monitoring (temperature, voltage levels) or for some external analogue system
purposes. For external communication, PL offers General Purpose Input/Output (GPIO)
banks. For clocking purposes, four clock inputs enter PL from PS side. Alternatively, PL
clocks itself independently by generating and distributing a clock signal originating from
PL. As a final feature, the Zynq also offers a hard or soft core security block (depending
on the Zynq device) which supports various security features offering the end user
protection on many different levels [60, p. 35].](https://image.slidesharecdn.com/ae85dd04-08fc-4c3b-9c1d-305c86daa3ce-150905063655-lva1-app6891/85/Siirila_Antti_master_thesis_final_june_2015-47-320.jpg)
![40
ARM Cortex-A9
ARM processor – used in the Zynq series – is based on the ARM v7 architecture and is a
customized implementation of the Cortex-A9 processor [61] manufactured by Xilinx. The
customization includes the selection of the number of processor cores and the size of the
L1 cache. In addition, Xilinx has chosen to include some optional units namely NEON
engine and Floating Point Unit (FPU) in their instances from the Cortex-A9 cores [60, p.
20]. Each core has a dedicated level 1 cache which further divides so that there is a
separated 32KB cache for both instructions and data. Furthermore, NEON engine
performs Single Instruction Multiple Data (SIMD) operations on two input vector lines.
The size of the vectors and the line length can be configured. SIMD can be used to
accelerate data intensive processes such as video processing and other DSP processing.
Similarly, FPU offers acceleration for the floating point operation supporting the single
and double precision formats. Finally, since Cortex-A9 is an application level processor,
it is possible to run an Operating System (OS) such as embedded Linux on it. For this
reason, both of the ARM cores need a Memory Management Unit (MMU) to provide
virtual memory access for OS.
FPGA Fabric
Figure 5.2 The architecture of the programmable logic in the Zync-7000[60, p. 23]. The
Block RAMs and DSP48E1 slices are shown as green and blue rectangles respectively.](https://image.slidesharecdn.com/ae85dd04-08fc-4c3b-9c1d-305c86daa3ce-150905063655-lva1-app6891/85/Siirila_Antti_master_thesis_final_june_2015-48-320.jpg)
![41
FPGA fabric occupies the largest area inside the Zynq PL. Figure 5.2 shows the
architecture of the FPGA fabric based on the Xilinx 7-series [62]. The main building
blocks of the FPGA fabric are the Configurable Logic Blocks (CLB) which interconnect
via the programmable interconnects. CLBs are placed into a matrix-like formation inside
PL. Right next to each CLB is a switch matrix that enables the configuration of various
interconnectivity routes between the different blocks inside the fabric. Furthermore, the
Input/Output Blocks (IOB) are located on the edges of PL. Finally, the special DSP and
memory resources – marked as green and blue rectangles in Figure 5.2 – are located
between the CLB rows.
Within CLB, there are two logic components called Slices. Each Slice connects directly
to the switch matrix. Additionally, both Slices have a dedicated input and output for carry-
in and carry-out, respectively. The carry I/O can be used for building a bigger arithmetic
logic unit (ALU) by cascading CLBs vertically. Each Slice is further divided into four
Look Up Tables which are the smallest logic units in the Xilinx’s FPGA. LUT is a logic
resource that can be used for several different purposes. For instance, it can implement
any logic function taking six inputs. Alternatively, LUT can be used as a small Read Only
Memory (ROM) or a small Random Access Memory (RAM). Moreover, it can also
function as a shift register. Any of the earlier mentioned functionality can be scaled larger
by combining multiple LUTs together. In addition to LUTs, a Slice also contains eight
Flip-flops (FF) each able to hold a single bit. FFs are resettable and one of them can also
function as a latch if so required.
Special accelerators
As mentioned already, PL also contains special accelerator units namely DSP48E1 slice
and Block RAM [60, p. 25]. The special accelerator units are located in a column-like
formation within CLBs such that a Block RAM unit sits right next to each DSP48E1 slice
(Figure 5.2). This arrangement is optimal for arithmetic operations requiring high speed
and fast access to data.
DSP48E1 is especially designed for DSP operations but can similarly be used for any
other functions requiring addition/subtraction, multiplication or, alternatively, logical
operations. In particular, the operations having medium or long word length benefit from](https://image.slidesharecdn.com/ae85dd04-08fc-4c3b-9c1d-305c86daa3ce-150905063655-lva1-app6891/85/Siirila_Antti_master_thesis_final_june_2015-49-320.jpg)
![42
the DSP48E1 slice, since their implementation on traditional FPGA slice logic could
consume an unacceptable amount of resources.
Figure 5.3 The architecture of the DSP48E1 slice [60, p. 27]
I/O ports, their bit widths, and the main operation units of the slice are visualised in Figure
5.3. DSP48E1 slice defines four input ports namely A, B, C, and D and produces a single
output to port P. The main arithmetic units are pre-adder, multiplier, and post-adder. Both
of these adders are also capable of performing subtraction. Moreover, the post-adder can
also function as a logic operator supporting all basic Boolean operations.
Referring again to Figure 5.3, ports A and D connect to the pre-adder/subtractor. The
output of the pre-adder/subtractor and port B form the inputs of the multiplier. The post-
adder/subtractor takes one input from port C and the other can be either the multiplier
output or the previous value of P. The operations performed on the inputs are configured
using a control register called OPMODE. The configuration may include only one, two
or all three operation units depending on the required functionality. For instance, the
DSP48E1 slice can function as a simple accumulator taking its input from port C and
providing its output to port P. In that case, the two other units are not used. Typical usage
of the slice is as a tap for a FIR filter. A complete FIR filter can be achieved through a
cascading configuration that connects adjacent slices or taps together.
The second special resource, Block RAM, offers an alternative to the distributed RAM.
Being dedicated memory units, Block RAMs have advantages over the distributed RAMs](https://image.slidesharecdn.com/ae85dd04-08fc-4c3b-9c1d-305c86daa3ce-150905063655-lva1-app6891/85/Siirila_Antti_master_thesis_final_june_2015-50-320.jpg)
![43
when concentrated memories with high capacity and small latency are required. On the
other hand, the distributed RAM is better suited to the systems that require small capacity
memories with sparse physical location. The block RAMs can either be implement as
RAM or ROM. Additionally, it can be used as First In First Out (FIFO) buffer. Each block
RAM unit contains by default a single 36Kb RAM memory divided into 2048 elements.
The default element length is 18-bits. Alternatively, the block can be divided into two
independent memory block of size 18Kb. The element length can similarly be reduced
resulting in greater numbers of elements in each memory block. In contrast, the element
length can also be increased. This naturally results in fewer elements.
Advanced Extensible Interface
Advanced eXtensible Interface (AXI) interconnection set defines the interconnection
switches which allow physical connections between units, bus protocols, and finally
interfaces for bus access [60, p. 30]. AXI is specified in the ARM AMBA 3.0 open
standard and its current version is AXI4.
AXI4 is the fundamental part of the Zynq’s interconnection scene. It provides the means
for the PS-PL communication as well as for the internal communication within both PS
and PL fabrics. The PS-PL communication occurs over three different interconnect
switches and also over a special type of Accelerator Coherence Port (ACP). Through
ACP, a processing element in PL is able to coherently access the APU caches. The three
interconnect switches are named memory interconnect, master interconnect, and slave
interconnect. They all reside on the PS side. These switches further connect to the central
interconnect inside PS. The memory interconnect offers four high-speed master interfaces
(AXI_HP) for PL side. The interfaces are FIFO buffered and sometimes referred to as
AXI FIFO interfaces. Similarly, the master and slave interconnects offer two general
purpose interfaces, slaves (S_AXI_GP) and masters (M_AXI_GP) respectively for the
PL side.
A system designer is able to select between three different AXI4 protocols when
implementing PL-PS inter-communication. First, AXI4 is a memory mapped bus protocol
offering high-speed address based bus communication. After each address transaction, a
burst of data (max. 256 words) can be received. AXI4-Lite is similarly memory-mapped
bus protocol, but without any burst features. Finally, AXI4-Stream is an ultra-high speed](https://image.slidesharecdn.com/ae85dd04-08fc-4c3b-9c1d-305c86daa3ce-150905063655-lva1-app6891/85/Siirila_Antti_master_thesis_final_june_2015-51-320.jpg)
![44
streaming protocol which is not memory mapped. That is, a bus transaction over the
AXI4-Stream protocol does not require addressing. Hence, it is well suited for data
streaming.
5.1.2 Embedded System Design for Zynq Devices
In general, system development of a PSoC device requires a setup of the development
environment that provides tools for both hardware and software development as well as
the means for system prototyping. System design for Zynq is no different from the
previous one. Xilinx provides a development tool set called Vivado design suite to be
used with Zynq [60, p. 47]. The Vivado suite comprises the Vivado IDE for the hardware
design, Software Development Kit (SDK) for the Cortex-A9 programming, and
programming and debugging interfaces for the target devices or development boards.
Optionally, the Vivado suite also provides a High Level Synthesis (HLS) tool for
generating and testing IP blocks using only C-language. The HLS synthesises a C based
IP block into a Hardware Description Language (HDL) to be included in the hardware
design using the Vivado IDE. Another optional feature of the Vivado suite is the System
Generator which enables a system design to be done using graphical blocks in the
Mathwork’s Simulink environment [60, p. 241]. Moreover, a system, or a part of the
system, designed in the Simulink environment can be directly simulated on the hardware
via a procedure called co-hardware simulation. Finally, within the Vivado suite are also
delivered a documentation tool and a license management application. The Vivado design
suite is license based, and a stripped-down version of it can be freely obtained [63].
Design Flow
Vivado design flow follows the traditional development path, starting from the system
requirements and specifications phase, continuing to the system design phase, forking
into the hardware and software development, and terminating in the system integration
and testing phase [60, p. 53]. The design flow is unlikely to be a single pass-through
process of all the phases, but will more likely require several different iterations between
phases. Therefore, it is important that the design can be flexibly refined in each phase.](https://image.slidesharecdn.com/ae85dd04-08fc-4c3b-9c1d-305c86daa3ce-150905063655-lva1-app6891/85/Siirila_Antti_master_thesis_final_june_2015-52-320.jpg)
![45
Figure 5.4 The embedded system design flow for the Zynq.[60, p. 53]
Figure 5.4 visualises the system design flow of the Vivado suite. The purpose of the first
phase is to extract system parameters from the project requirements and formulate system
specifications based on those parameters. The system parameters should as accurately as
possible describe the end system. The second phase, the system specification phase,
further clarifies the system by describing the behaviour and functionality of the system.
In addition, the system specifications should contain system performance requirements,
definition of used technologies and other implementation details. Once the system is
specified, the actual system design phase may start.](https://image.slidesharecdn.com/ae85dd04-08fc-4c3b-9c1d-305c86daa3ce-150905063655-lva1-app6891/85/Siirila_Antti_master_thesis_final_june_2015-53-320.jpg)
![47
parameters. In conclusion, the evaluation of the test results reveals whether the final
system is either ready to be released or should be iterated back to a specific design phase
for further system refining.
Vivado IDE
Vivado IDE is a graphical development environment for Zynq hardware development
[64]. The Vivado IDE GUI facilitates the not so straightforward Command Line Interface
(CLI) for tcl-scripts. Despite that, the designer may freely choose to completely or
partially rely on CLI. The main concepts of Vivado IDE are the project and workflow.
The project contains the information on the target device and the board as well as the used
HDL language. The workflow is part of the project and divides the actual development
process into sequential development steps namely block design, simulation, synthesis,
implementation, and bit stream generation. The end product of the workflow is the
hardware base system file to be exported to SDK. The hardware base system contains the
required hardware parameters for SDK as well as the configuration bitstream for the
chosen Zynq device.
The workflow is visualized on Flow Navigator pane which provides an easy access to the
different development steps. The first step in the workflow is to graphically define the
Block Design (BD) of the system. BD is comprised of the reusable and reconfigurable IP
blocks and the interconnects between them. Vivado IDE has an inbuilt Xilinx library for
IP blocks. The library contains various commonly used hardware accelerator IP blocks.
The interconnection between the IP blocks generally occurs through one of the AXI4
specified interfaces. Which AXI4 protocol is used, depends on the IP block. The interface
and, in some cases, the internal functionality of the IP block can be further parameterised
to better meet the system requirements. For some interconnects, such as PS-PL ones,
Vivado IDE provides an automated connection wizard. The wizard adds an interconnect
IP block into BD and configures the interconnect between the chosen IP blocks.
A special IP block called Zynq7 processing system contains the hardware definitions for
the Zynq PS. Therefore, the Zynq7 processing system block is always required if the PS
side of Zynq is used in the system. The Zynq7 PS contains various configuration options
for customising PS. A designer can choose, for instance, what peripheral interfaces,
timers, clocks, interrupts and other features should be present in the system. Alternatively,](https://image.slidesharecdn.com/ae85dd04-08fc-4c3b-9c1d-305c86daa3ce-150905063655-lva1-app6891/85/Siirila_Antti_master_thesis_final_june_2015-55-320.jpg)
![49
programming tools for both, the PS and PL, and a software debugger. XSDK environment
is an extension of the well-known open source SDK of Eclipse [65].
The GUI look and feel of XSDK is familiar for the Eclipse. In addition to the standard
Eclipse, XSDK introduces the required AP SoC related concepts including the creation
of Hardware Platform (HP), Board Support Package (BSP) and Application Project (AP).
Figure 5.5 The layered software stack of SDK [60, p. 58].
The software system for a Zynq device is built on the Hardware Base System which is
created and exported in Vivado IDE. In XSDK, the Hardware Base System is referred to
HP. Figure 5.5 illustrates the stack-like structure. BSP functions as an intermediate layer
between OS layer and hardware. Its purpose is to provide the required hardware drivers
for OS to access PS resources as well as IP blocks on the PL side. The creation of a BSP
is an automated procedure in XSDK. The OS layer implements the operating system
which the embedded application relies on. For more complicated embedded systems
requiring multi-tasking and GUI services, the OS layer usually implements a full featured
Linux, Android, or similar embedded OS. Besides this and for simpler systems, a
standalone OS providing only some basic services can be implemented. Another
alternative for the OS layer is a bare metal system in which the OS layer is basically
omitted and the embedded application uses the BSP services directly. It should also be
mentioned that both of the ARM cores inside PS can be used to run an independent OS.
Finally, the actual embedded software application sits on top of the OS layer. The
application software is developed inside AP.
The layer approach allows the hardware base system to be flexibly changed under the
software stack. The only required action is to refresh the BSP layer. The refreshing is not](https://image.slidesharecdn.com/ae85dd04-08fc-4c3b-9c1d-305c86daa3ce-150905063655-lva1-app6891/85/Siirila_Antti_master_thesis_final_june_2015-57-320.jpg)
![50
required if the new Hardware Base System only contains changes in some IP internal
functionalities leaving the interconnection infrastructure untouched.
The software stack for the ARM processors as well as the hardware configuration of PL
can be programmed on the target device from XSDK via a JTAG connection or
alternatively over an Ethernet link [60, p. 60]. Another usage for the JTAG interface is
the remote software debugging. The base of the XSDK debugger is the Xilinx
Microprocessor Debugger (XMD). On top of that, XDSK includes the GNU Debugger
(GDB) with all common debugging features [66].
5.2 Development Boards
In this section, development boards used for the case study of this thesis are shortly
introduced. These boards include ZedBoard (a development and prototyping board for
Zynq from Avnet) [67], Arduino UNO (a Microcontroller (MCU) board from Arduino)
[68], and e-Health Sensor Platform from Cooking Hacks [69]. The common factor
between all these boards is that they provide community support and open source
examples for their devices. Receiving such support may sometimes be crucial for a
development project to succeed.
5.2.1 ZedBoard Evaluation and Development Kit
ZedBoard (Zed) implements the Xilinx XC7Z020-1CLG484C Zynq device with external
memory, physical interfaces, and a set of user interface devices [70]. Besides the physical
board, in the web there are active community based support and sample designs. On the
community pages, developers can share their ideas and projects, receive help for their
problems and also get access to example projects on various different applications.
ZedBoard contains of DDR memory connected to the DDR interface on PS of Zynq. The
DDR memory on Zed extends the PS memory capacity to 512 MBs. In addition, a flash
memory unit of 256 Mb connects to the SPI interface in the MIO bank 0. The non-volatile
flash memory can be used to boot up the PS system and also to hold the PL configuration.
Zed also provides connectors for all the communication interfaces of the Zynq device.
Ethernet and USB have dedicated connectors whereas the other serial communication
protocols are mapped to a digital PMOD connector that further connects to the MIO](https://image.slidesharecdn.com/ae85dd04-08fc-4c3b-9c1d-305c86daa3ce-150905063655-lva1-app6891/85/Siirila_Antti_master_thesis_final_june_2015-58-320.jpg)
![51
interface on PS. Exceptionally, one of the UARTs can optionally be routed via the USB
connector. For the JTAG interface, a dedicated mini-USB connector is provided. Zed also
provides HDMI and VGA connectors interfacing with EMIO on PL. In addition to PS
side PMOD, there are four more PMOD connectors connecting to IOB on the PL side.
The User Interface (UI) of Zed includes a 128x32 OLED display, 8 dipswitches and 7
push buttons. All these connect to IOBs on PL. In addition, Zed provides jacks for audio
lines in and out as well as for microphone and headphones. Some other features of Zed
include XADC header, SD card slot, and configuration jumpers.
5.2.2 Arduino Uno/e-Health Sensor Platform
Arduino Uno is a MCU board embedding the 8-bit ATmega328 microcontroller by Atmel
[71]. The e-Health Sensor Platform (eHSP) by Cooking Hacks is particularly designed to
sit on the Arduino (Figure 5.6) and to function as an Analogue Front End (AFE) for
various different e-Health applications such as ECG acquisition. The strength of both
boards is again the community support and vast selection of software libraries provided
by the community. That is what makes the boards so easy to approach and hence ideal for
rapid prototyping.
Figure 5.6 Arduino Uno and e-Health sensor platform v 1.0 boards [69].
Arduino Uno is a typical MCU board with easy-to-set-up development environment. In
addition, a vast amount of information on different features and examples of Arduino Uno
can easily be found and accessed in the web. Therefore, in this section the emphases is
on the analogue front end of the eHSP board.](https://image.slidesharecdn.com/ae85dd04-08fc-4c3b-9c1d-305c86daa3ce-150905063655-lva1-app6891/85/Siirila_Antti_master_thesis_final_june_2015-59-320.jpg)
![52
AFE of eHSP provides a Lead II ECG signal. Three electrodes are used for signal
acquisition and the acquired signal is pre-filtered in the analogue domain. The main
components of AFE are an INA321 instrumentation amplifier and an OPA4340U CMOS
operational amplifier chip by Texas Instrument. The AFE design is a modification of the
Texas Instruments’ application [72] adding some extra analogue filtering and a reference
electrode. The reference electrode sets the base line for ECG to 2.5 V from where the
positive range reaches up to 5 V and the negative down to 0 V.
The signals from the plus and minus electrodes are first fed to the differential amplifier
(INA1) as shown in Appendix I. INA1 cancels the voltages that express simultaneously
in both of the electrodes and amplifies the differential signals by a factor of five. The
output signal of INA1 then travels to the active inverting low pass filter (IC1D) and also
to the integrator circuit (IC1B). The IC1D filter has two functions. Firstly, it amplifies the
signal roughly 304 times (50 dBV), and secondly it works as an anti-aliasing filter in the
system. With the two amplifier circuits, the complete gain of AFE is around 64 dBV.
After IC1D, the signal is first buffered and then further filtered by passing it through the
second order low pass filter right before the output A0. The corner frequency of that low
pass filter is approximately 33 Hz.
The purpose of the IC1B integrator is to control the baseline wandering in the ECG output
[72]. It integrates the DC content present in the ECG signal, and feeds it back to INA1.
INA1 uses the feedback signal to maintain a steady DC level at the ECG output and hence
reduces the baseline wander.](https://image.slidesharecdn.com/ae85dd04-08fc-4c3b-9c1d-305c86daa3ce-150905063655-lva1-app6891/85/Siirila_Antti_master_thesis_final_june_2015-60-320.jpg)
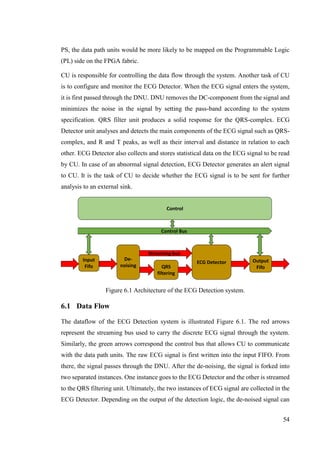
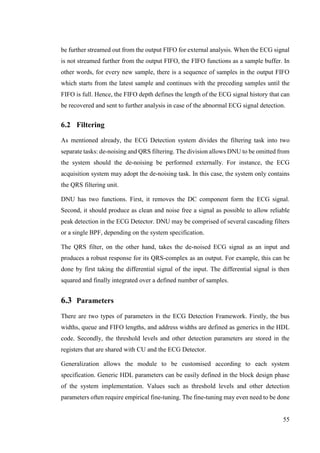
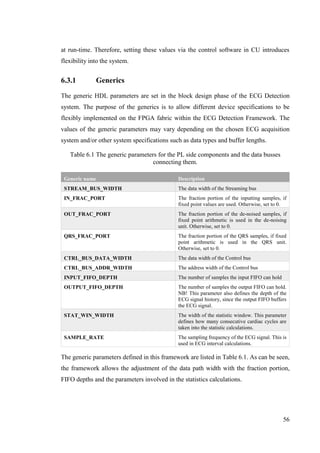
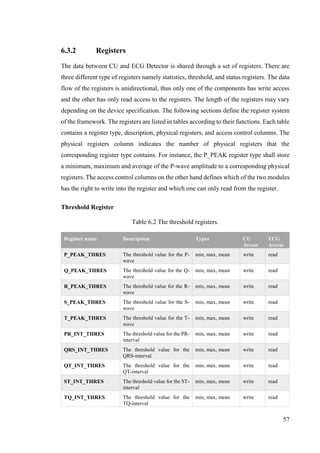
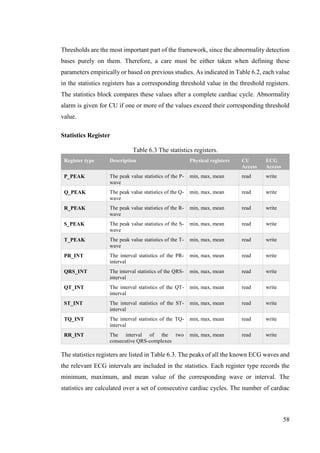
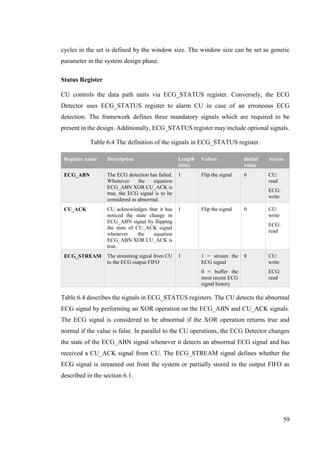
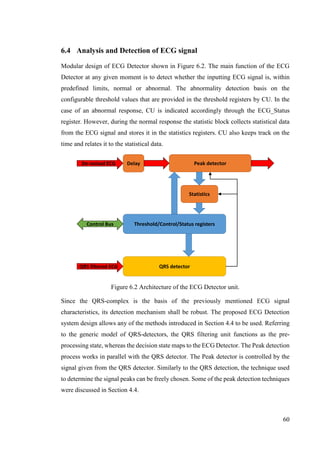
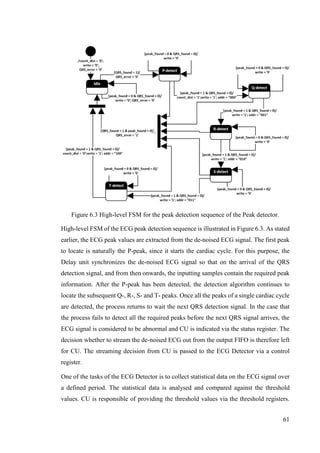
![62
The actual abnormality analysis is performed in the statistic unit. In the case of a threshold
overrun, the ECG_ABN signal is set in the ECG status register.
Figure 6.4 The queue structure of the extracted peak and interval values of ECG.
The Peak detector writes the amplitude of each detected peak to the statistic unit in real-
time. The statistic block stores these amplitude values in the cardiac cycle queues along
with the calculated interval values. The intervals calculation bases on the sample count
between relevant peaks. The cardiac cycle queue buffers a defined number of peaks and
intervals of a single cardiac cycle with the same index as shown in Figure 6.4. The length
of the queue determines the time window for the statistic calculations and can be
configured as a generic parameter in the block design phase. The statistic block extracts
the minimum, maximum and mean values from each queue and store these values in the
statistics registers whenever a complete cardiac cycle is detected. In other words, all peaks
PQRST from the Peak detector are successfully received. CU can read the values in the
statistics register via the Control bus.
The peak-counter resets whenever there is a new entry to the P-amplitude queue (Figure
6.3). The distance between two peaks is determined by calculating the sample difference
between the peak-counter values of the proper peaks. The ECG intervals are extracted
from these distances either directly or by adding a set of distances. The intervals are stored
P_PEAK
P_PEAK
P_PEAK
TQ_INT
TQ_INT
TQ_INT
X[n]
X[n-1]
X[n-2]
X[n-STAT_WIN]](https://image.slidesharecdn.com/ae85dd04-08fc-4c3b-9c1d-305c86daa3ce-150905063655-lva1-app6891/85/Siirila_Antti_master_thesis_final_june_2015-70-320.jpg)
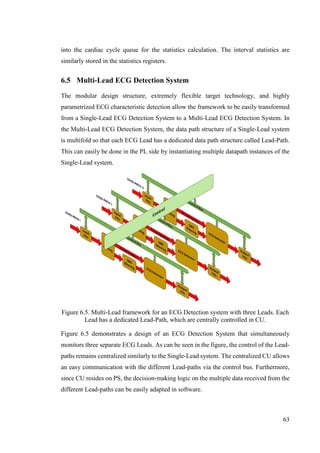
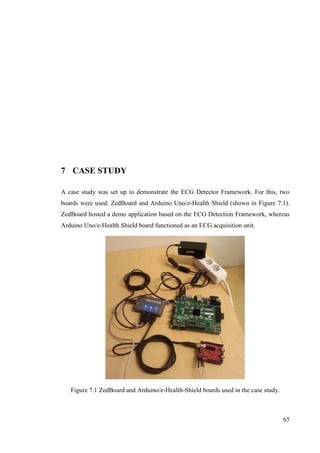
![66
ECG Detection application was implemented in Xilinx’s Vivado IDE. In this case study,
in addition to the application, a reusable and customisable IP block for the ECG Detector
unit was developed. Finally, for plotting purposes, a MatLab script on a laptop computer
was used to receive and plot various signals extracted from the ECG Detection
application.
Figure 7.2 High-level system architecture of the case study application.
High-level design of the case study application is shown in figure 7.2. The application
has three independent units: the ECG signal acquisition unit, ECG Detector unit and a
plotter unit. The communication between the units is done over a UART serial link.
The following features of ECG Detection Framework were demonstrated in this case
study: QRS-complex detection, wave detection, interval detection, statistic calculations
and abnormality detection. Implementation of the QRS-complex detection followed the
traditional Tompkins & Pan [49] QRS detection method. Wave, interval and abnormality
detections were performed for the R-wave. The statistical calculations were based on this
detection data and included: max/min/mean R-peak statistics, max/min/mean RR-interval
statistics and current heart rate. The abnormality detection was similarly based on R-wave
peak data matched against min/max threshold levels.
7.1 ECG Signal Acquisition
ECG signal acquisition unit acquires a single Lead analogue ECG signal through its three
electrodes. The signal is first pre-filtered in the analogue domain on the e-Health Sensor
Shield and then passed on to the Arduino Uno board through the A0 pin.
ECG Detection System
ECG AcquisitionPlotter](https://image.slidesharecdn.com/ae85dd04-08fc-4c3b-9c1d-305c86daa3ce-150905063655-lva1-app6891/85/Siirila_Antti_master_thesis_final_june_2015-74-320.jpg)
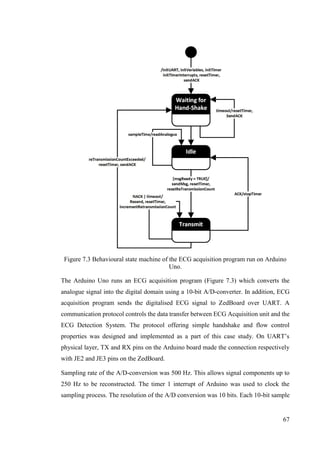
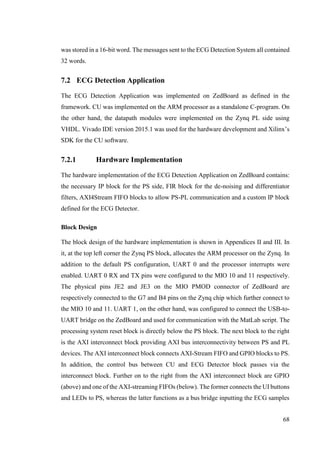
![70
The de-noising filter was specified as a band-pass filter (Figure 7.4). The first transition-
band from stop-band to pass-band starts at 0.000001 Hz, and ends to 1 Hz. Similarly, the
second transition-band, from pass-band to stop-band, starts at 45 Hz and ends at 45.99999
Hz. This set up gives a 3dB attenuation at 0.67 Hz and 45.32 Hz on left and right edges
of the pass-band respectively. The pass-band gain is 15dB and the filter order is 797.
Difference Filter
Figure 7.5 The magnitude response of the difference filter.
The difference filter specification was targeted for the frequencies forming the QRS-
complex. Therefore, the frequency vector in FDATool was set to [0 8 45 0] and magnitude
vector to [0 1 1 0]. The magnitude response shown in Figure 7.5 matches the QRS-
complex harmonics.
7.2.3 ECG Detector
The ECG Detector IP block implements all processes used in the QRS-complex, R-wave
and R-interval detection. In addition, the block contains the statistical calculations and
ECG abnormality detection processes. The ECG Detector IP block was developed in its
entirety as a part of this case study. Its source code as well as the tcl-script files for the
Vivado IDE project recreation are publicly available in the GitHub repository [73].](https://image.slidesharecdn.com/ae85dd04-08fc-4c3b-9c1d-305c86daa3ce-150905063655-lva1-app6891/85/Siirila_Antti_master_thesis_final_june_2015-78-320.jpg)
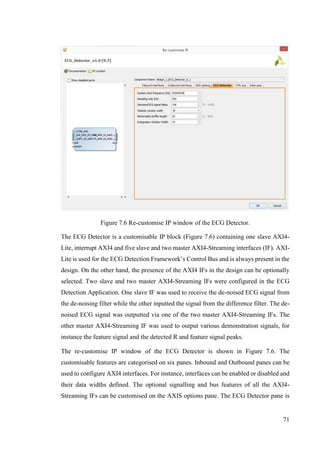
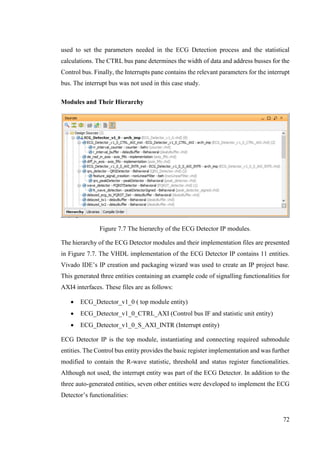
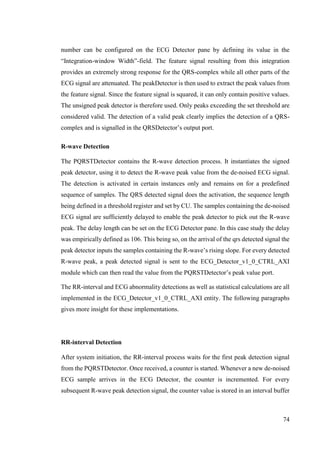
![77
to PL. After that it moves to sending state. Alternatively, if an arrow button on the
ZedBorad is pressed, the program terminates. In the sending state, the program waits until
all bytes are sent to PL. After that the program reads all status registers on CU. If an ECG
abnormality signal is received from the ECG Detector, the program flips the ECG
abnormality bit in the PS_STAT register while moving to the receiving state. Otherwise
the PS_STAT register is left untouched. The tasks executed during the transition from
receiving state back to active state depends on the ECG abnormality signal. If an ECG
abnormality signal has been received, the program forwards the received samples to the
MatLab script to be plotted. Otherwise, the received samples are dropped and the program
continues in the active state.
7.3 Results and Discussion
The ECG Detection application developed in this case study was used to acquired ECG
signals from the author’s heart. A set of signals from different phases of the ECG Detector
were plotted on MatLab. This section presents these results and discusses their relevance.
Figure 7.9 Placement of the electrodes during the ECG acquisition [69].
The ECG electrodes were placed on the author’s chest as illustrated in Figure 7.9. The
acquired ECG signals were measured in a sitting positon. To produce an abnormal ECG
signal response, one of the electrodes was tapped during the acquisition. The
configuration of the ECG Detector IP was set as shown in Figure 7.6.](https://image.slidesharecdn.com/ae85dd04-08fc-4c3b-9c1d-305c86daa3ce-150905063655-lva1-app6891/85/Siirila_Antti_master_thesis_final_june_2015-85-320.jpg)
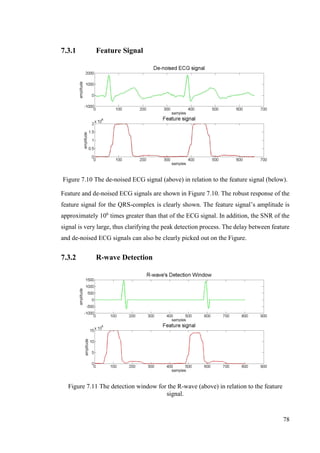

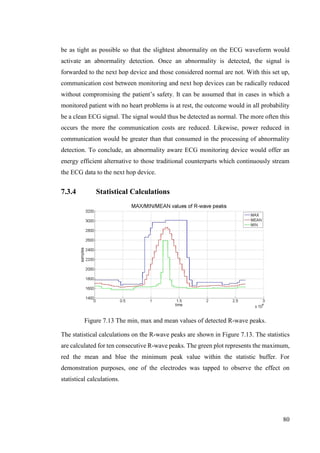
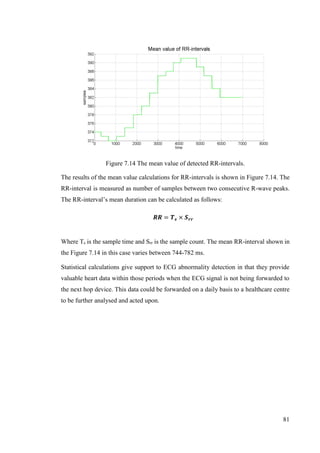
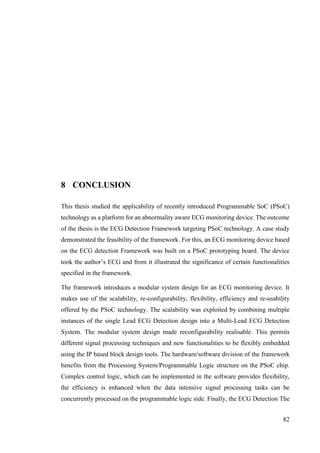
![83
framework introduces re-usability, since ECG monitoring devices with different
functionalities can be interchangeably implemented on the same physical PSoC chip.
A detection mechanism for recognizing abnormal ECG signals was also defined in the
ECG Detection Framework. It is suggested that this detection mechanism could also be
used to reduce overall communication costs between the ECG monitoring and next hop
devices. ECG abnormality detection demands concurrent and efficient signal processing.
PSoC shows its potential in this area. The proposed ECG Detection Framework provides
the means to better match these demands with the resources offered.
The case study results show that an ECG monitoring device based on the proposed ECG
Detection Framework can be successfully implemented on PSoC technology. In addition,
the basic mechanisms for detecting abnormal ECG signals were demonstrated
successfully. Finally, a customisable ECG Detector IP block for Vivado IDE was
developed as part of the case study implementation The IP block can be used as a starting
point for future work on this topic.
It would be useful to explore the possibilities provided by the partial re-configuration
feature of PSoC [74]. This could improve the framework’s capacity to better adapt to a
variety of different situations. In addition, it would be worthwhile studying how the
framework could benefit from Discrete Wavelet Transform based filtering techniques,
thus improving the de-noising and detection mechanisms.
All in all, the ECG Detection Framework has the potential to function as an blueprint for
intelligent, low cost, energy efficient, small sized, and portable ECG monitoring devices.
Such devices have a significantly important role in providing the reliable and selective
data transfer for the healthcare centre of the future.](https://image.slidesharecdn.com/ae85dd04-08fc-4c3b-9c1d-305c86daa3ce-150905063655-lva1-app6891/85/Siirila_Antti_master_thesis_final_june_2015-91-320.jpg)
![84
REFERENCES
[1] World Health Organisation, “WHO | Active ageing: a policy framework,”
pp. 1–60, 2002.
[2] WHO, “WHO | Global health and ageing,” 2011.
[3] European Commission, “eHealth Action Plan 2012-2020: Innovative
healthcare for the 21st century | Digital Agenda for Europe | European
Commission,” 2012.
[4] D. Mozaffarian, E. J. Benjamin, A. S. Go, D. K. Arnett, M. J. Blaha, M.
Cushman, S. de Ferranti, J.-P. Després, H. J. Fullerton, V. J. Howard, M.
D. Huffman, S. E. Judd, B. M. Kissela, D. T. Lackland, J. H. Lichtman, L.
D. Lisabeth, S. Liu, R. H. Mackey, D. B. Matchar, D. K. McGuire, E. R.
Mohler, C. S. Moy, P. Muntner, M. E. Mussolino, K. Nasir, R. W. Neumar,
G. Nichol, L. Palaniappan, D. K. Pandey, M. J. Reeves, C. J. Rodriguez,
P. D. Sorlie, J. Stein, A. Towfighi, T. N. Turan, S. S. Virani, J. Z. Willey, D.
Woo, R. W. Yeh, and M. B. Turner, “Heart Disease and Stroke Statistics-
2015 Update: A Report From the American Heart Association.,”
Circulation, vol. 131, no. 4, pp. e29–322, Dec. 2014.
[5] C. T. C. Lien, N. D. Gillespie, A. D. Struthers, and M. E. T. McMurdo,
“Heart failure in frail elderly patients: diagnostic difficulties, co-morbidities,
polypharmacy and treatment dilemmas.,” Eur. J. Heart Fail., vol. 4, no. 1,
pp. 91–8, Jan. 2002.
[6] M. M. Baig, H. Gholamhosseini, and M. J. Connolly, “A comprehensive
survey of wearable and wireless ECG monitoring systems for older
adults,” Med. Biol. Eng. Comput., vol. 51, no. 5, pp. 485–495, 2013.
[7] R. H. Whitaker, “Anatomy of the heart,” Med. (United Kingdom), vol. 42,
no. 8, pp. 406–408, 2014.
[8] L. (Interactive B. Samuel, “Show me a diagram of the human heart? Here
are a bunch!,” 2009. [Online]. Available: http://www.interactive-
biology.com/75/show-me-a-diagram-of-the-human-heart-here-are-a-
bunch/.
[9] A. L. Hodgkin and A. F. Huxley, “A quantitative description of membrane
current and its application to conduction and excitation in nerve,” Bull.
Math. Biol., vol. 52, no. 1–2, pp. 25–71, 1952.](https://image.slidesharecdn.com/ae85dd04-08fc-4c3b-9c1d-305c86daa3ce-150905063655-lva1-app6891/85/Siirila_Antti_master_thesis_final_june_2015-92-320.jpg)
![85
[10] H. Lodish, A. Berk, S. L. Zipursky, P. Matsudaira, D. Baltimore, and J.
Darnell, “Intracellular Ion Environment and Membrane Electric Potential,”
in Molecular Cell Biology. 4th edition., W. H. Freeman, 2000.
[11] H. Lodish, A. Berk, S. L. Zipursky, P. Matsudaira, D. Baltimore, and J.
Darnell, “The Action Potential and Conduction of Electric Impulses,” in
Molecular Cell Biology. 4th edition., W. H. Freeman, 2000.
[12] R. Rapila, T. Korhonen, and P. Tavi, “Excitation-contraction coupling of
the mouse embryonic cardiomyocyte.,” J. Gen. Physiol., vol. 132, no. 4,
pp. 397–405, Oct. 2008.
[13] R. H. Anderson, J. Yanni, M. R. Boyett, N. J. Chandler, and H.
Dobrzynski, “The anatomy of the cardiac conduction system,” Clinical
Anatomy, vol. 22, no. 1. pp. 99–113, 2009.
[14] C. Uy and E. Wong, “Cardiac conduction system,” MCMaster
Patophysiology Review, 2013. [Online]. Available:
http://www.pathophys.org/wp-content/uploads/2013/10/Heart-Conduction-
Colour.png.
[15] H. Dobrzynski, M. R. Boyett, and R. H. Anderson, “New insights into
pacemaker activity: promoting understanding of sick sinus syndrome.,”
Circulation, vol. 115, no. 14, pp. 1921–32, Apr. 2007.
[16] A. O. Verkerk, R. Wilders, M. M. G. J. van Borren, R. J. G. Peters, E.
Broekhuis, K. Lam, R. Coronel, J. M. T. de Bakker, and H. L. Tan,
“Pacemaker current (I(f)) in the human sinoatrial node.,” Eur. Heart J., vol.
28, no. 20, pp. 2472–8, Oct. 2007.
[17] G. J. Amos, E. Wettwer, F. Metzger, Q. Li, H. M. Himmel, and U. Ravens,
“Differences between outward currents of human atrial and subepicardial
ventricular myocytes.,” J. Physiol., vol. 491 ( Pt 1, pp. 31–50, 1996.
[18] P. Denes, W. Delon, R. Dhingra, R. J. Pietras, and K. M. Rosen, “The
Effects of Cycle Length on Cardiac Refractory Periods in Man,” 1974.
[Online]. Available: http://circ.ahajournals.org/content/49/1/32.full.pdf.
[Accessed: 17-Mar-2015].
[19] R. F. Baltazar, “Basic Electrocardiography,” in Basic and Bedside
Electrocardiography, Lippincott Williams & Wilkins, 2012, p. 9.
[20] W. (Huygens I.-R. N. A. of A. and S. (KNAW)) Einthoven, “The string-
galvanometer and the human electrocardiogram,” Proc. R. Netherlands
Acad. Arts Sci., vol. 6, p. 9, 1904.
[21] N. J. Ashley EA, “Conquering the ECG,” in Cardiology Explained.,
London: Remedica, 2004.](https://image.slidesharecdn.com/ae85dd04-08fc-4c3b-9c1d-305c86daa3ce-150905063655-lva1-app6891/85/Siirila_Antti_master_thesis_final_june_2015-93-320.jpg)
![86
[22] S. S. Barold, “Willem Einthoven and the Birth of Clinical
Electrocardiography a Hundred Years Ago,” Card. Electrophysiol. Rev.,
vol. 7, no. 1, pp. 99–104, 2003.
[23] E. Z. Soliman, “Recording electrocardiograms using 3-limb lead cables
instead of the standard 4: a modification to minimize incorrect electrode
placements.,” J. Electrocardiol., vol. 41, no. 5, pp. 391–2, Jan. 2008.
[24] EMTResource.com, “12-Lead ECG Placement,” 2014. [Online]. Available:
http://www.emtresource.com/resources/ecg/12-lead-ecg-placement/.
[Accessed: 12-Mar-2015].
[25] R. E. Klabunde, “CV Physiology: Ventricular Depolarization and the Mean
Electrical Axis,” 2007. [Online]. Available:
http://www.cvphysiology.com/Arrhythmias/A016.htm. [Accessed: 18-Mar-
2015].
[26] Lippincott, Williams, and Williams, ECG Interpretation. Lippincott Williams
& Wilkins, 2007.
[27] Y. Sun, J. Tao, G. Wu, and X. Yu, “A non-contact wearable wireless body
sensor network for multiple vital signal detection,” in 2013 IEEE
SENSORS, 2013, pp. 1–4.
[28] E. Sardini, M. Serpelloni, and M. Ometto, “Multi-parameters wireless shirt
for physiological monitoring,” in 2011 IEEE International Symposium on
Medical Measurements and Applications, 2011, pp. 316–321.
[29] E. Nemati, M. Deen, and T. Mondal, “A wireless wearable ECG sensor for
long-term applications,” IEEE Commun. Mag., vol. 50, no. 1, pp. 36–43,
Jan. 2012.
[30] Y. Yama, A. Ueno, and Y. Uchikawa, “Development of a wireless
capacitive sensor for ambulatory ECG monitoring over clothes.,” Conf.
Proc. ... Annu. Int. Conf. IEEE Eng. Med. Biol. Soc. IEEE Eng. Med. Biol.
Soc. Annu. Conf., vol. 2007, pp. 5728–31, Jan. 2007.
[31] D. (Wikimedia) Chang and Q. Destiny, “Wiggers Diagram,” Wikipedia,
2011. [Online]. Available:
http://commons.wikimedia.org/wiki/File:Wiggers_Diagram.png#mediaview
er/File:Wiggers_Diagram.png.
[32] M. J. Janse, “Activation of the Heart,” in Comprehensive
Electrocardiology, Volume 4, vol. 5, Springer Science & Business Media,
2010, pp. 145–166.](https://image.slidesharecdn.com/ae85dd04-08fc-4c3b-9c1d-305c86daa3ce-150905063655-lva1-app6891/85/Siirila_Antti_master_thesis_final_june_2015-94-320.jpg)
![87
[33] S. M. Lobodzinski, “ECG Instrumentation: Application and Design,” in
Comprehensive Electrocardiology, Volume 4, vol. 5, Springer Science &
Business Media, 2010, p. 2291.
[34] D. G. Manolakis and V. K. Ingle, Applied Digital Signal Processing:
Theory and Practice, vol. 21. Cambridge University Press, 2011.
[35] R. Sarpeshkar, “Analog versus digital: extrapolating from electronics to
neurobiology.,” Neural Comput., vol. 10, no. 7, pp. 1601–38, Oct. 1998.
[36] F. Buendía-Fuentes, M. A. Arnau-Vives, A. Arnau-Vives, J. Jiménez-
Jiménez, Y. Rueda-Soriano, E. Zorio-Grima, A. Osa-Sáez, L. V. Martínez-
Dolz, L. Almenar-Bonet, and M. A. Palencia-Pérez, “High-Bandpass
Filters in Electrocardiography: Source of Error in the Interpretation of the
ST Segment,” ISRN Cardiol., vol. 2012, p. 10, 2012.
[37] J. W. Mason, E. W. Hancock, and L. S. Gettes, “Recommendations for
the standardization and interpretation of the electrocardiogram,” Heart
Rhythm, vol. 4, no. 3. pp. 413–419, 2007.
[38] F. Castells, P. Laguna, L. Sörnmo, A. Bollmann, and J. M. Roig, “Principal
component analysis in ECG signal processing,” EURASIP J. Adv. Signal
Process., vol. 2007, 2007.
[39] A. (Cypres S. C. . Bharadwaj and U. (Cypress S. C. . Kamath,
“Techniques for accurate ECG signal processing | EE Times,” 2011.
[Online]. Available:
http://www.eetimes.com/document.asp?doc_id=1278571. [Accessed: 31-
Mar-2015].
[40] S. C. Douglas, “Introduction to Adaptive Filters,” in Digital Signal
Processing Handbook, K. M. Vijay and B. W. Douglas, Eds. CRC Press
LLC, 1999.
[41] M. Vetterli and C. Herley, “Wavelets and filter banks: theory and design,”
IEEE Trans. Signal Process., vol. 40, no. 9, pp. 2207–2232, 1992.
[42] B. Chandrakar, O. P. Yadav, and V. K. Chandra, “A survey of Noise
Removal Techniques For ECG Signals,” 2013. [Online]. Available:
http://www.ijarcce.com/upload/2013/march/8-bhumika Chandrakar - a
survey of noise-c.pdf. [Accessed: 07-Apr-2015].
[43] J.-W. Lee and G.-K. Lee, “Design of an Adaptive Filter with a Dynamic
Structure for ECG Signal Processing,” Int. J. Control. Autom. Syst., vol. 3,
no. 1, p. 6, 2005.](https://image.slidesharecdn.com/ae85dd04-08fc-4c3b-9c1d-305c86daa3ce-150905063655-lva1-app6891/85/Siirila_Antti_master_thesis_final_june_2015-95-320.jpg)
![88
[44] S. Gujeet and K. Ranjit, “Removal of EMG Interference from
Electrocardiogram Using Back Propagation,” Int. J. Innov. Res. Comput.
Commun. Eng., vol. 1, no. 6, pp. 1300–1305, 2013.
[45] K. T. Sweeney, T. E. Ward, and S. F. McLoone, “Artifact removal in
physiological signals--practices and possibilities.,” IEEE Trans. Inf.
Technol. Biomed., vol. 16, no. 3, pp. 488–500, May 2012.
[46] F. Scholkmann, J. Boss, and M. Wolf, “An Efficient Algorithm for
Automatic Peak Detection in Noisy Periodic and Quasi-Periodic Signals,”
Algorithms, vol. 5, no. 4, pp. 588–603, Nov. 2012.
[47] B.-U. Kohler, C. Hennig, and R. Orglmeister, “The principles of software
QRS detection,” IEEE Eng. Med. Biol. Mag., vol. 21, no. 1, pp. 42–57,
2002.
[48] R. J. Martis, U. R. Acharya, and H. Adeli, “Current methods in
electrocardiogram characterization,” Computers in Biology and Medicine,
vol. 48, no. 1. Elsevier Ltd, pp. 133–149, 2014.
[49] J. Pan and W. J. Tompkins, “A real-time QRS detection algorithm.,” IEEE
Trans. Biomed. Eng., vol. 32, no. 3, pp. 230–6, Mar. 1985.
[50] P. S. Hamilton and W. J. Tompkins, “Quantitative Investigation of QRS
Detection Rules Using the MIT/BIH Arrhythmia Database,” IEEE Trans.
Biomed. Eng., vol. BME-33, no. 12, pp. 1157–1165, Dec. 1986.
[51] J. S. Sahambi, S. N. Tandon, and R. K. P. Bhatt, “Using wavelet
transforms for ECG characterization. An on-line digital signal processing
system,” IEEE Eng. Med. Biol. Mag., vol. 16, no. 1, pp. 77–83, 1997.
[52] Xilinx, “Zynq-7000 All Programmable SoC,” 2015. [Online]. Available:
http://www.xilinx.com/products/silicon-devices/soc/zynq-7000.html.
[Accessed: 20-Apr-2015].
[53] Altera, “SoCs - Overview,” 2015. [Online]. Available:
https://www.altera.com/products/soc/overview.highResolutionDisplay.html
. [Accessed: 23-Apr-2015].
[54] Cypress, “Programmable System - on - Chip - Cypress,” 2015. [Online].
Available: http://www.cypress.com/psoc/?source=CY-ENG-HEADER.
[Accessed: 23-Apr-2015].
[55] W. Wong, “Understanding FPGA Processor Interconnects,” Electronic
Design, 2012. [Online]. Available:
http://electronicdesign.com/fpgas/understanding-fpga-processor-
interconnects. [Accessed: 23-Apr-2015].](https://image.slidesharecdn.com/ae85dd04-08fc-4c3b-9c1d-305c86daa3ce-150905063655-lva1-app6891/85/Siirila_Antti_master_thesis_final_june_2015-96-320.jpg)
![89
[56] ARM, “ARM Information Center: AMBA,” 2014. [Online]. Available:
http://infocenter.arm.com/help/index.jsp?topic=/com.arm.doc.set.amba/ind
ex.html. [Accessed: 23-Apr-2015].
[57] S. M. Trimberger, “Three Ages of FPGAs: A Retrospective on the First
Thirty Years of FPGA Technology,” Proc. IEEE, vol. 103, no. 3, pp. 318–
331, Mar. 2015.
[58] Xilinx, “Zynq-7000 All Programmable SoC Overview,” 2014.
[59] Xilinx, “Zynq-7000 AP SoCs Product Table,” 2014. [Online]. Available:
http://www.xilinx.com/publications/prod_mktg/zynq7000/Zynq-7000-
combined-product-table.pdf. [Accessed: 24-Apr-2015].
[60] L. Crockett, R. Elliot, M. Enderwitz, and B. Stewart, The Zynq Book. 2014.
[61] ARM, “Cortex-A9 series processors,” 2010. [Online]. Available:
http://infocenter.arm.com/help/index.jsp?topic=/com.arm.doc.subset.corte
xa.a9/index.html. [Accessed: 24-Apr-2015].
[62] Xilinx, “7-Series Documentation,” 2014. [Online]. Available:
http://www.xilinx.com/support/index.html/content/xilinx/en/supportNav/silic
on_devices/fpga/num-7-series.html. [Accessed: 24-Apr-2015].
[63] Xilinx, “Vivado Design Suite Evaluation and WebPACK,” 2015. [Online].
Available: http://www.xilinx.com/products/design_tools/vivado/vivado-
webpack.htm. [Accessed: 27-Apr-2015].
[64] Xilinx, “Xilinx Vivado Design Suite User Guide,” 2013. [Online]. Available:
http://www.xilinx.com/support/documentation/sw_manuals/xilinx2013_3/u
g994-vivado-ip-subsystems.pdf. [Accessed: 30-Apr-2015].
[65] Eclipse, “Eclipse - The Eclipse Foundation open source community
website.,” 2015. [Online]. Available: https://eclipse.org/. [Accessed: 30-
Apr-2015].
[66] GDB-Developppers, “GDB: The GNU Project Debugger,” 2015. [Online].
Available: http://www.gnu.org/software/gdb/. [Accessed: 30-Apr-2015].
[67] Avnet, “Zedboard.” [Online]. Available:
http://zedboard.org/product/zedboard. [Accessed: 23-Apr-2015].
[68] Arduino, “Arduino - ArduinoBoardUno,” 2015. [Online]. Available:
http://www.arduino.cc/en/Main/ArduinoBoardUno. [Accessed: 30-Apr-
2015].
[69] CoockingHacks, “e-Health Sensor Platform for Arduino and Raspberry Pi
[Biometric / Medical Applications].” [Online]. Available:](https://image.slidesharecdn.com/ae85dd04-08fc-4c3b-9c1d-305c86daa3ce-150905063655-lva1-app6891/85/Siirila_Antti_master_thesis_final_june_2015-97-320.jpg)
![90
http://www.cooking-hacks.com/documentation/tutorials/ehealth-v1-
biometric-sensor-platform-arduino-raspberry-pi-medical/.
[70] Avnet, “ZedBoard HW Guide.” 2012.
[71] AVR, “ATmega48PA/88PA/168PA/328P - datasheet,” 2009.
[72] R. Murugavel, “Heart-Rate and EKG Monitor Using the MSP430FG439,”
2007.
[73] A. Siirilä, “ECG Detection Framework - Source code of the Case Study,”
GitHub Repository, 2015. [Online]. Available:
https://github.com/anjosi/Thesis.
[74] D. Dye, “Xilinx WP374 Partial Reconfiguration of Xilinx FPGAs Using ISE
Design Suite, White Paper.”](https://image.slidesharecdn.com/ae85dd04-08fc-4c3b-9c1d-305c86daa3ce-150905063655-lva1-app6891/85/Siirila_Antti_master_thesis_final_june_2015-98-320.jpg)
![A
APPENDIX I: Schematics
Analogue Front End of ECG signal acquisition on e-Health Sensor Shield v1.0 [69]](https://image.slidesharecdn.com/ae85dd04-08fc-4c3b-9c1d-305c86daa3ce-150905063655-lva1-app6891/85/Siirila_Antti_master_thesis_final_june_2015-99-320.jpg)
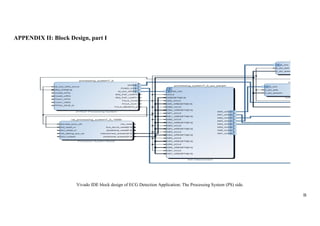
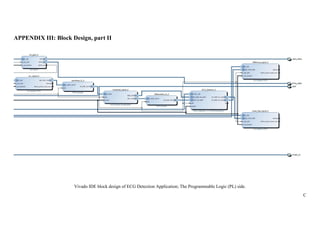


![[WeFocus] 모바일헬스케어심포지엄_김성현_20171121_v1](https://cdn.slidesharecdn.com/ss_thumbnails/blt20171121v1-171120104109-thumbnail.jpg?width=640&height=640&fit=bounds)