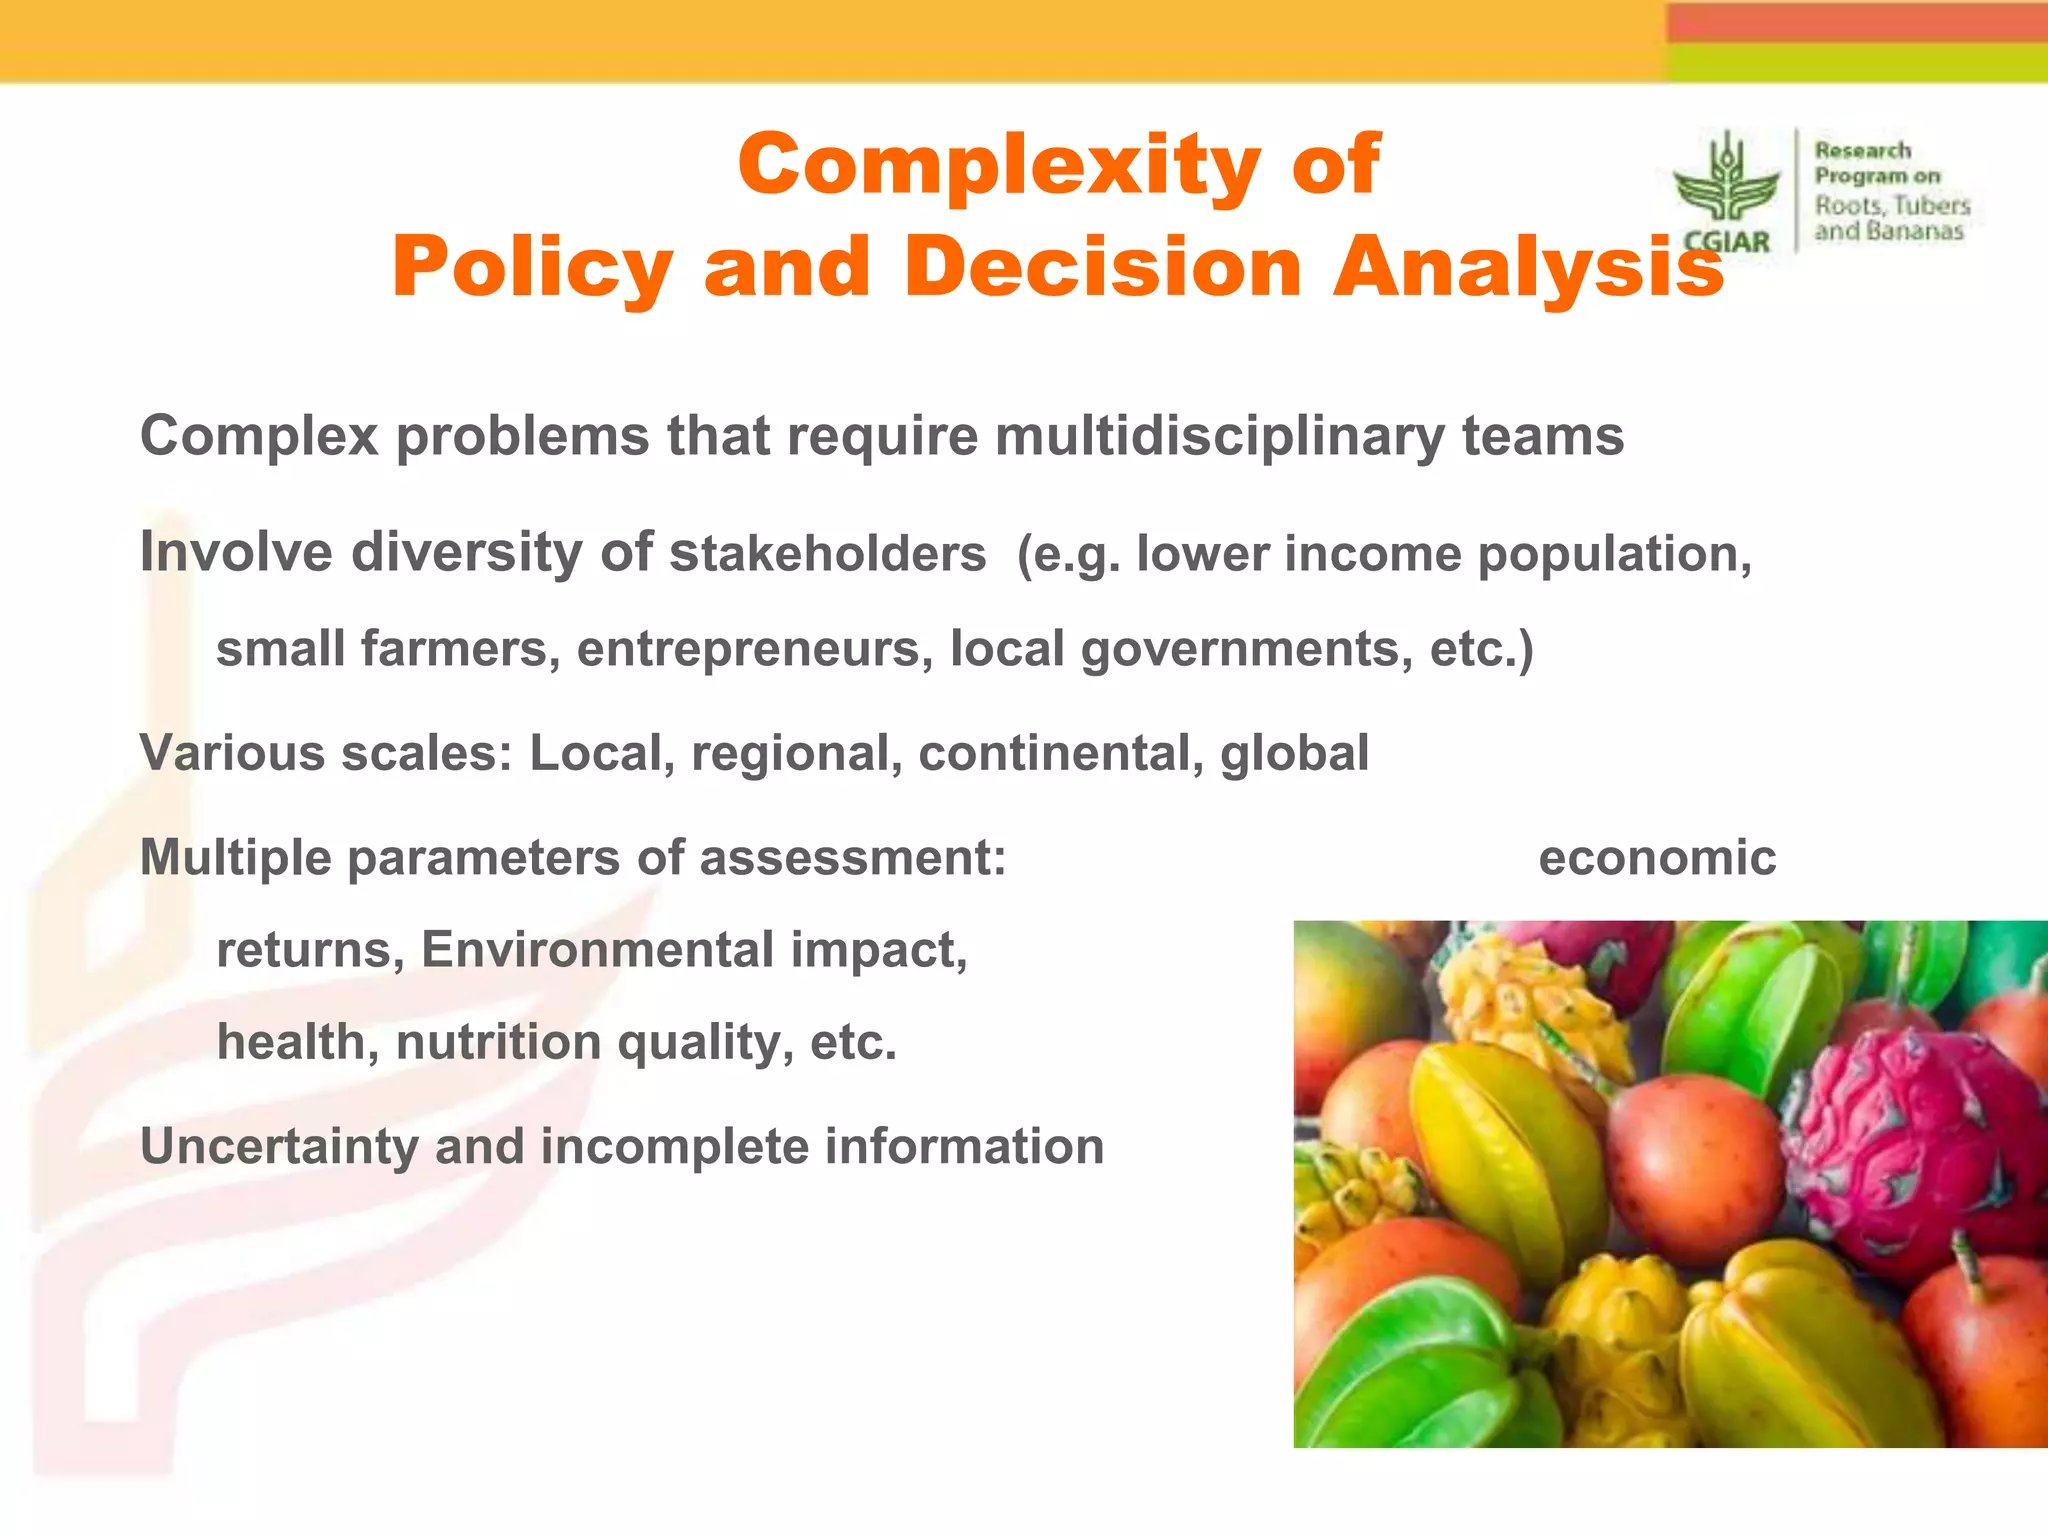
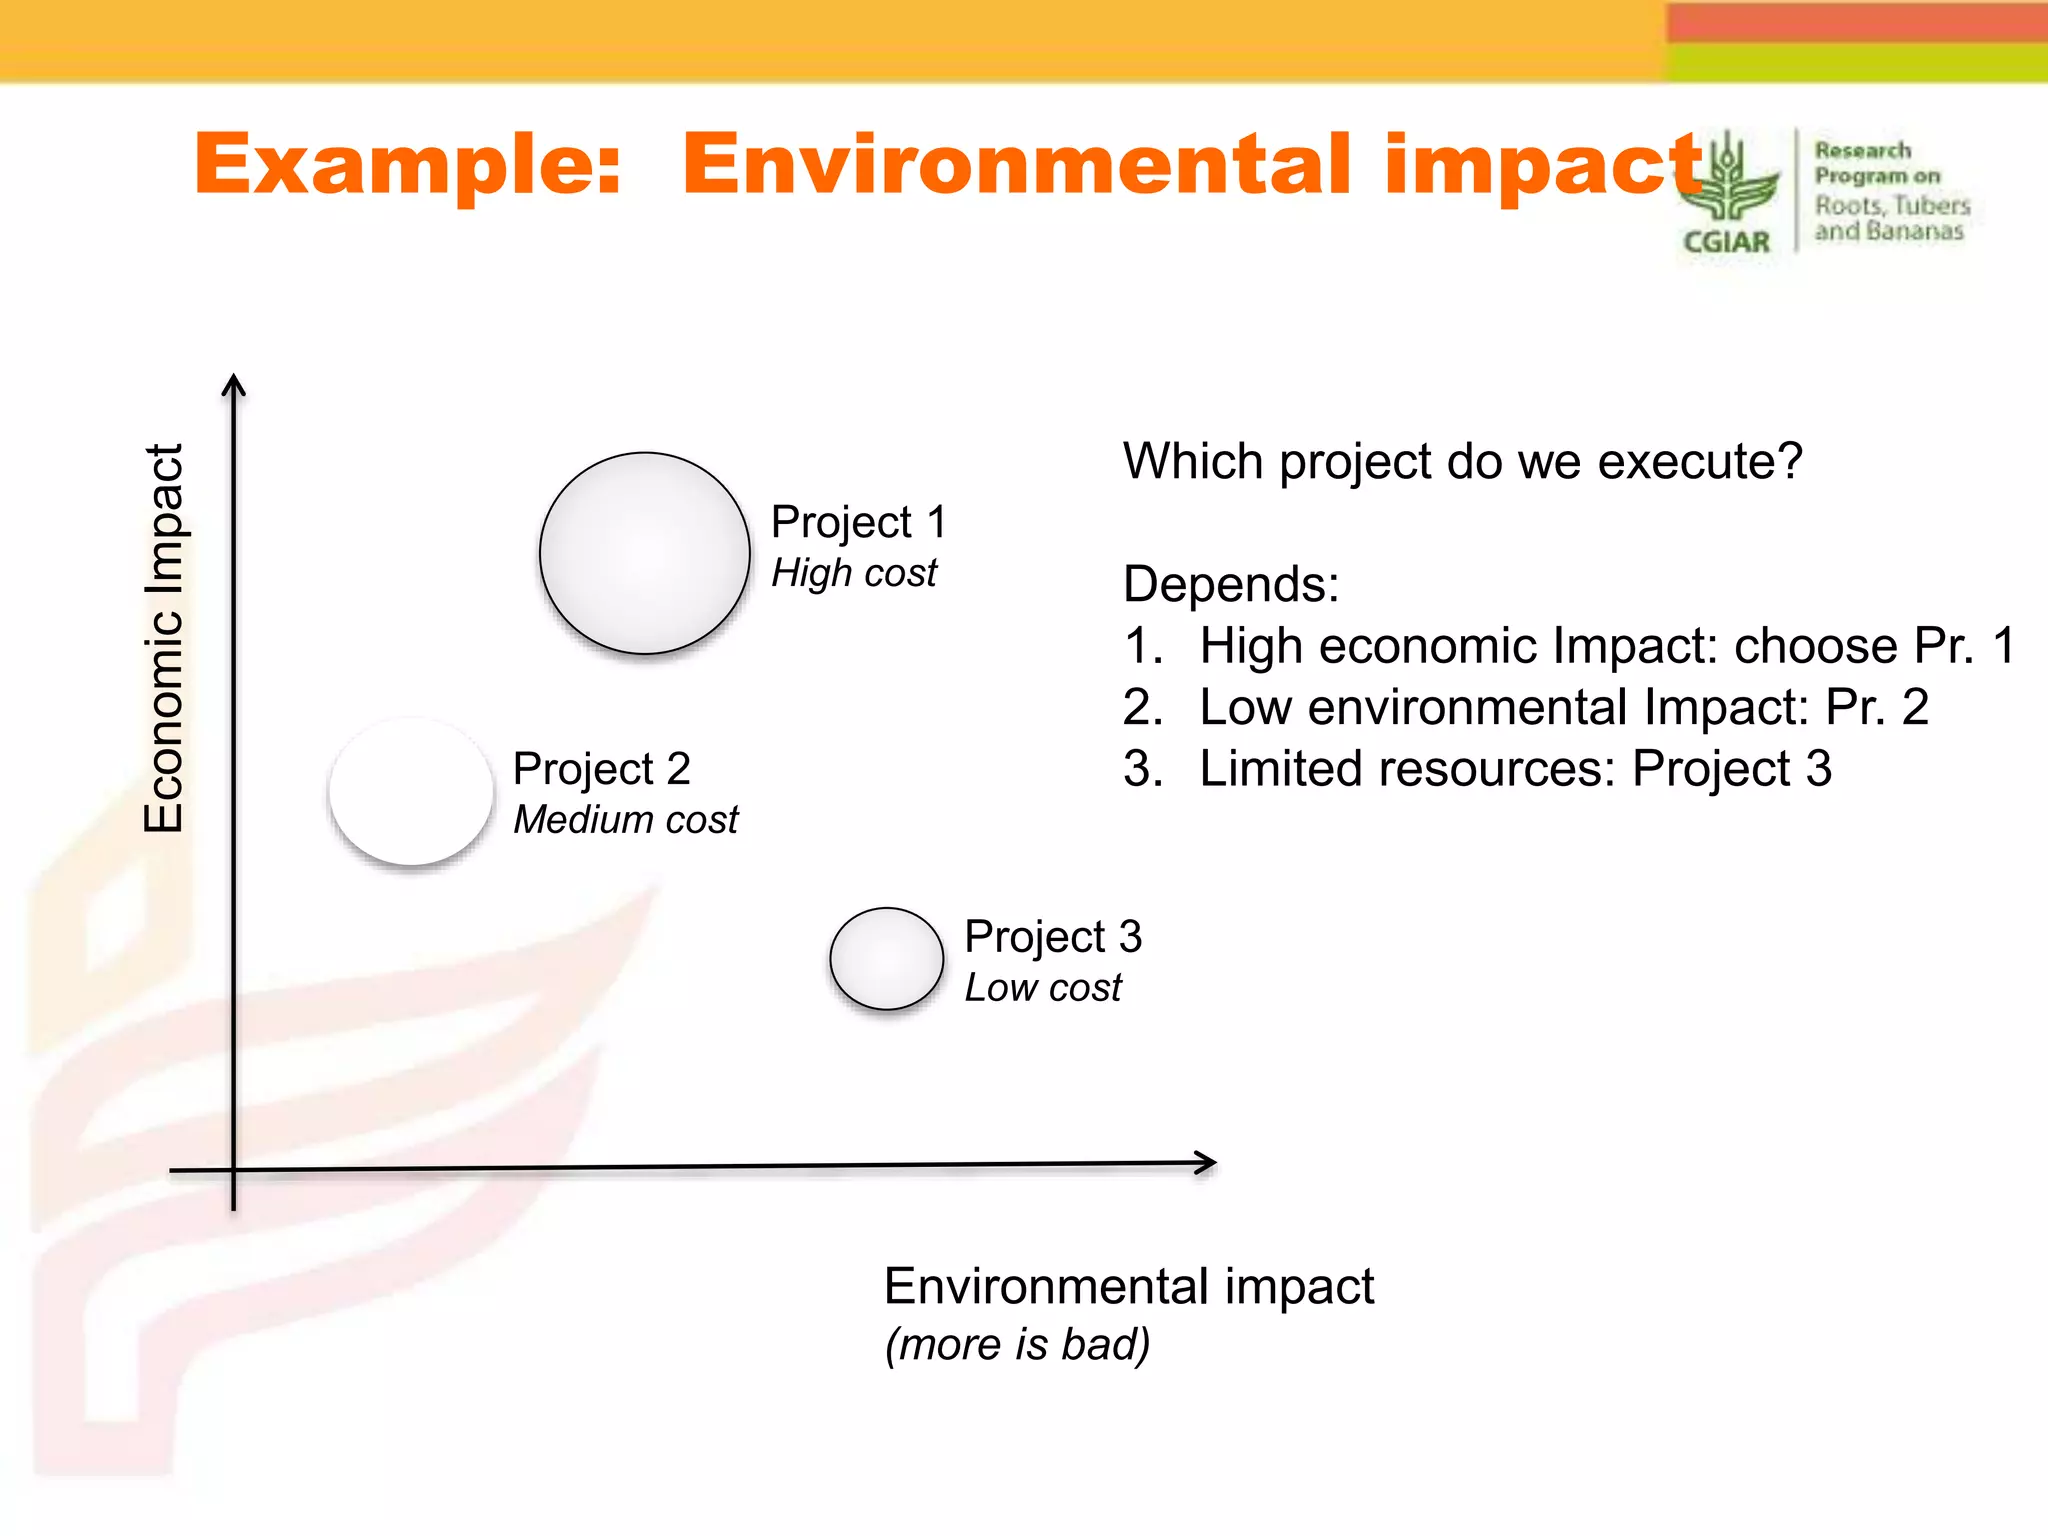
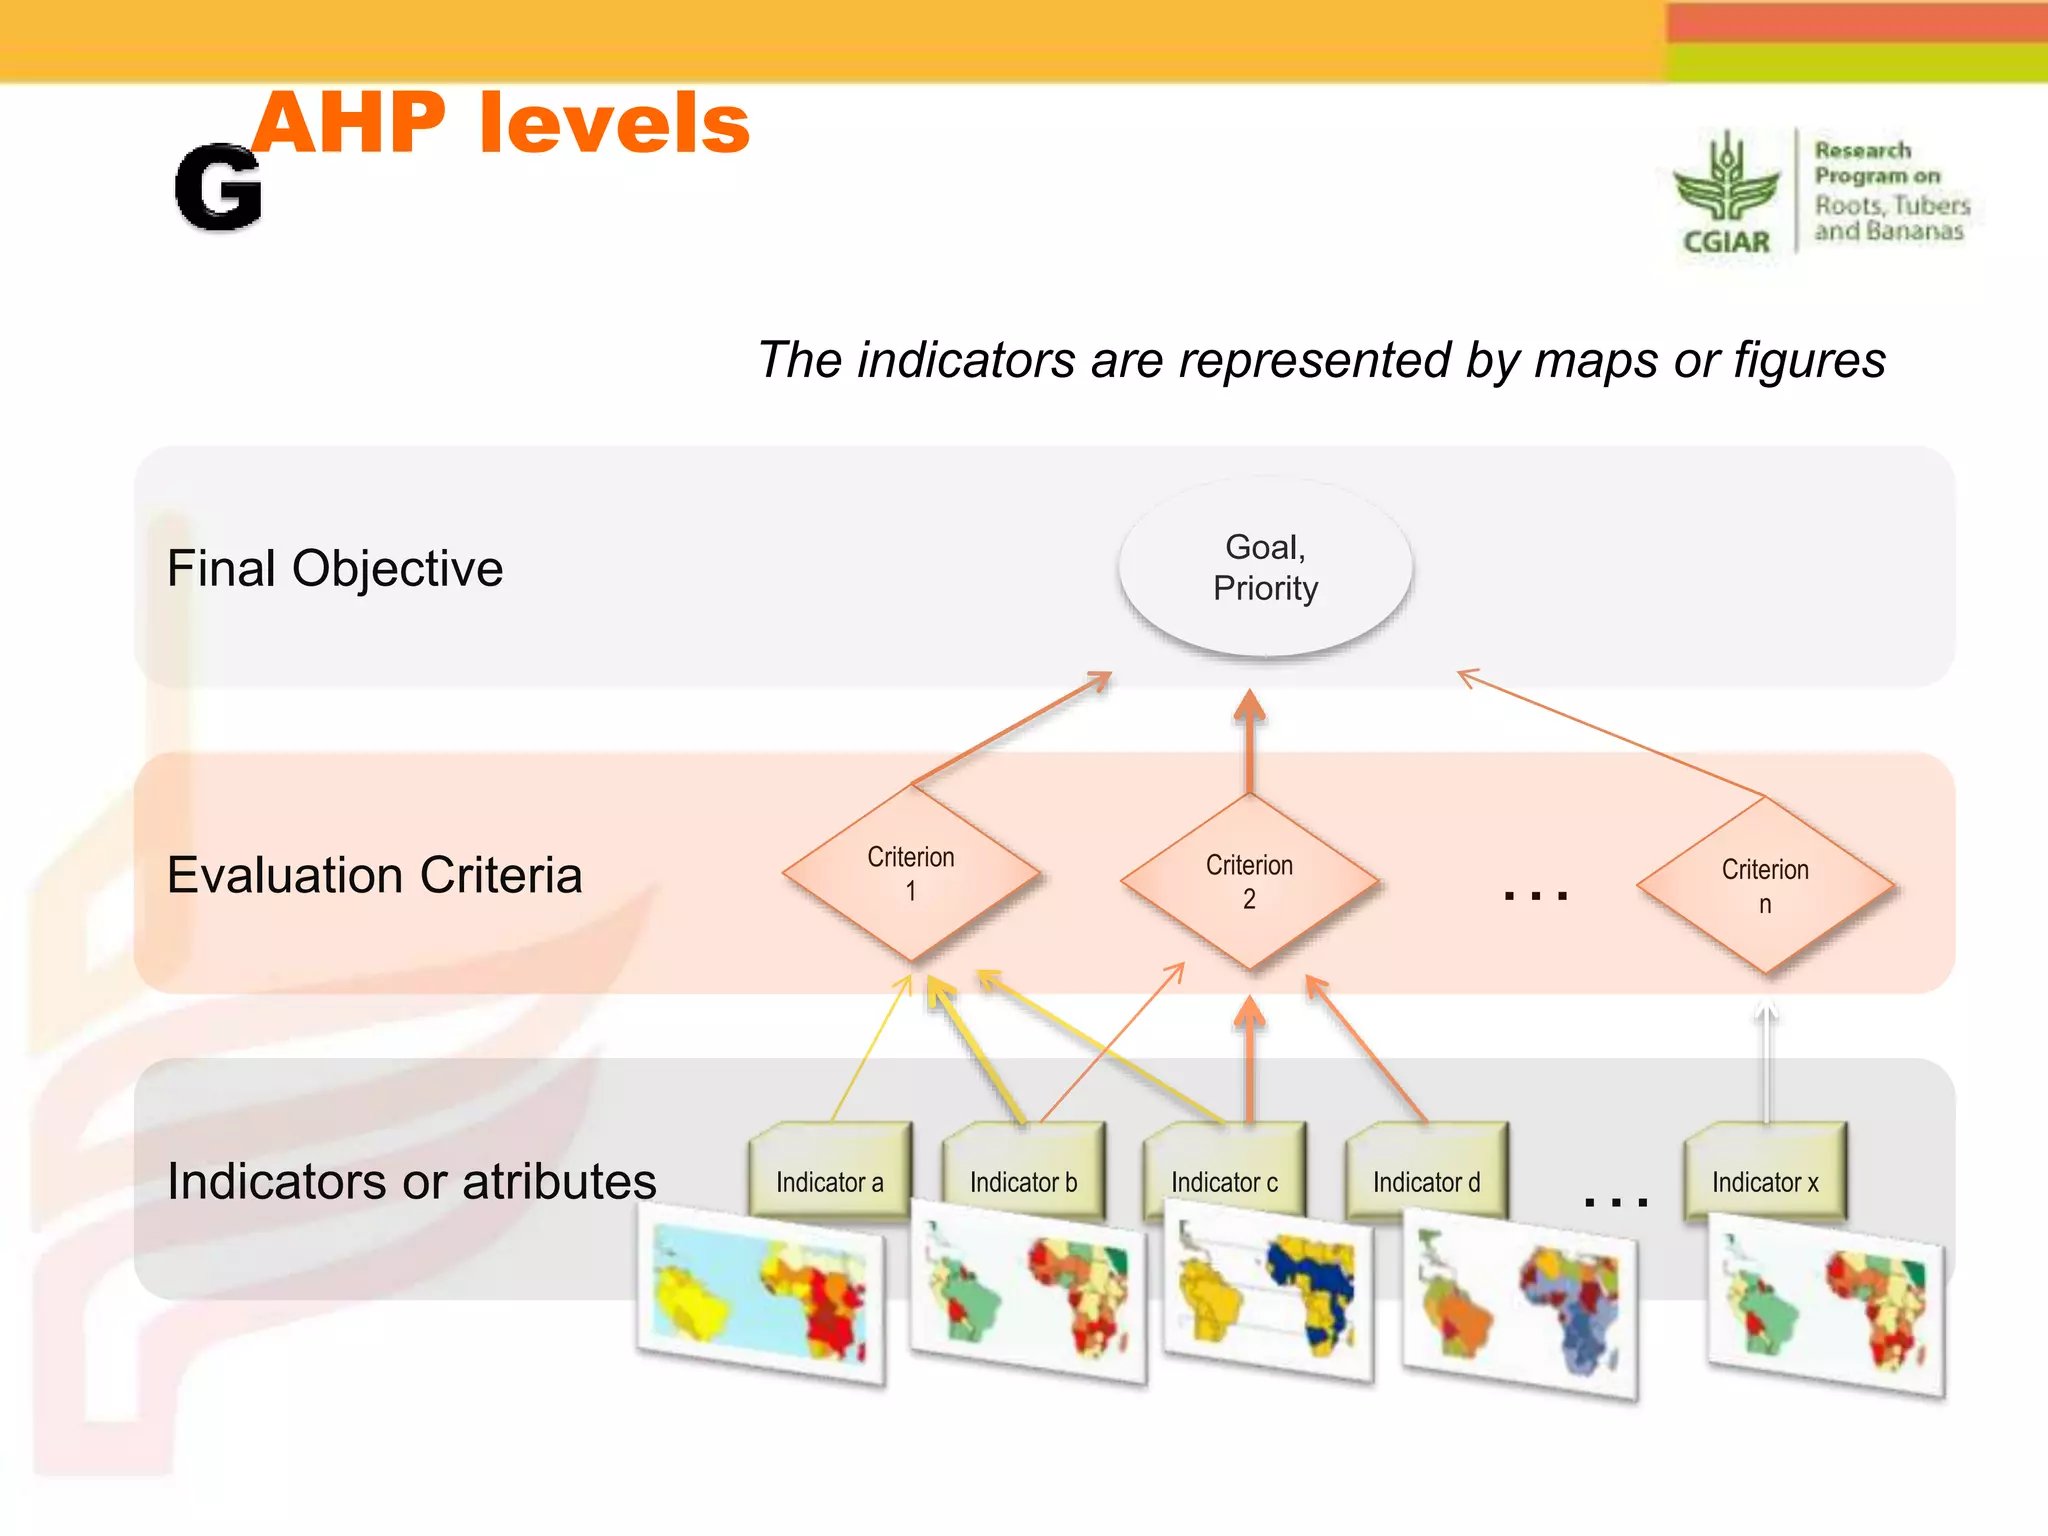
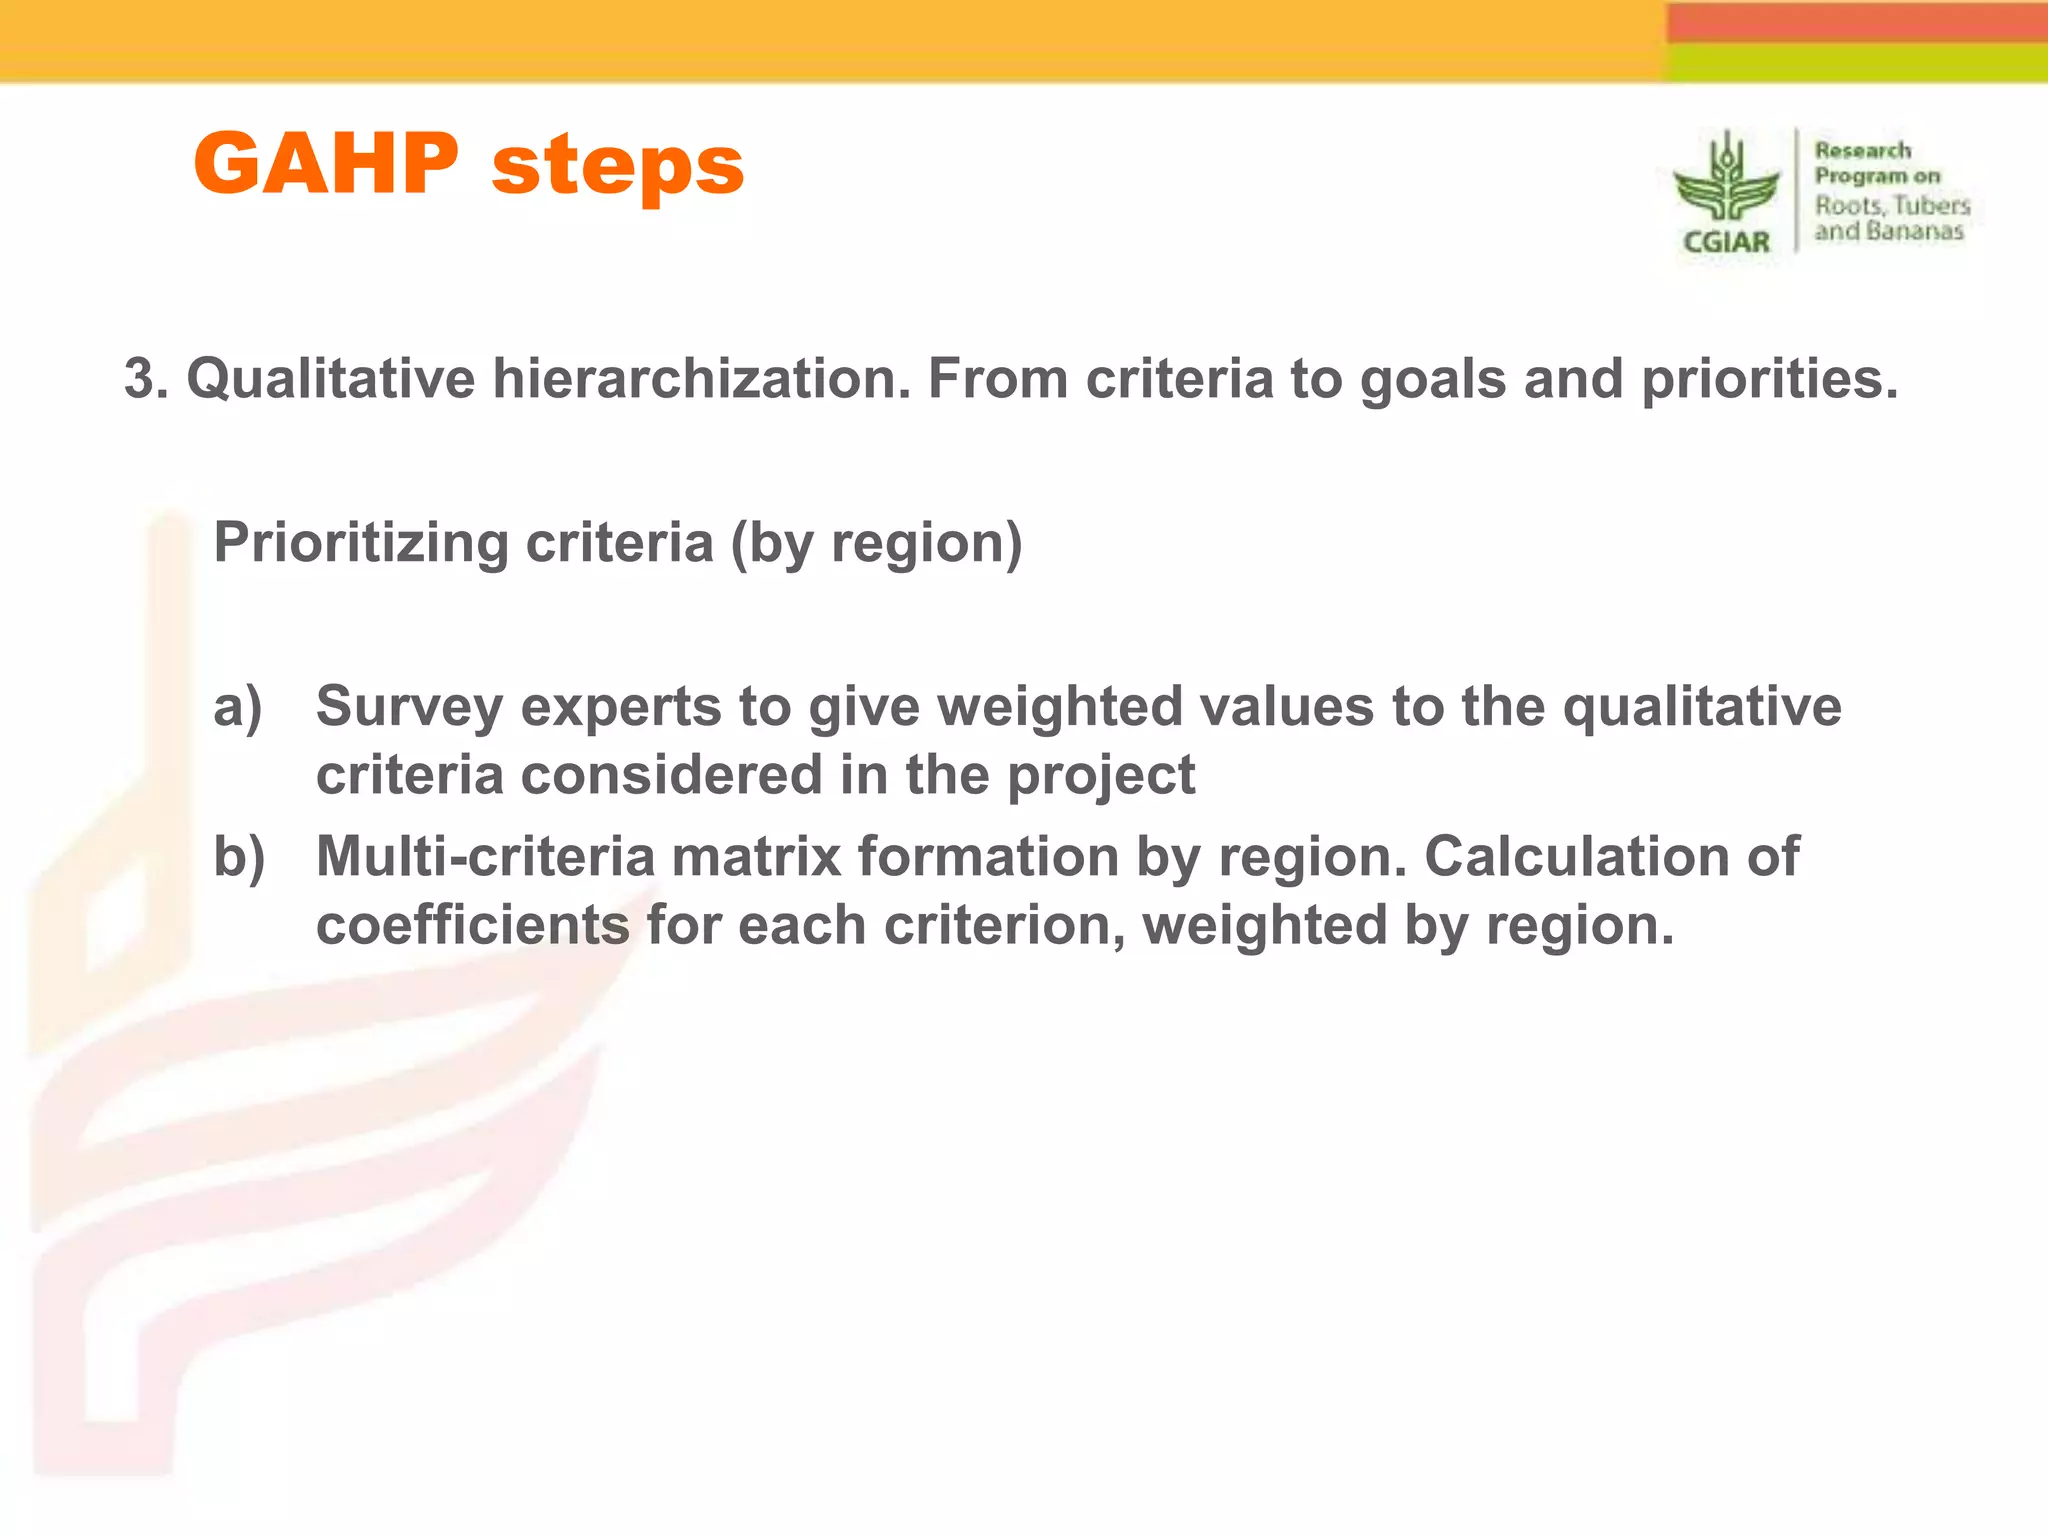
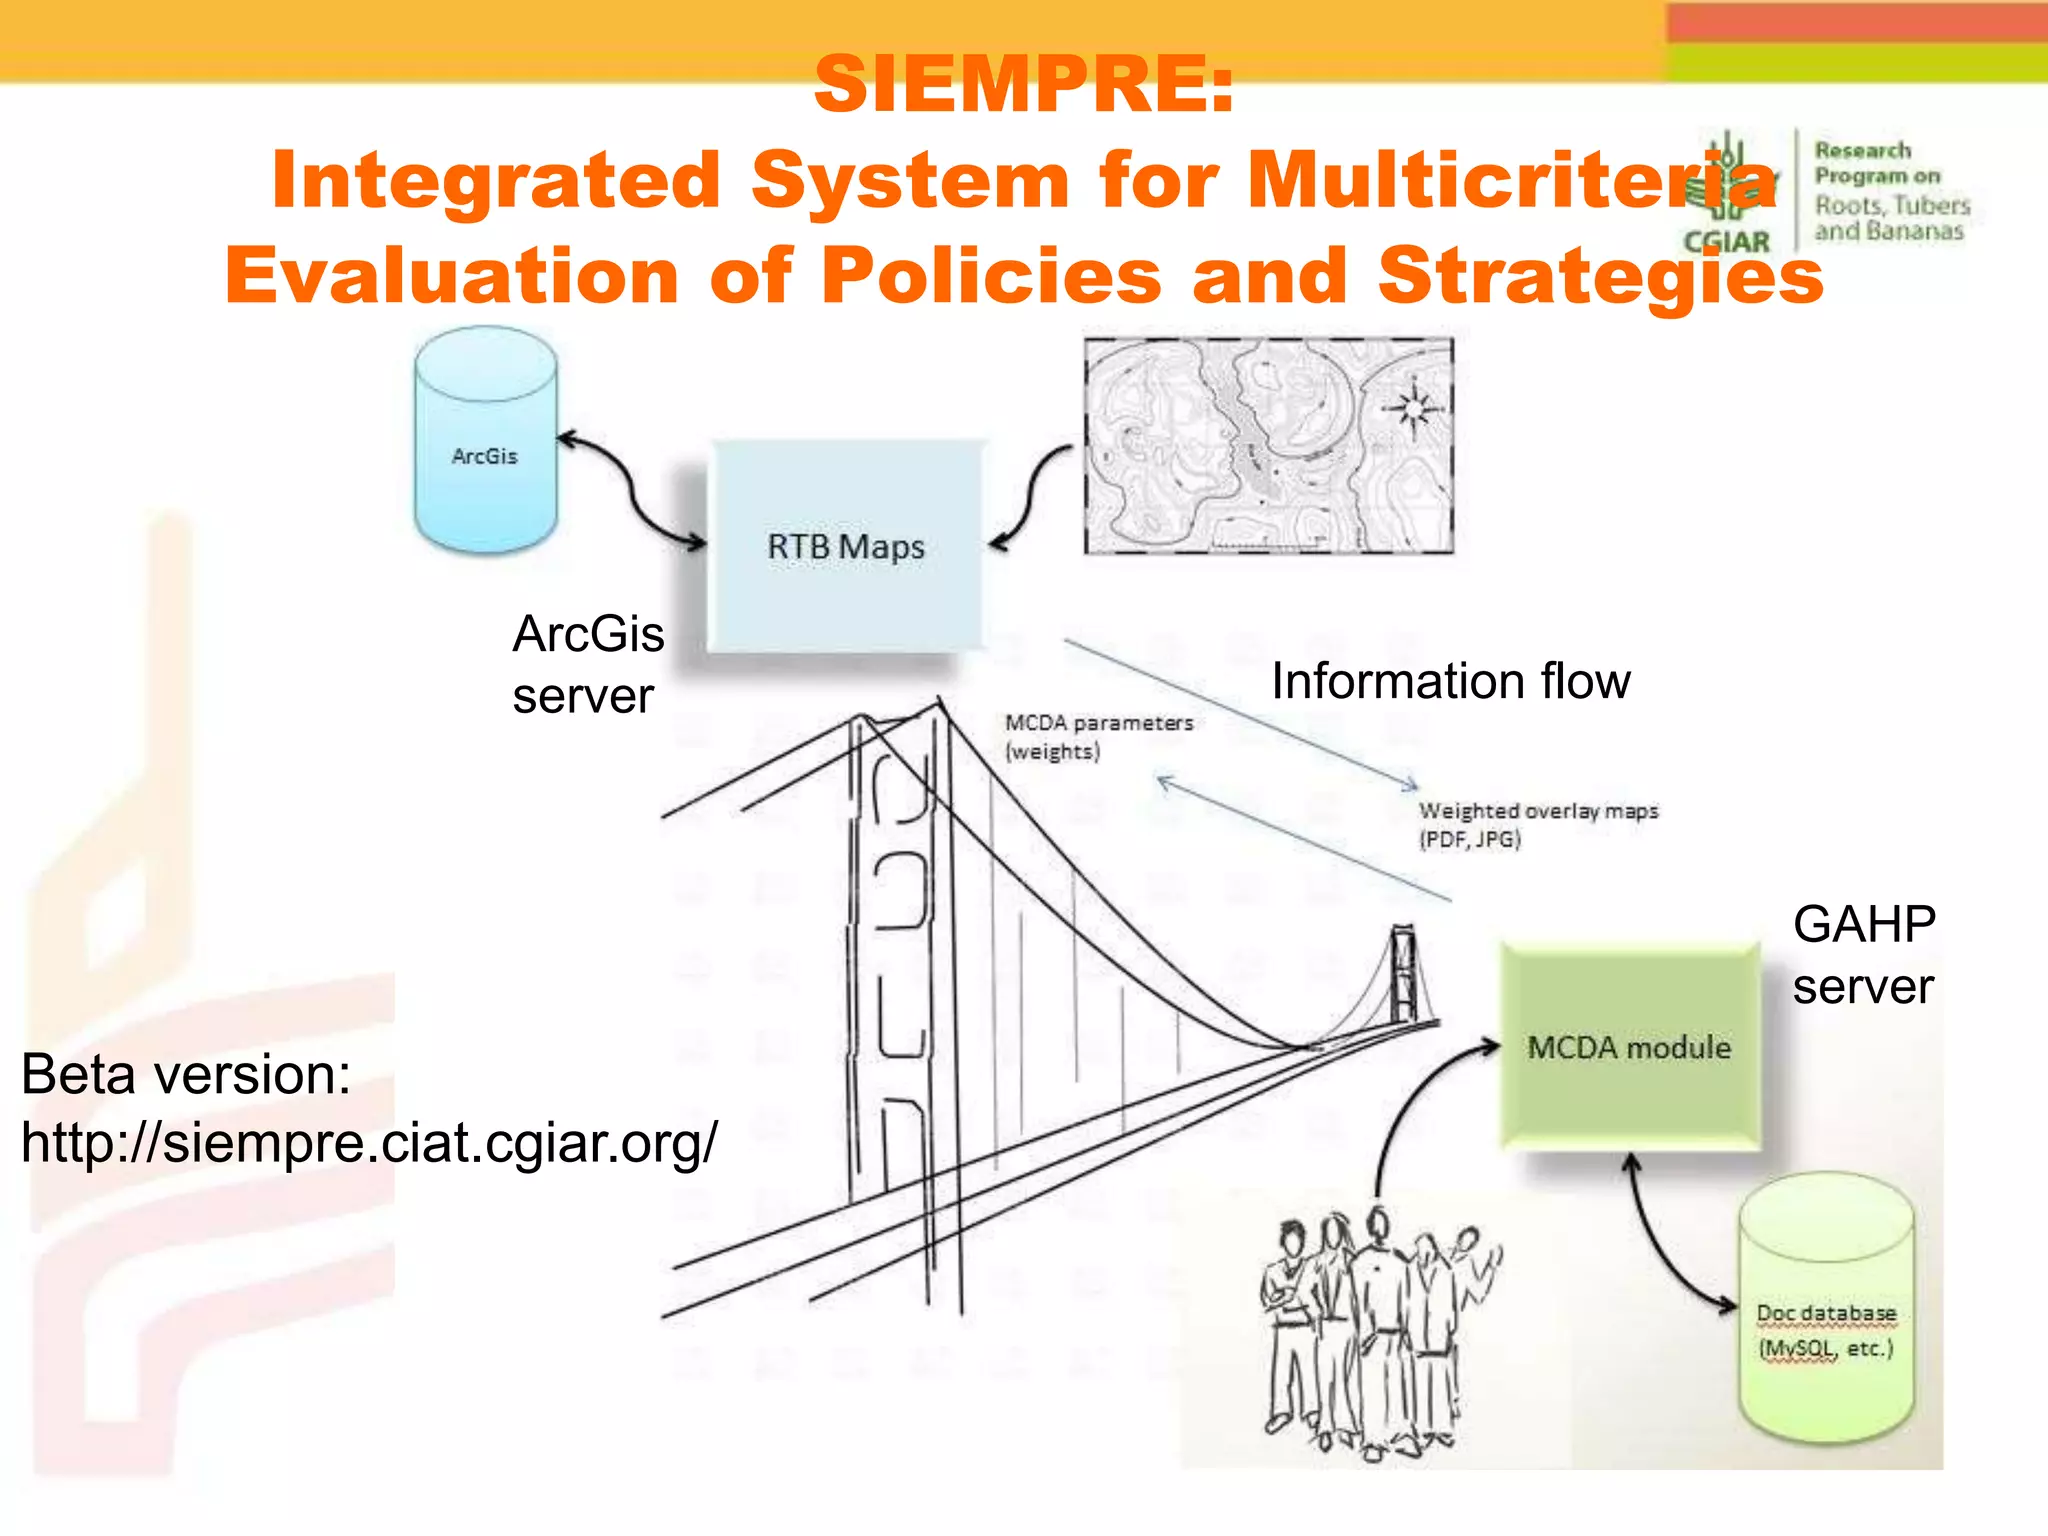
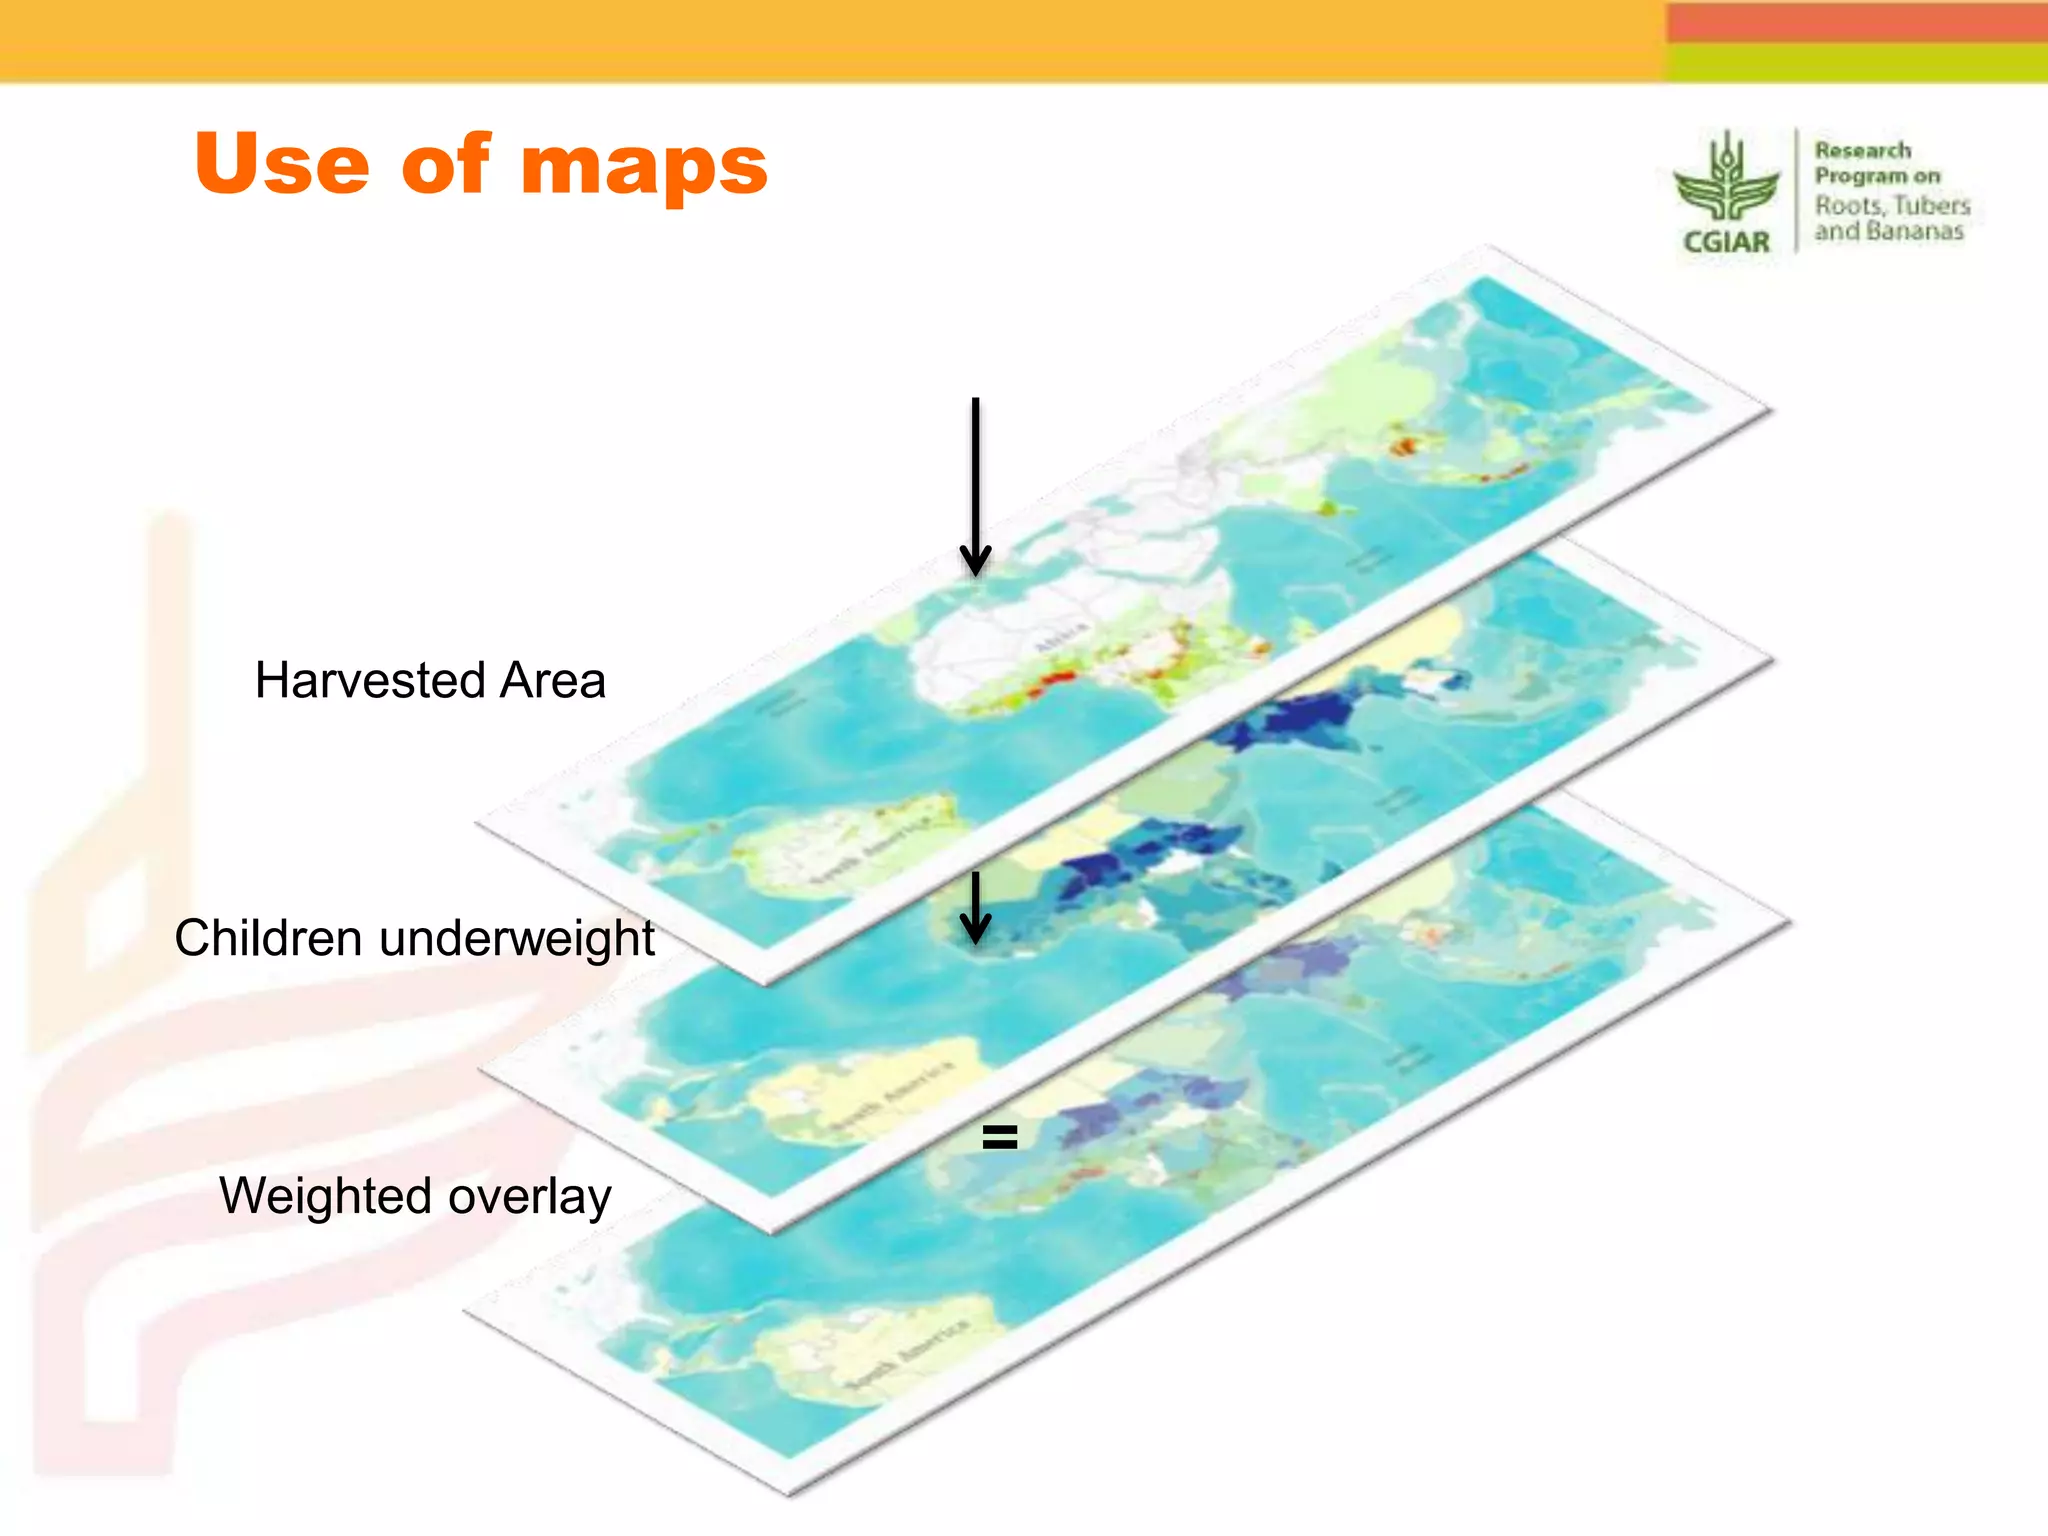
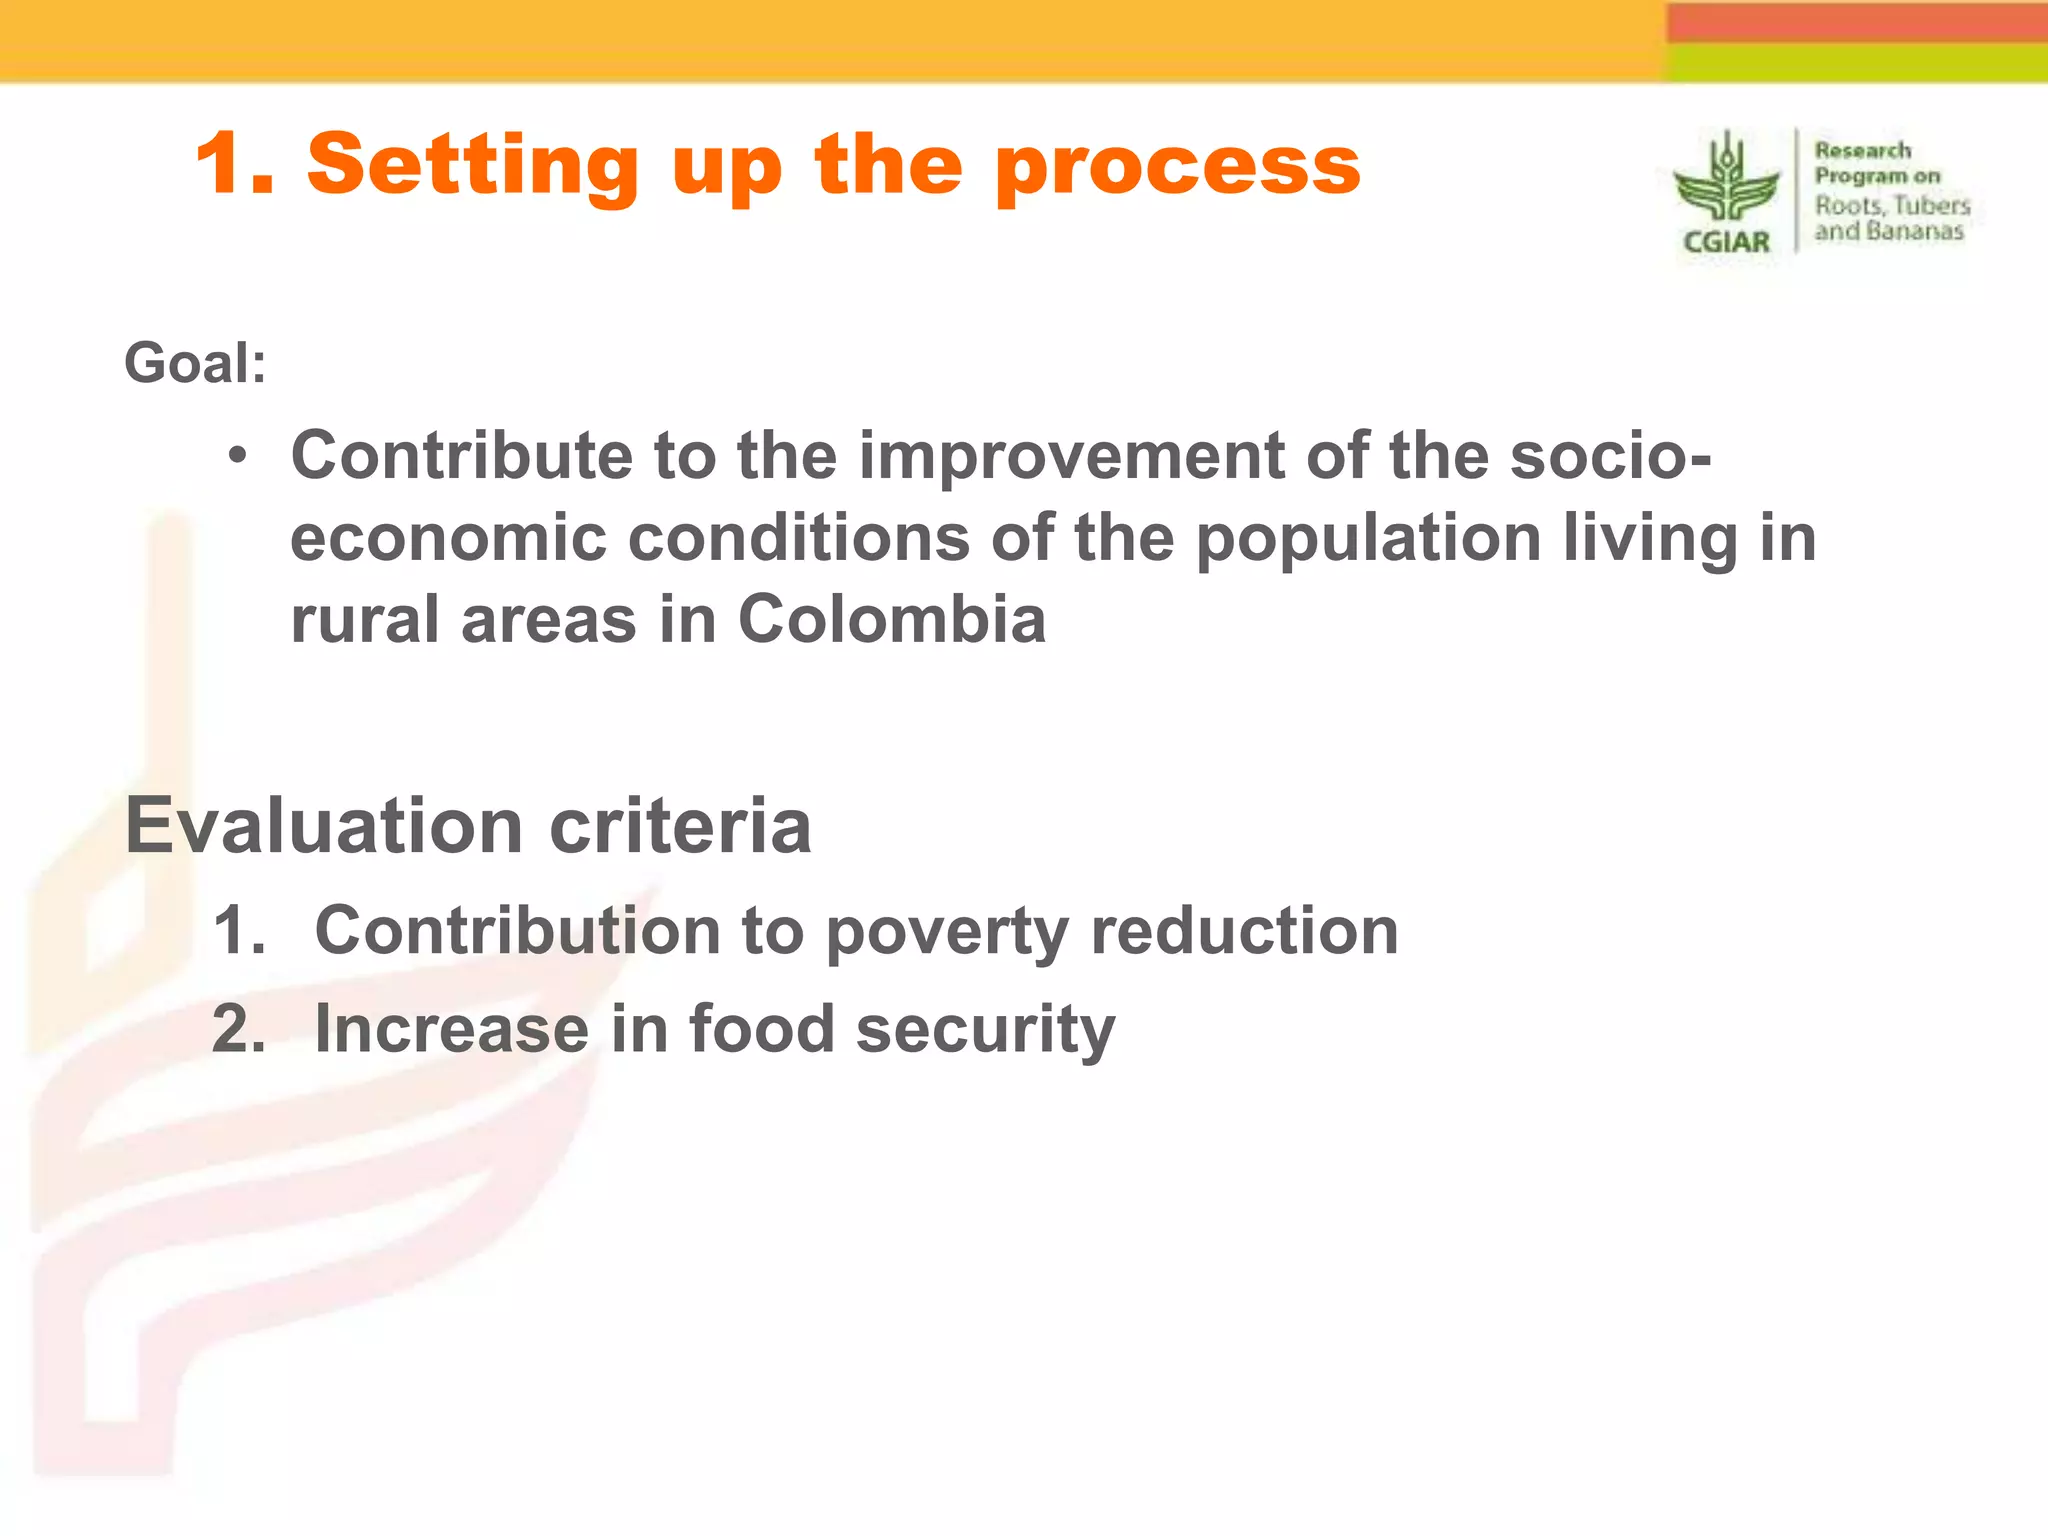
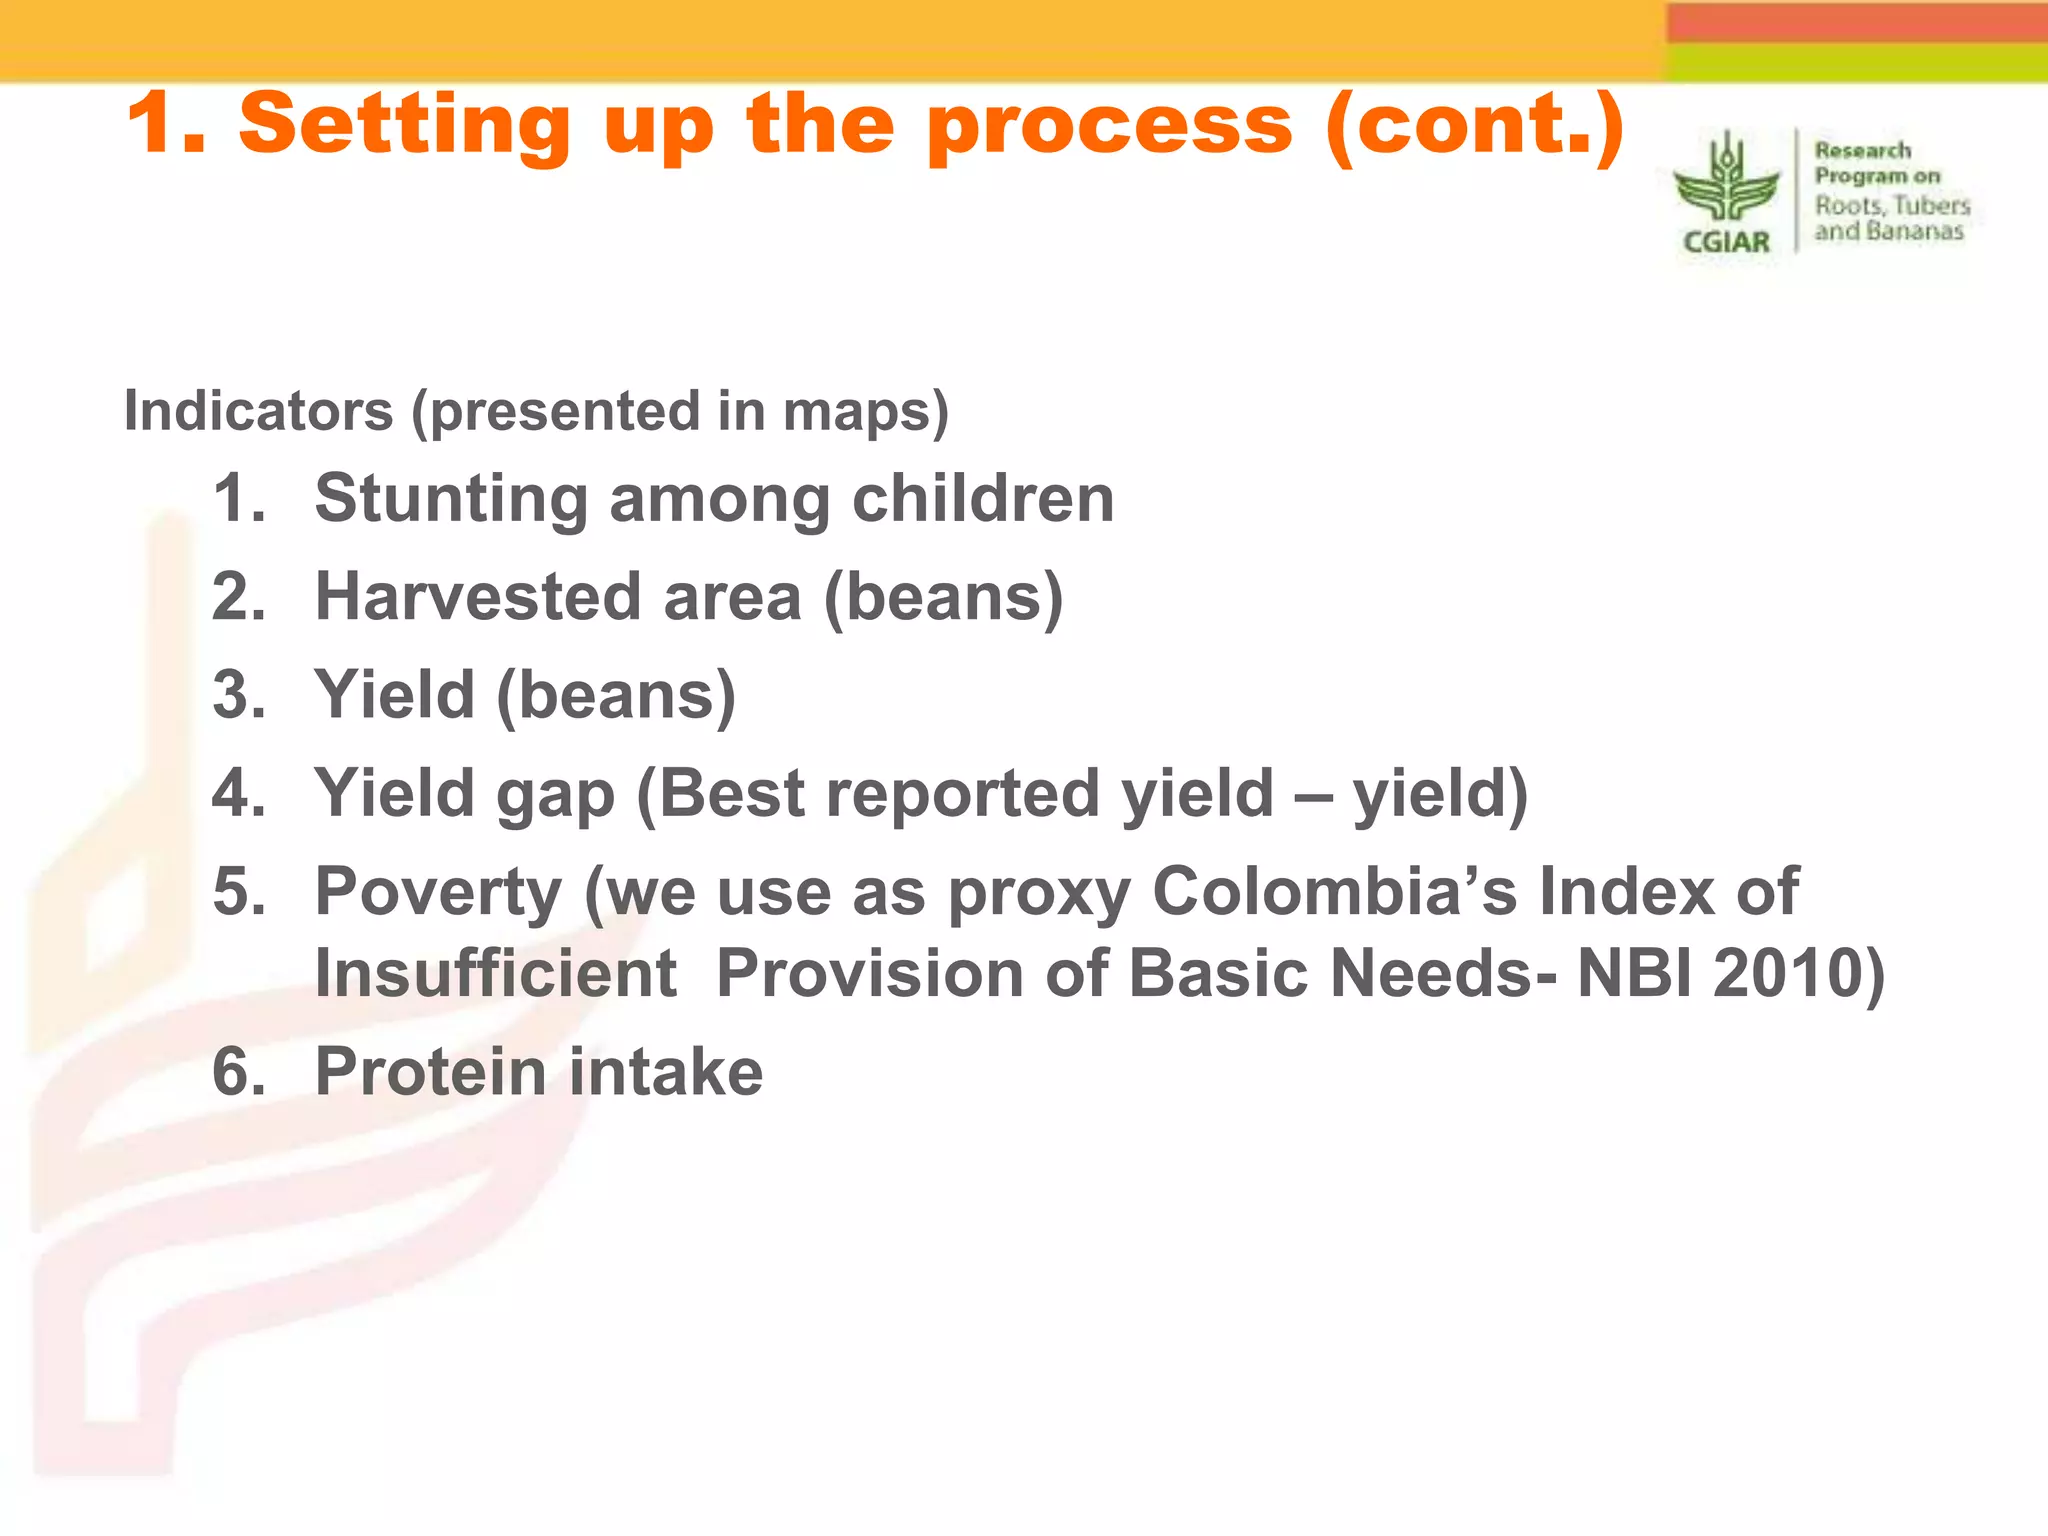
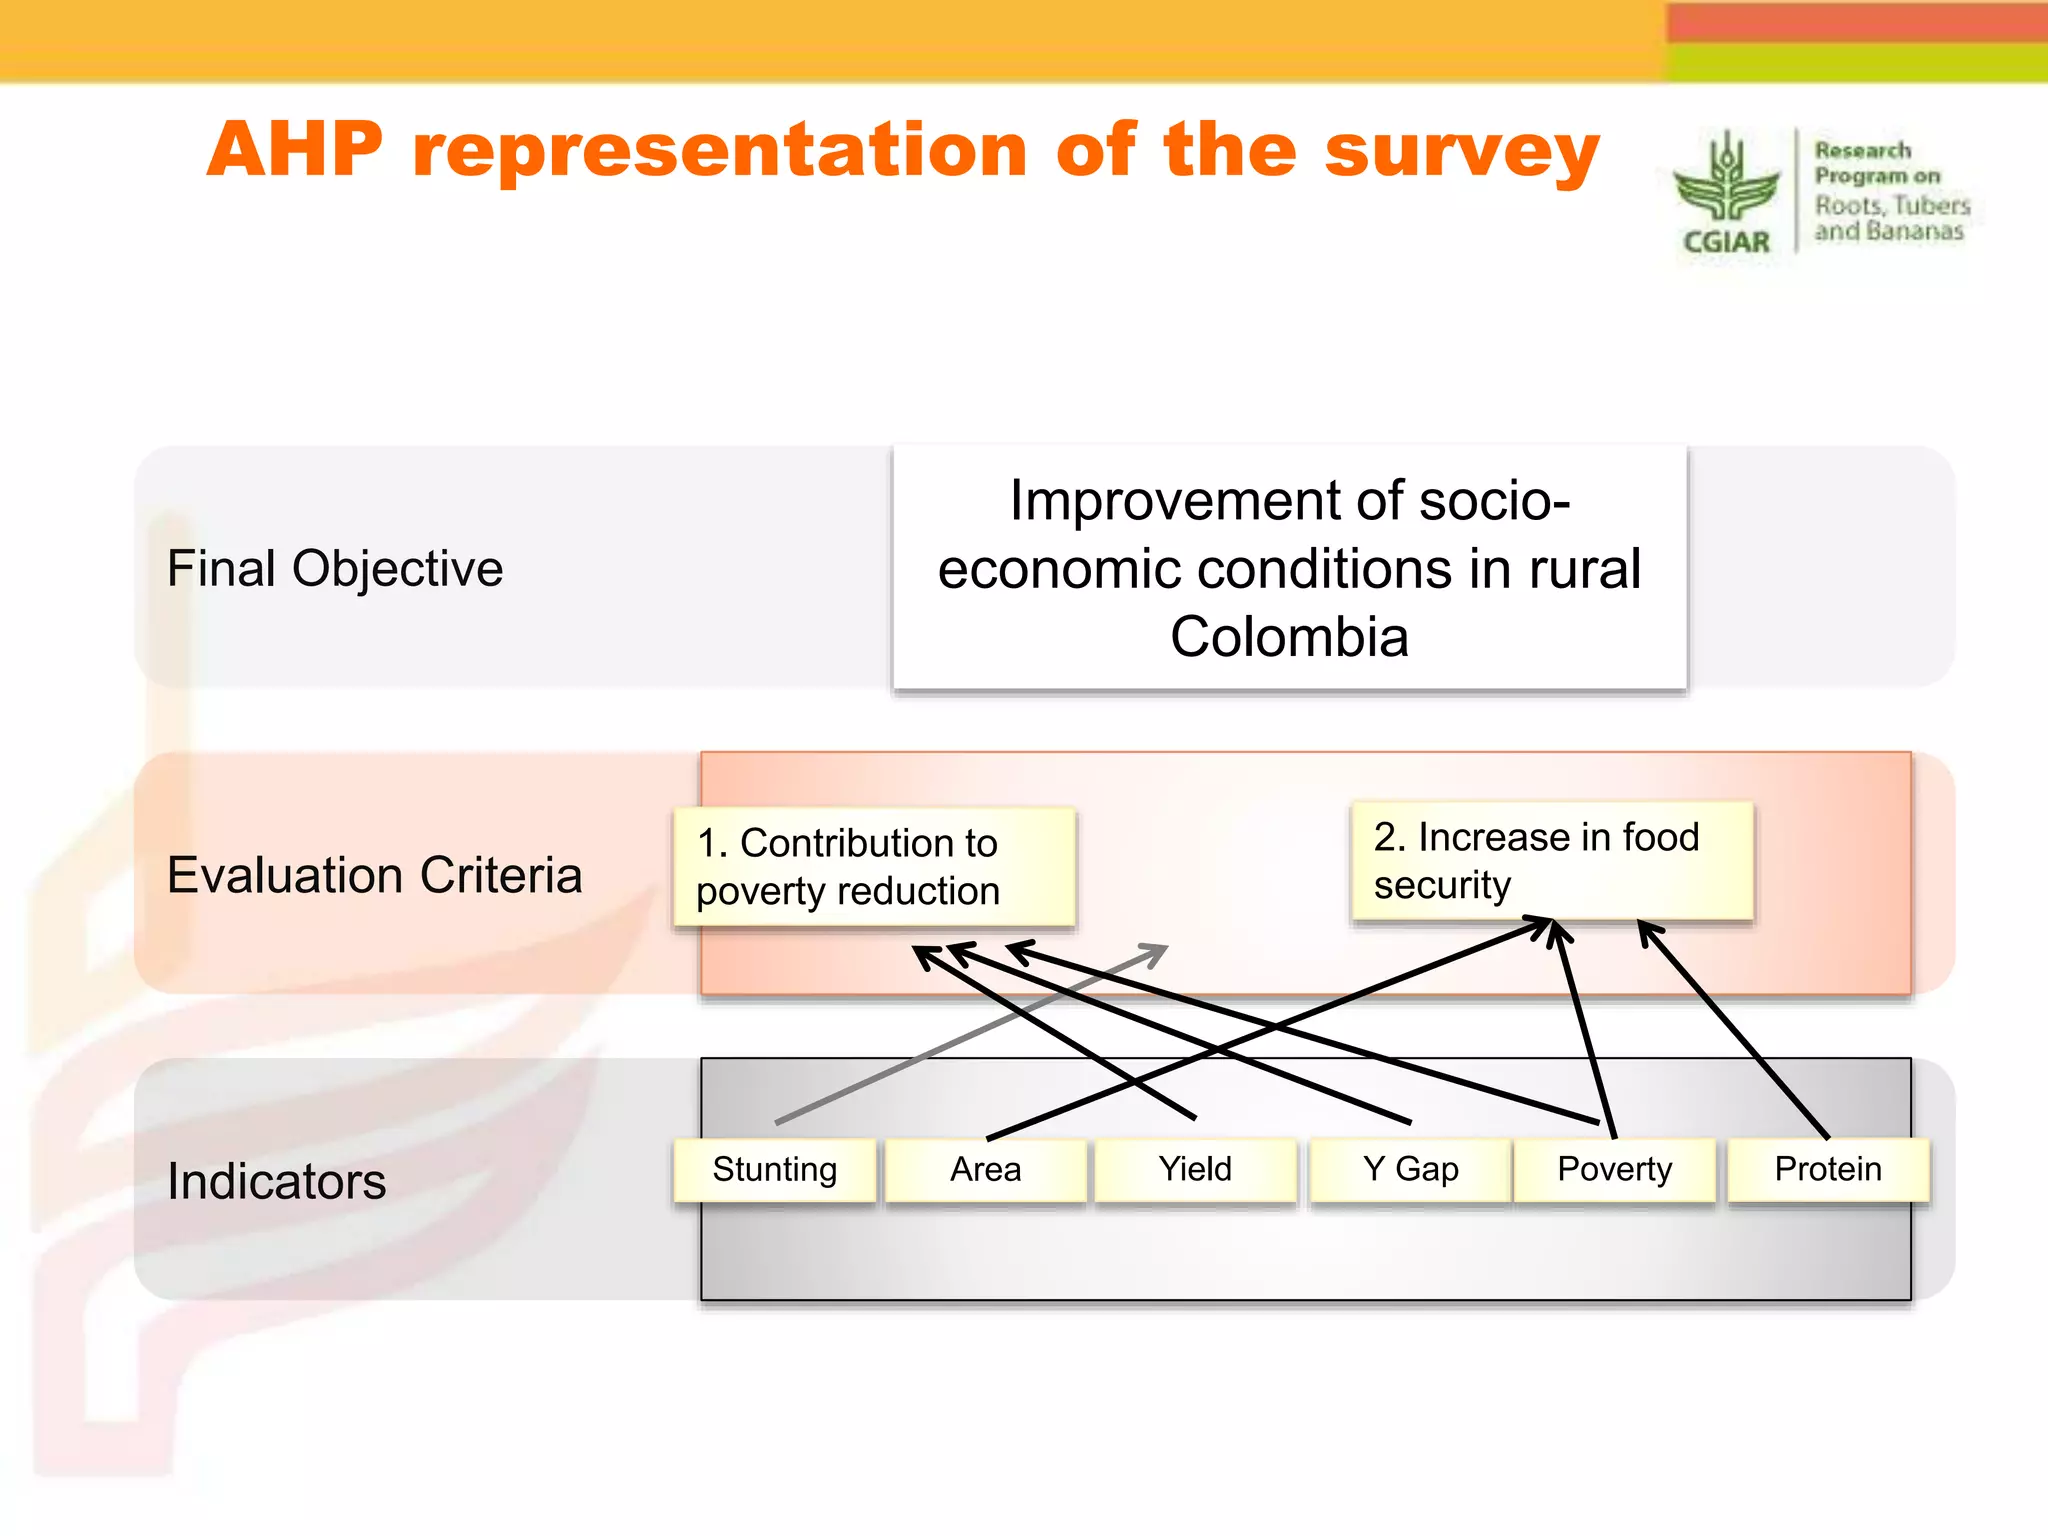
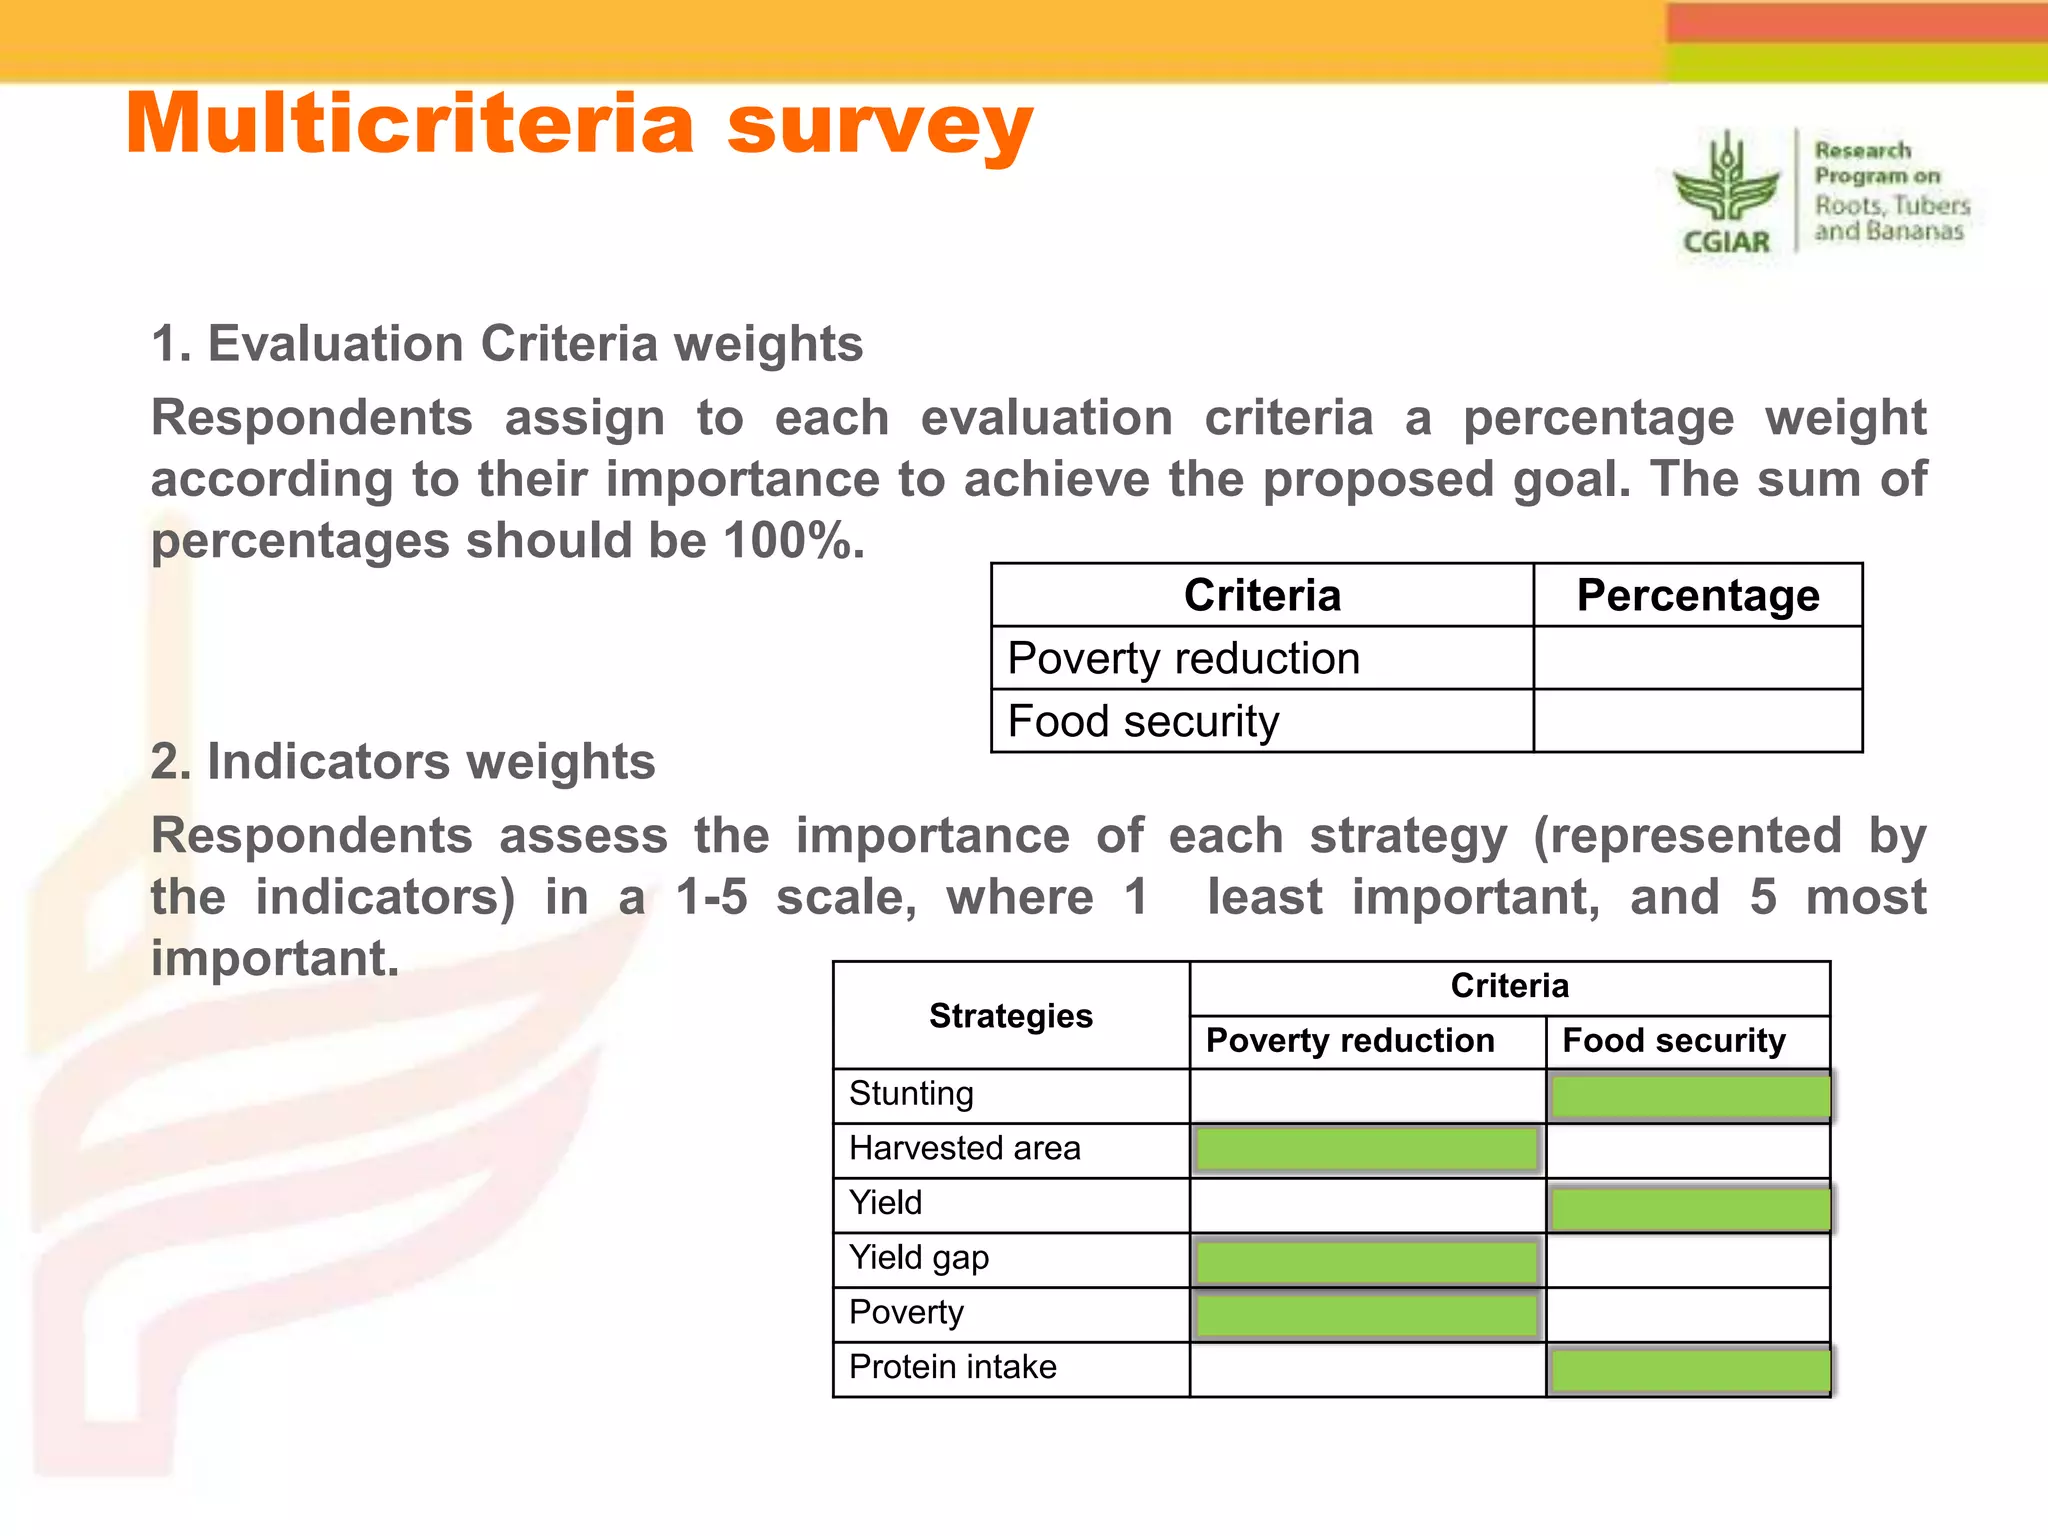
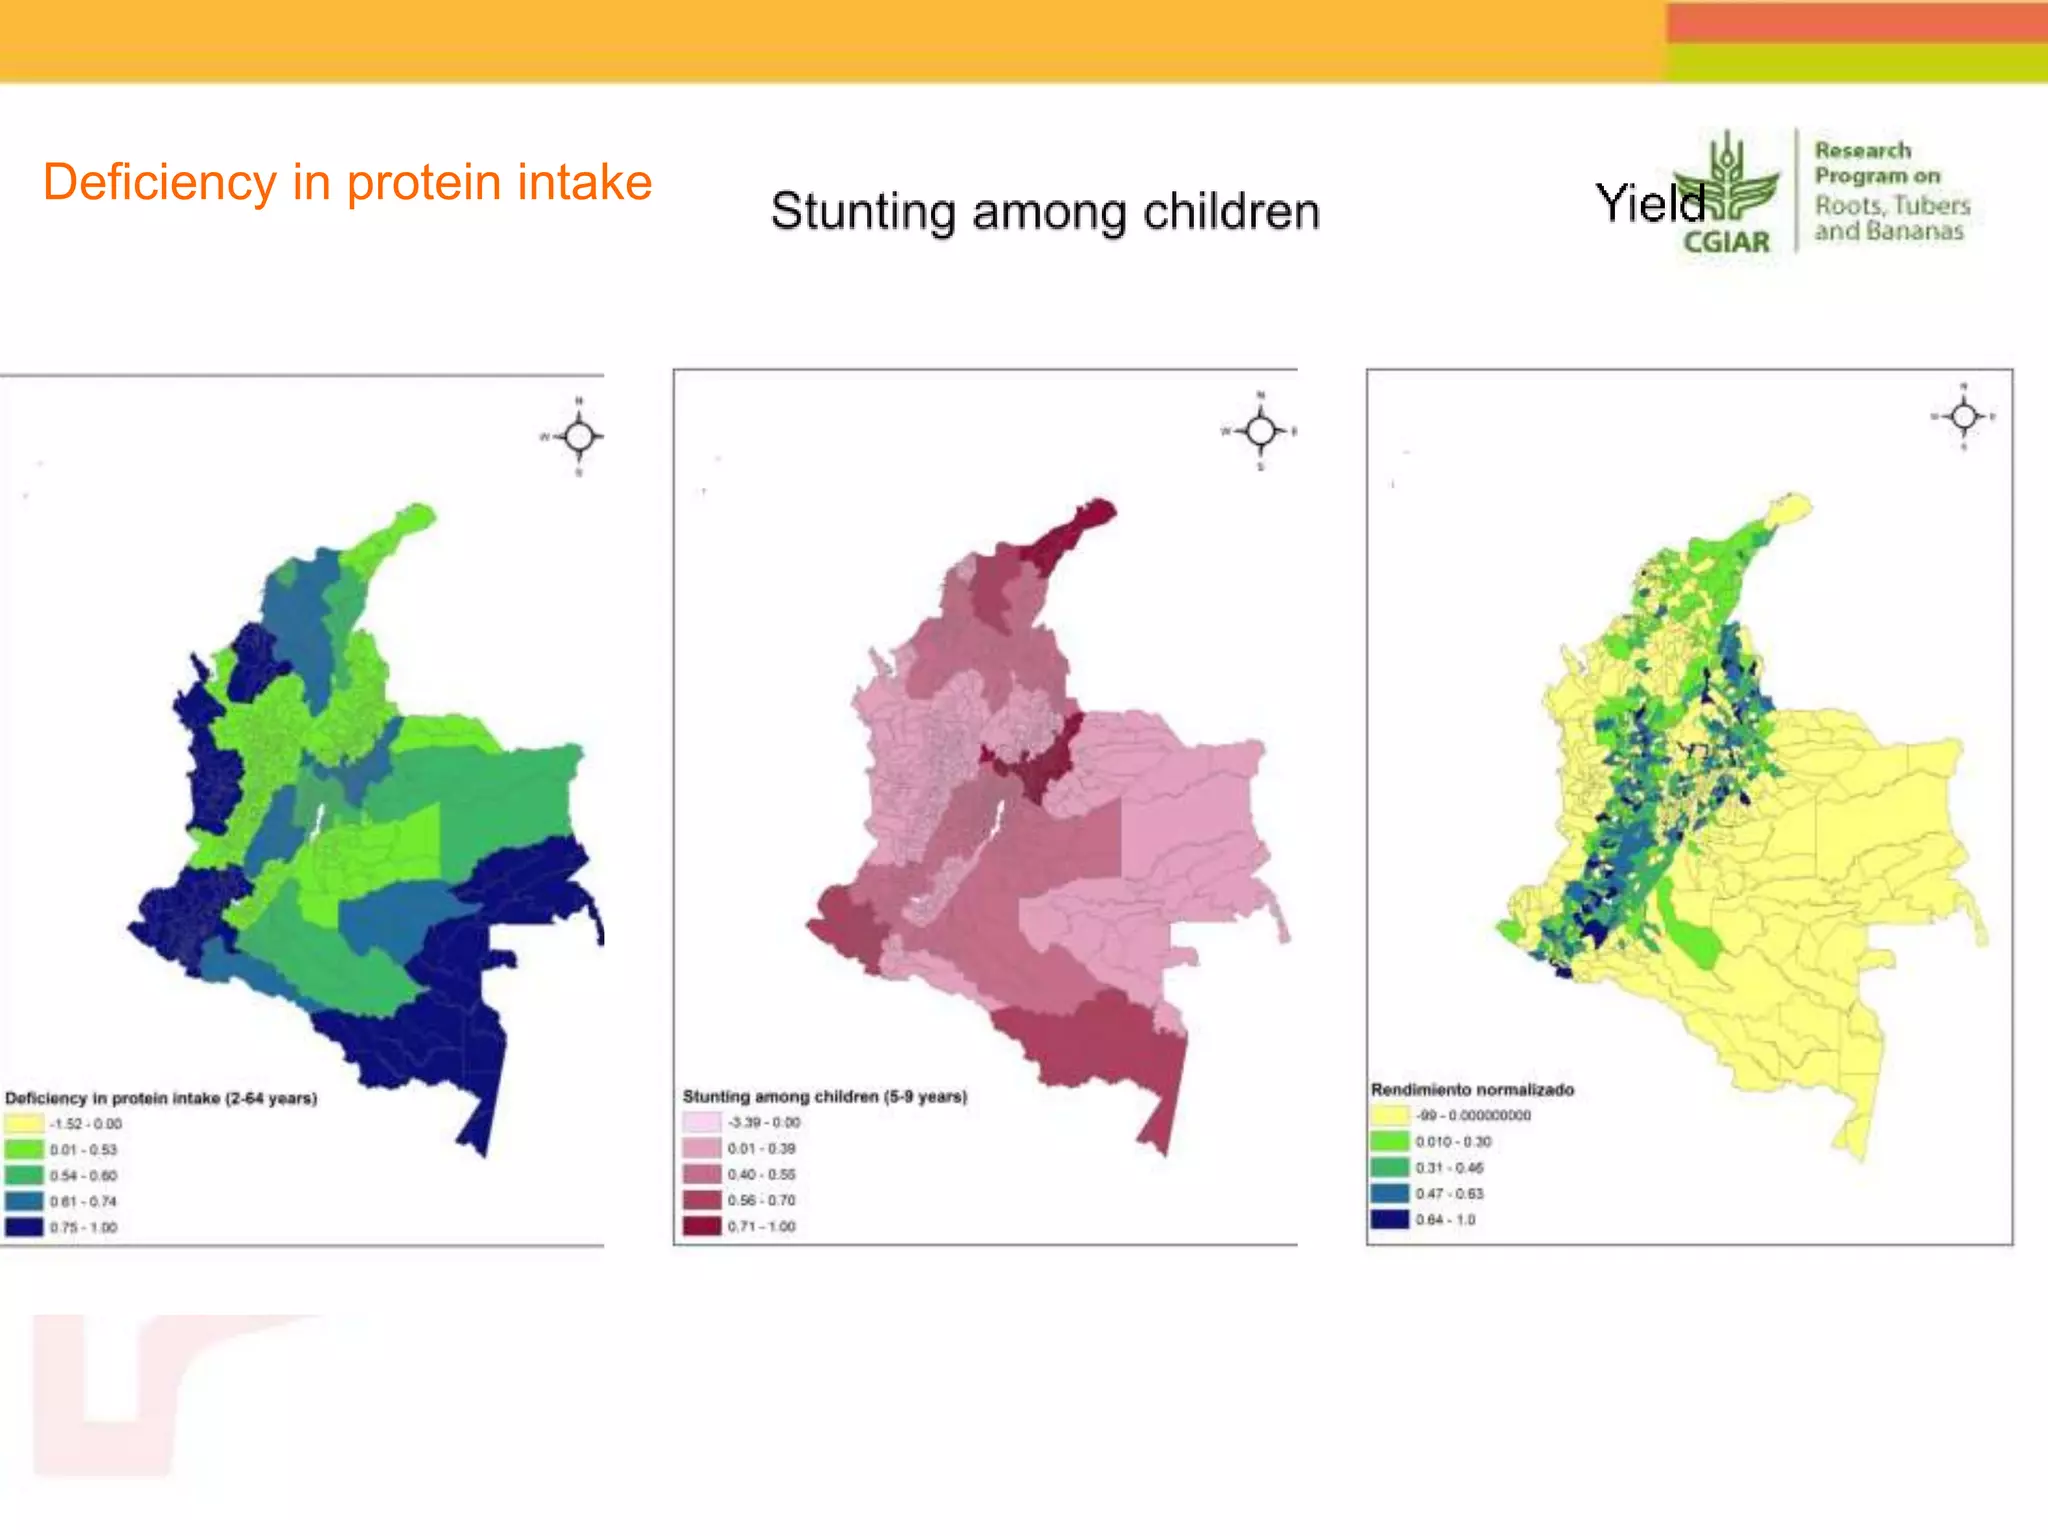
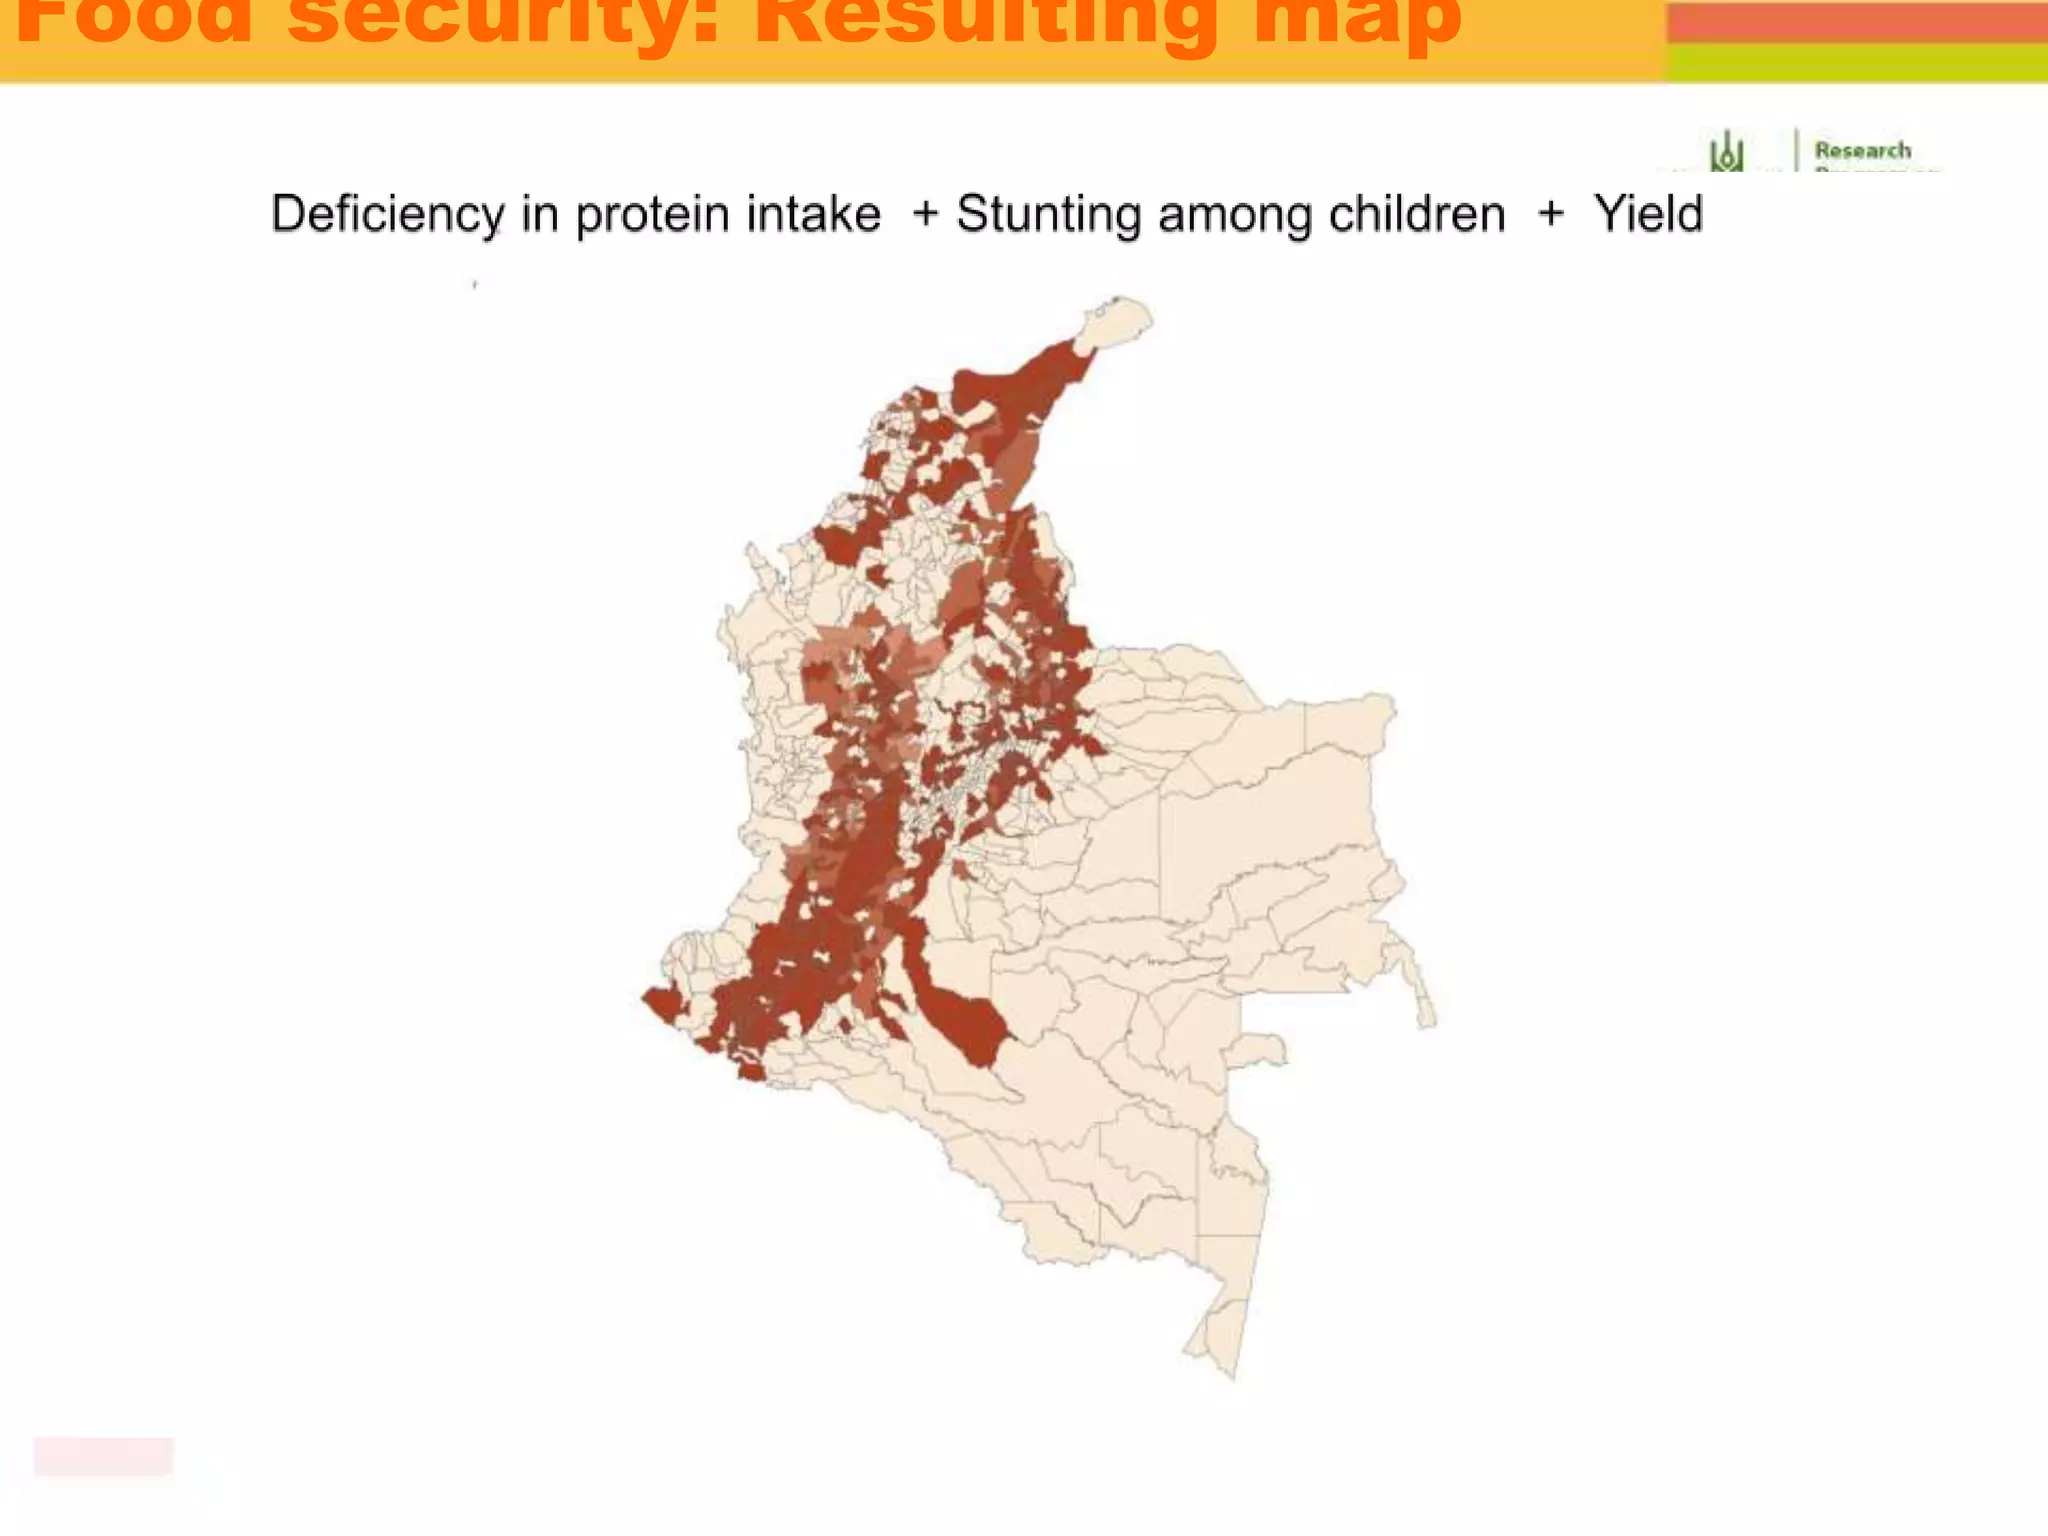
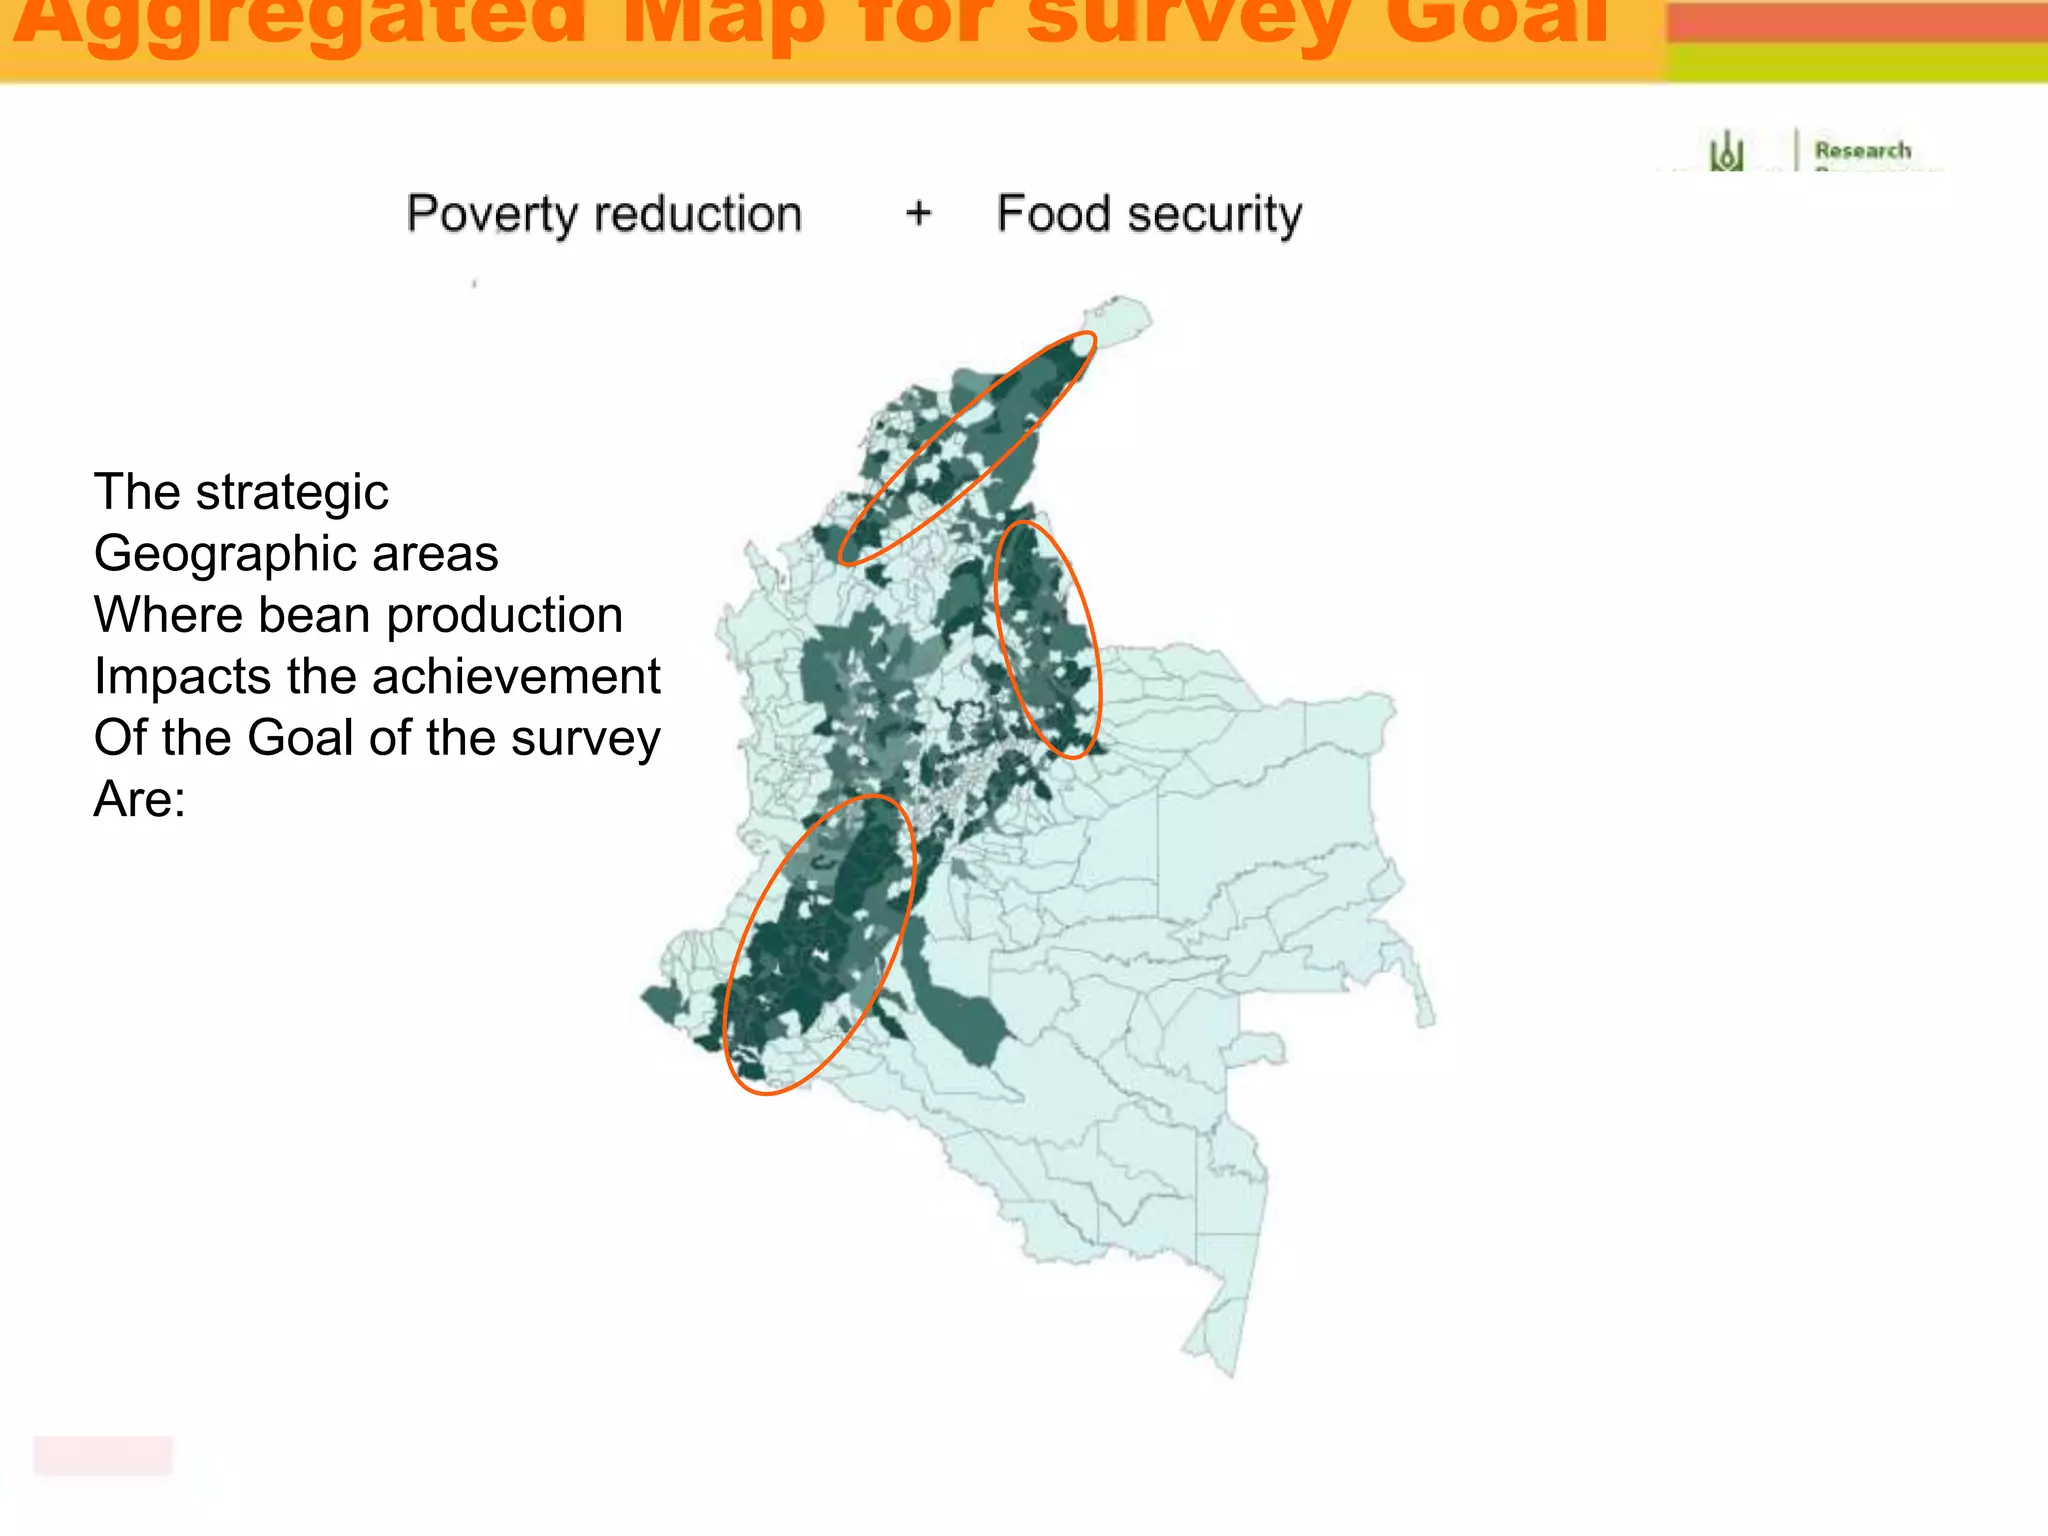
SIEMPRE:
A GIS aided multi-criteria decision analysis
application for setting priorities
Bernardo Creamer, Jesús Rodríguez, Glenn Hyman,
Ernesto Giron, Marcos Nobre
Glenn Hyman
ESRI International User Conference
16 July 2014
Complex problems that require multidisciplinary teams
Involve diversity of stakeholders (e.g. lower income population,
small farmers, entrepreneurs, local governments, etc.)
Various scales: Local, regional, continental, global
Multiple parameters of assessment: economic
returns, Environmental impact, impact on
health, nutrition quality, etc.
Uncertainty and incomplete information
Complexity of
Policy and Decision Analysis
Example: Environmental impactEconomicImpact
Environmental impact
(more is bad)
Project 1
High cost
Project 2
Medium cost
Project 3
Low cost
Which project do we execute?
Depends:
1. High economic Impact: choose Pr. 1
2. Low environmental Impact: Pr. 2
3. Limited resources: Project 3
Analytical Hierarchy Process
AHP
Scoring methodology for multi-criteria decision
analysis (MCDA)
Categorizes empirical data and qualitative
information
Summarizes the importance of all parts in a coherent
and simple hierarchical frame -> Helps organize
the decision analysis in different levels
GIS aided AHP -> GAHP
In the information process for making the decision,
GIS tools and maps are utilized
AHP levels
Goal,
Priority
Criterion
1
Criterion
2
Criterion
n…
Indicator a Indicator b Indicator c Indicator d Indicator x
…
Final Objective
Evaluation Criteria
Indicators or atributes
The indicators are represented by maps or figures
GAHP steps
1. Setting up the process: definition of goals, priorities, criteria
and indicators.
2. Quantitative prioritization. From indicators to criteria.
3. Qualitative hierarchization. From criteria to goals and
priorities
1. Setting up the process: definition of goals, priorities, criteria
and indicators.
• Goal:
• What is the final objective of our project?
• Why are we doing all this for?
• Examples:
• For this workshop: Areas where RTB technologies are going to
be most beneficial.
• For the RTB PS: Increase the welfare of lower income
populations in RTB growing regions
GAHP steps
GAHP steps
2. Quantitative prioritization. From indicators to criteria
Weighted Overlay Spatial Analysis
a) Collection of relevant spatial information data to use as
indicators
b) Categorization of indicators:
a) Conformation of indicator baskets that relate to each criterion.
Indicators can be seen as proxy variables that can explain part of the
criterion.
b) Attaching weights to indicators
c) Overlaying weighted indicator layers to visualize each
criterion in terms of their proxies.
GAHP steps
3. Qualitative hierarchization. From criteria to goals and priorities.
Prioritizing criteria (by region)
a) Survey experts to give weighted values to the qualitative
criteria considered in the project
b) Multi-criteria matrix formation by region. Calculation of
coefficients for each criterion, weighted by region.
SIEMPRE:
Integrated System for Multicriteria
Evaluation of Policies and Strategies
Beta version:
http://siempre.ciat.cgiar.org/
ArcGis
server Information flow
GAHP
server
Use of maps
Harvested Area
Children underweight
Weighted overlay
=
This exercise is a simulated survey by which we intend
to assess strategies or priorities for the beans
production sector that can help to improve the socio
economic conditions of the population living in crops
producer areas.
Example survey:
Strategic agricultural areas in Colombia
Goal:
• Contribute to the improvement of the socio-
economic conditions of the population living in
rural areas in Colombia
Evaluation criteria
1. Contribution to poverty reduction
2. Increase in food security
1. Setting up the process
Indicators (presented in maps)
1. Stunting among children
2. Harvested area (beans)
3. Yield (beans)
4. Yield gap (Best reported yield – yield)
5. Poverty (we use as proxy Colombia’s Index of
Insufficient Provision of Basic Needs- NBI 2010)
6. Protein intake
1. Setting up the process (cont.)
AHP representation of the survey
Goal,
Priority
Criterion
1
Criterion
2
Criterion
n…
Indicator a Indicator b Indicator c Indicator d Indicator x…
Final Objective
Evaluation Criteria
Indicators
Improvement of socio-
economic conditions in rural
Colombia
1. Contribution to
poverty reduction
2. Increase in food
security
Stunting Area Yield Y Gap Poverty Protein
1. Evaluation Criteria weights
Respondents assign to each evaluation criteria a percentage weight
according to their importance to achieve the proposed goal. The sum of
percentages should be 100%.
2. Indicators weights
Respondents assess the importance of each strategy (represented by
the indicators) in a 1-5 scale, where 1 least important, and 5 most
important.
Criteria Percentage
Poverty reduction
Food security
Multicriteria survey
Strategies
Criteria
Poverty reduction Food security
Stunting
Harvested area
Yield
Yield gap
Poverty
Protein intake
 We simulated 200 responses to the multicriteria survey.
 For criteria assessment responses following a normal
distribution with average equal to 60% and 40% , for Poverty
Reduction and Food Security, respectively, and a standard
deviation equal to 10% were generated.
 The answers of each hypothetical respondent were normalized
so that their sum equal 100%.
 For strategies assessment, a sequence of numbers between 1
and 6 is created, and a sample with replacement of 200 is
taken. The responses are then truncated at 5.
 We set the limit of the sampling to 6 in order to get average
valuations close to 5 for strategies with very high importance.
Methodology for data
generation
Poverty reduction Food security
Min 18 3
Mean. 40 36
Max. 70 61
Summary statistics of the Criteria
Assessment
Source: Own calculations with simulated data.
Criteria
Stunting among
children
Harvest
ed area
Yield Poverty
Protein
intake
Poverty
reduction
Min 0 3 0 4 0
Mean 0 4 0 5 0
Max. 0 5 0 5 0
Food
security
Min 2 0 2 0 4
Mean 3 0 3 0 5
Max. 4 0 4 0 5
Harvested area
Normalized data for common bean
Poverty reduction: resulting map
Deficiency in protein intake
Food security: Resulting map
Aggregated Map for survey Goal
The strategic
Geographic areas
Where bean production
Impacts the achievement
Of the Goal of the survey
Are:
The AHP method allows for an structured discussion of
complex problems, by dissagregating them into
different levels of importance or scale.
The Siempre package, by utilizing an AHP
methodology aided by GIS tools, allows decision
makers to utilize extensive amounts of informationin
the form of maps to help the decision making
process.
The priority setting of options of different nature or
measurement parametrs is simplified by this
package
Conclusions
Siempre can be used in an iterive way to do sensitivity
analysis for different conditions or values for
options or strategies, as the geographic impacts can
be displayed inmediately on maps.
Conclusions (cont.)
Thank you!
Gracias Siempre!
Beta version:
http://siempre.ciat.cgiar.org/

SIEMPRE: A GIS aided multi-criteria decision analysis application for setting priorities

  • 1.
    SIEMPRE: A GIS aidedmulti-criteria decision analysis application for setting priorities Bernardo Creamer, Jesús Rodríguez, Glenn Hyman, Ernesto Giron, Marcos Nobre Glenn Hyman ESRI International User Conference 16 July 2014
  • 2.
    Complex problems thatrequire multidisciplinary teams Involve diversity of stakeholders (e.g. lower income population, small farmers, entrepreneurs, local governments, etc.) Various scales: Local, regional, continental, global Multiple parameters of assessment: economic returns, Environmental impact, impact on health, nutrition quality, etc. Uncertainty and incomplete information Complexity of Policy and Decision Analysis
  • 3.
    Example: Environmental impactEconomicImpact Environmentalimpact (more is bad) Project 1 High cost Project 2 Medium cost Project 3 Low cost Which project do we execute? Depends: 1. High economic Impact: choose Pr. 1 2. Low environmental Impact: Pr. 2 3. Limited resources: Project 3
  • 4.
    Analytical Hierarchy Process AHP Scoringmethodology for multi-criteria decision analysis (MCDA) Categorizes empirical data and qualitative information Summarizes the importance of all parts in a coherent and simple hierarchical frame -> Helps organize the decision analysis in different levels GIS aided AHP -> GAHP In the information process for making the decision, GIS tools and maps are utilized
  • 5.
    AHP levels Goal, Priority Criterion 1 Criterion 2 Criterion n… Indicator aIndicator b Indicator c Indicator d Indicator x … Final Objective Evaluation Criteria Indicators or atributes The indicators are represented by maps or figures
  • 6.
    GAHP steps 1. Settingup the process: definition of goals, priorities, criteria and indicators. 2. Quantitative prioritization. From indicators to criteria. 3. Qualitative hierarchization. From criteria to goals and priorities
  • 7.
    1. Setting upthe process: definition of goals, priorities, criteria and indicators. • Goal: • What is the final objective of our project? • Why are we doing all this for? • Examples: • For this workshop: Areas where RTB technologies are going to be most beneficial. • For the RTB PS: Increase the welfare of lower income populations in RTB growing regions GAHP steps
  • 8.
    GAHP steps 2. Quantitativeprioritization. From indicators to criteria Weighted Overlay Spatial Analysis a) Collection of relevant spatial information data to use as indicators b) Categorization of indicators: a) Conformation of indicator baskets that relate to each criterion. Indicators can be seen as proxy variables that can explain part of the criterion. b) Attaching weights to indicators c) Overlaying weighted indicator layers to visualize each criterion in terms of their proxies.
  • 9.
    GAHP steps 3. Qualitativehierarchization. From criteria to goals and priorities. Prioritizing criteria (by region) a) Survey experts to give weighted values to the qualitative criteria considered in the project b) Multi-criteria matrix formation by region. Calculation of coefficients for each criterion, weighted by region.
  • 10.
    SIEMPRE: Integrated System forMulticriteria Evaluation of Policies and Strategies Beta version: http://siempre.ciat.cgiar.org/ ArcGis server Information flow GAHP server
  • 11.
    Use of maps HarvestedArea Children underweight Weighted overlay =
  • 12.
    This exercise isa simulated survey by which we intend to assess strategies or priorities for the beans production sector that can help to improve the socio economic conditions of the population living in crops producer areas. Example survey: Strategic agricultural areas in Colombia
  • 13.
    Goal: • Contribute tothe improvement of the socio- economic conditions of the population living in rural areas in Colombia Evaluation criteria 1. Contribution to poverty reduction 2. Increase in food security 1. Setting up the process
  • 14.
    Indicators (presented inmaps) 1. Stunting among children 2. Harvested area (beans) 3. Yield (beans) 4. Yield gap (Best reported yield – yield) 5. Poverty (we use as proxy Colombia’s Index of Insufficient Provision of Basic Needs- NBI 2010) 6. Protein intake 1. Setting up the process (cont.)
  • 15.
    AHP representation ofthe survey Goal, Priority Criterion 1 Criterion 2 Criterion n… Indicator a Indicator b Indicator c Indicator d Indicator x… Final Objective Evaluation Criteria Indicators Improvement of socio- economic conditions in rural Colombia 1. Contribution to poverty reduction 2. Increase in food security Stunting Area Yield Y Gap Poverty Protein
  • 16.
    1. Evaluation Criteriaweights Respondents assign to each evaluation criteria a percentage weight according to their importance to achieve the proposed goal. The sum of percentages should be 100%. 2. Indicators weights Respondents assess the importance of each strategy (represented by the indicators) in a 1-5 scale, where 1 least important, and 5 most important. Criteria Percentage Poverty reduction Food security Multicriteria survey Strategies Criteria Poverty reduction Food security Stunting Harvested area Yield Yield gap Poverty Protein intake
  • 17.
     We simulated200 responses to the multicriteria survey.  For criteria assessment responses following a normal distribution with average equal to 60% and 40% , for Poverty Reduction and Food Security, respectively, and a standard deviation equal to 10% were generated.  The answers of each hypothetical respondent were normalized so that their sum equal 100%.  For strategies assessment, a sequence of numbers between 1 and 6 is created, and a sample with replacement of 200 is taken. The responses are then truncated at 5.  We set the limit of the sampling to 6 in order to get average valuations close to 5 for strategies with very high importance. Methodology for data generation
  • 18.
    Poverty reduction Foodsecurity Min 18 3 Mean. 40 36 Max. 70 61 Summary statistics of the Criteria Assessment Source: Own calculations with simulated data. Criteria Stunting among children Harvest ed area Yield Poverty Protein intake Poverty reduction Min 0 3 0 4 0 Mean 0 4 0 5 0 Max. 0 5 0 5 0 Food security Min 2 0 2 0 4 Mean 3 0 3 0 5 Max. 4 0 4 0 5
  • 19.
  • 20.
  • 21.
  • 22.
  • 23.
    Aggregated Map forsurvey Goal The strategic Geographic areas Where bean production Impacts the achievement Of the Goal of the survey Are:
  • 24.
    The AHP methodallows for an structured discussion of complex problems, by dissagregating them into different levels of importance or scale. The Siempre package, by utilizing an AHP methodology aided by GIS tools, allows decision makers to utilize extensive amounts of informationin the form of maps to help the decision making process. The priority setting of options of different nature or measurement parametrs is simplified by this package Conclusions
  • 25.
    Siempre can beused in an iterive way to do sensitivity analysis for different conditions or values for options or strategies, as the geographic impacts can be displayed inmediately on maps. Conclusions (cont.)
  • 26.
    Thank you! Gracias Siempre! Betaversion: http://siempre.ciat.cgiar.org/