Downloaded 22 times


![Sample Business Metrics
Hours per week to execute a process
Number of Proposals/Contracts per year
Number of “[My Organization]-All” emails
Number of email attachments
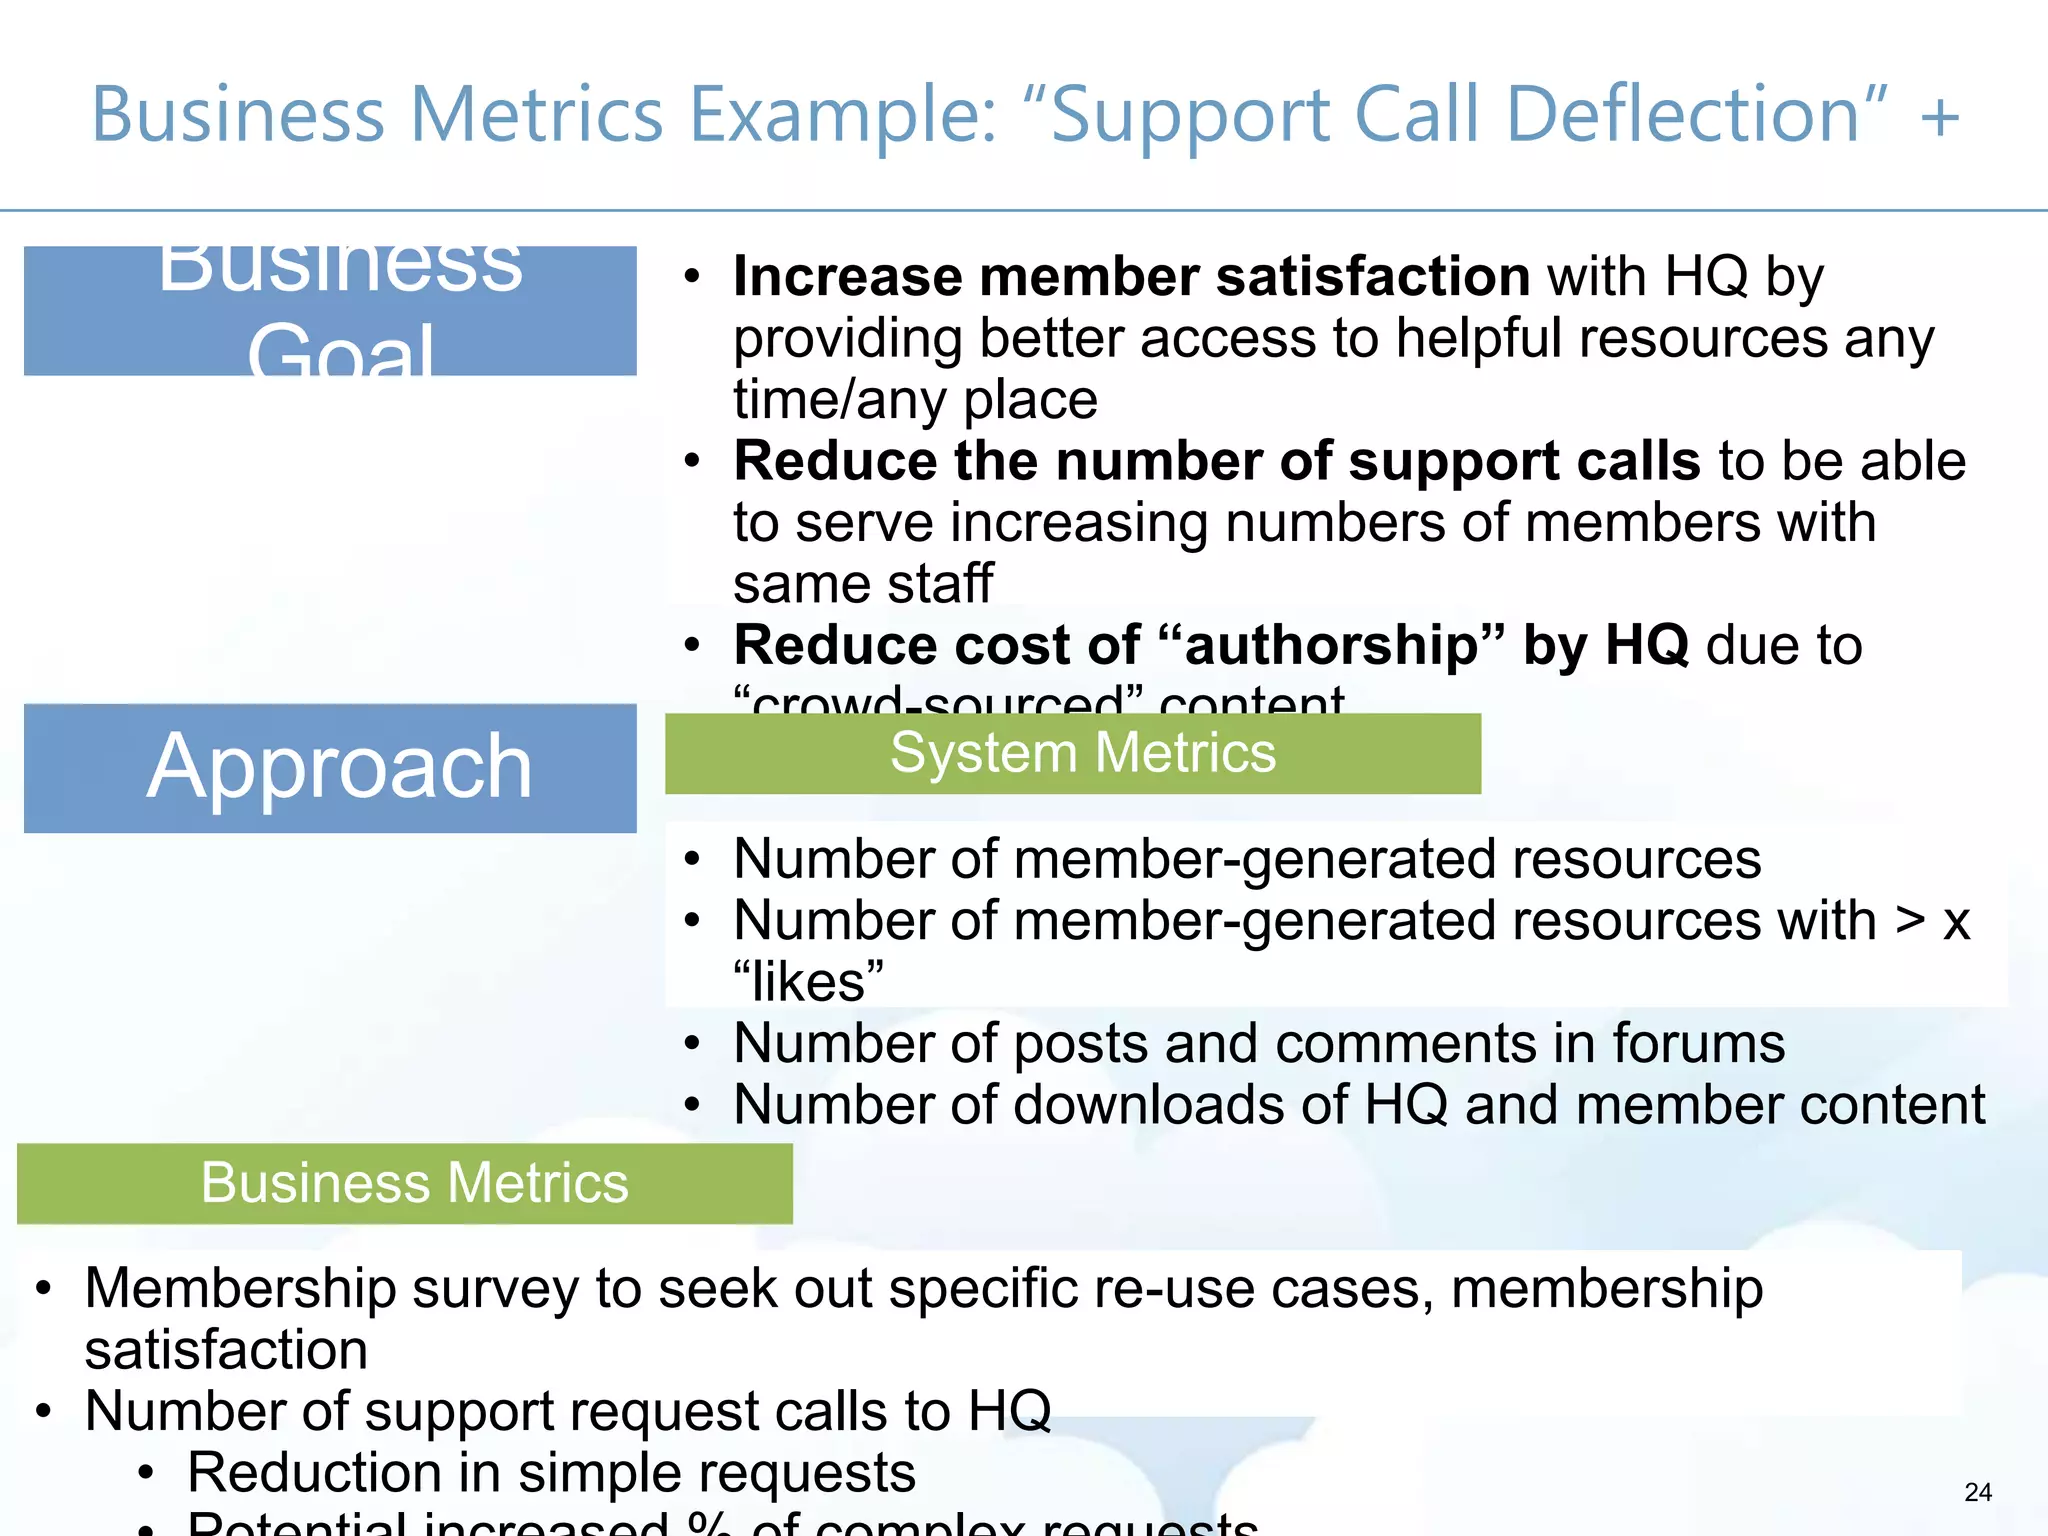
Call center or support call deflection
Average application training costs
Cost savings to retire a legacy application
23](https://image.slidesharecdn.com/sharepointsummitmetricshanley-130605125909-phpapp02/75/SharePoint-Moneyball-The-Art-and-Science-of-Winning-the-SharePoint-Metrics-Game-23-2048.jpg)


![51
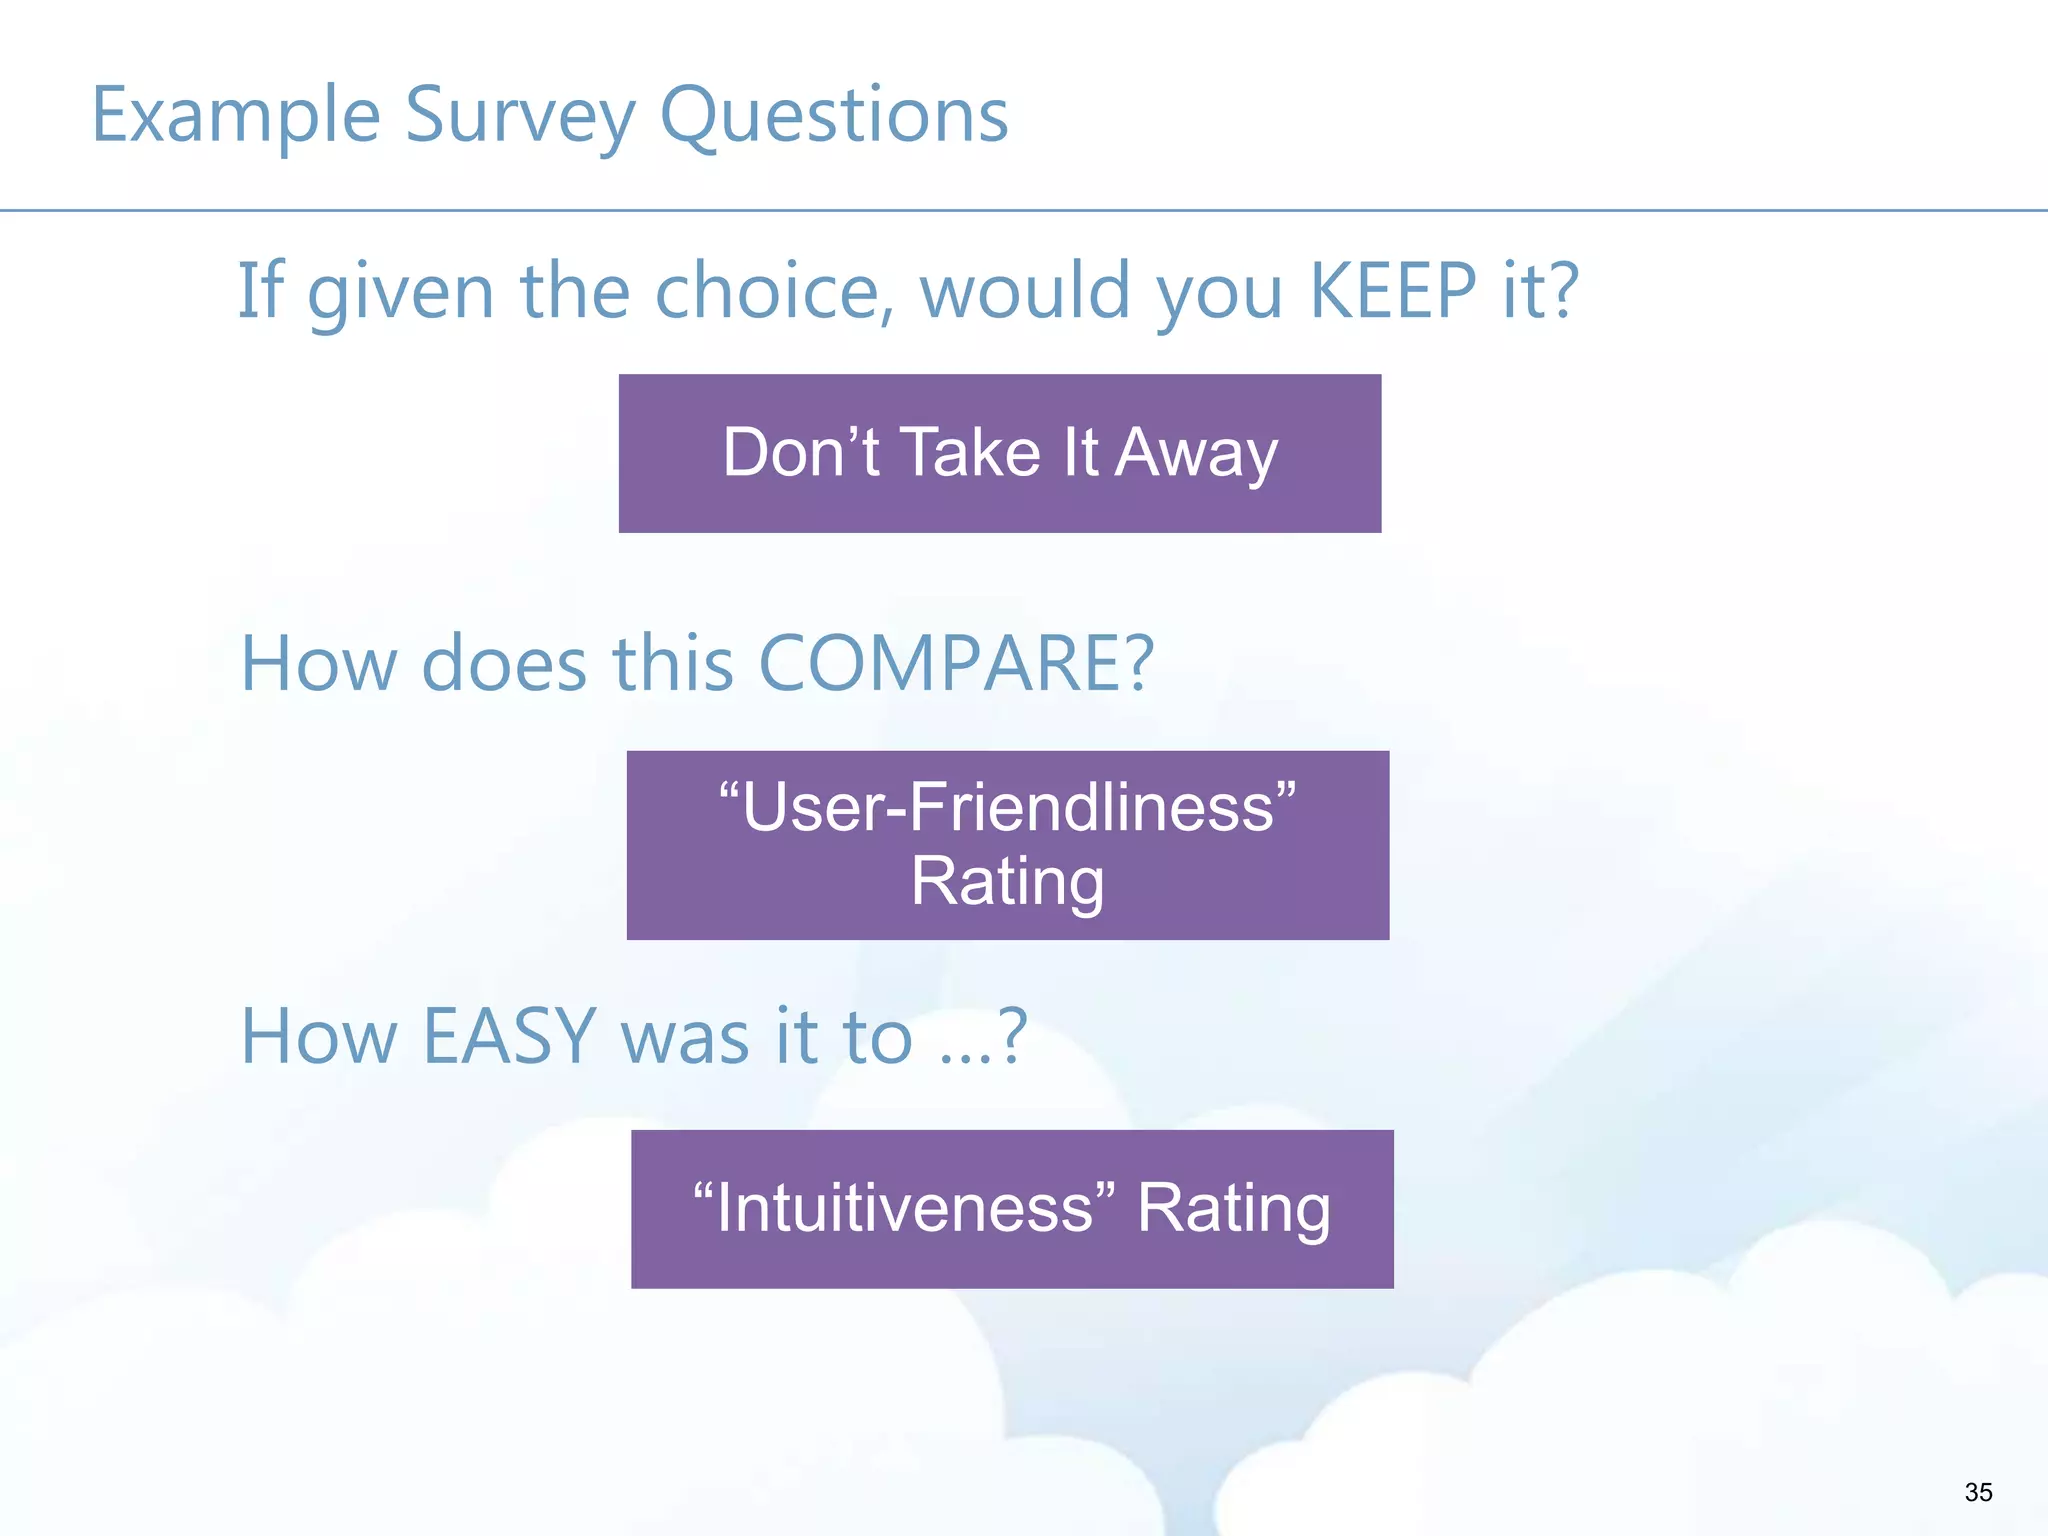
Survey Example: Post-Pilot Usability
Usability Question Metric
If presented the choice, do you want to keep the
solution?
―Don’t Take it
Away‖
Don't take it away Take it away
Usability/friendliness - how does the usability of this
solution compare to other solutions you use on a
regular basis?
―User
Friendliness
Rating‖
Much easier to
use
Easier to use
About the same
Harder to use
Much harder to use
How easy and intuitive was the solution to use for
each of the following [specific task]?
―Intuitiveness
Rating‖
Very easy
Easy
Moderate
Difficult
Very Difficult](https://image.slidesharecdn.com/sharepointsummitmetricshanley-130605125909-phpapp02/75/SharePoint-Moneyball-The-Art-and-Science-of-Winning-the-SharePoint-Metrics-Game-51-2048.jpg)

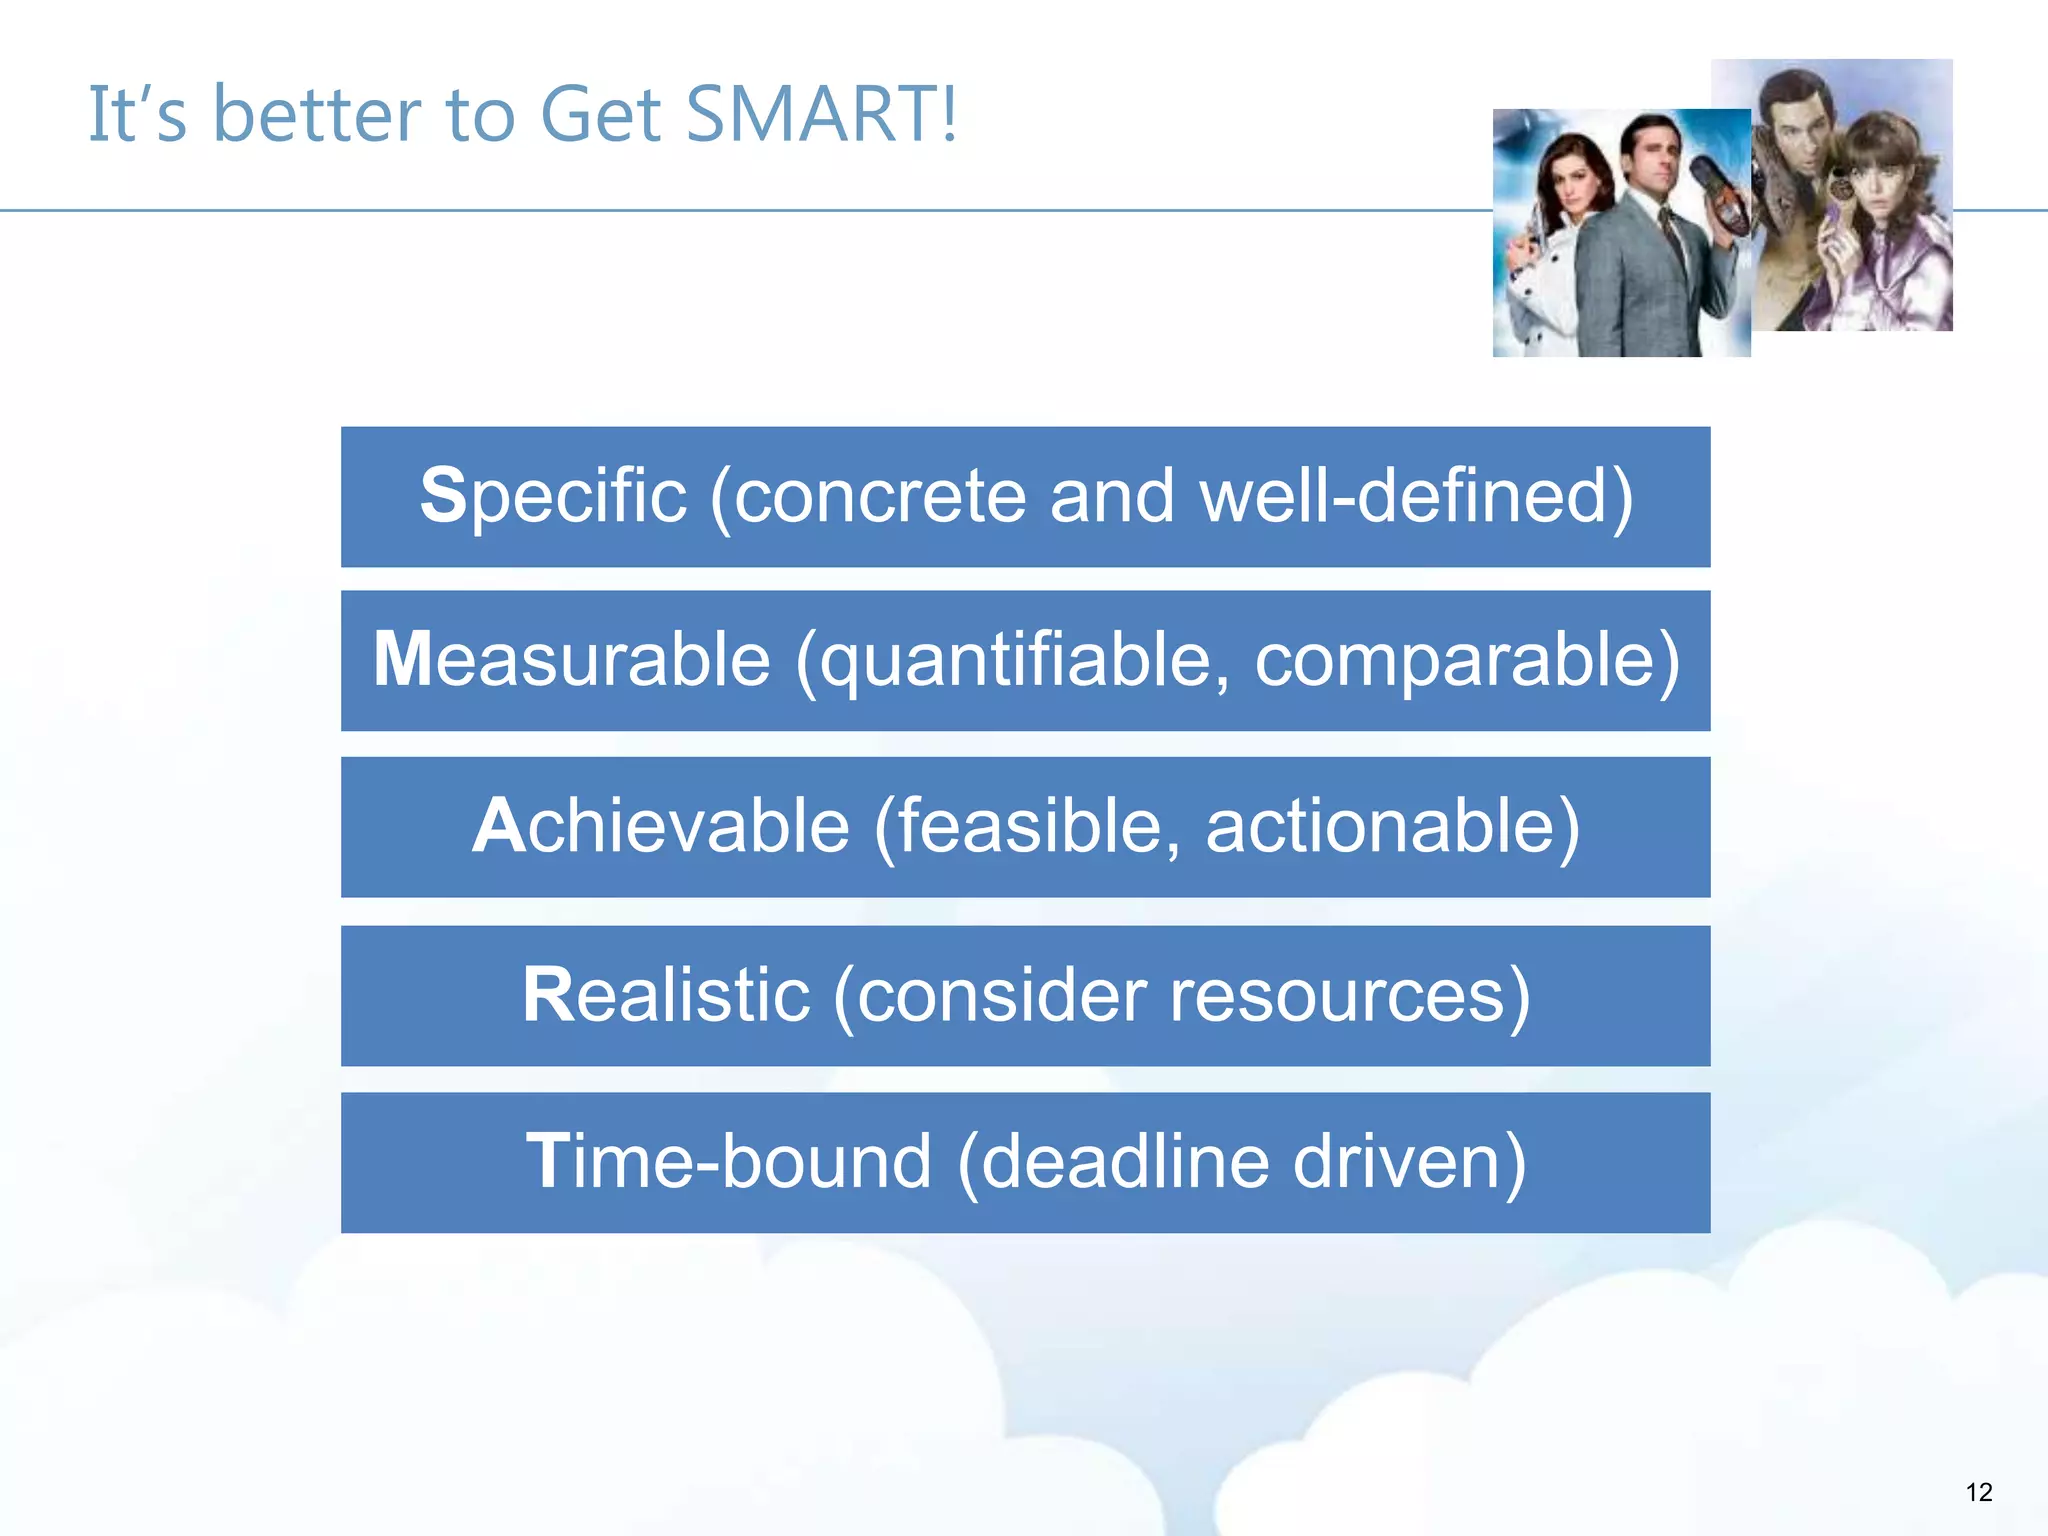
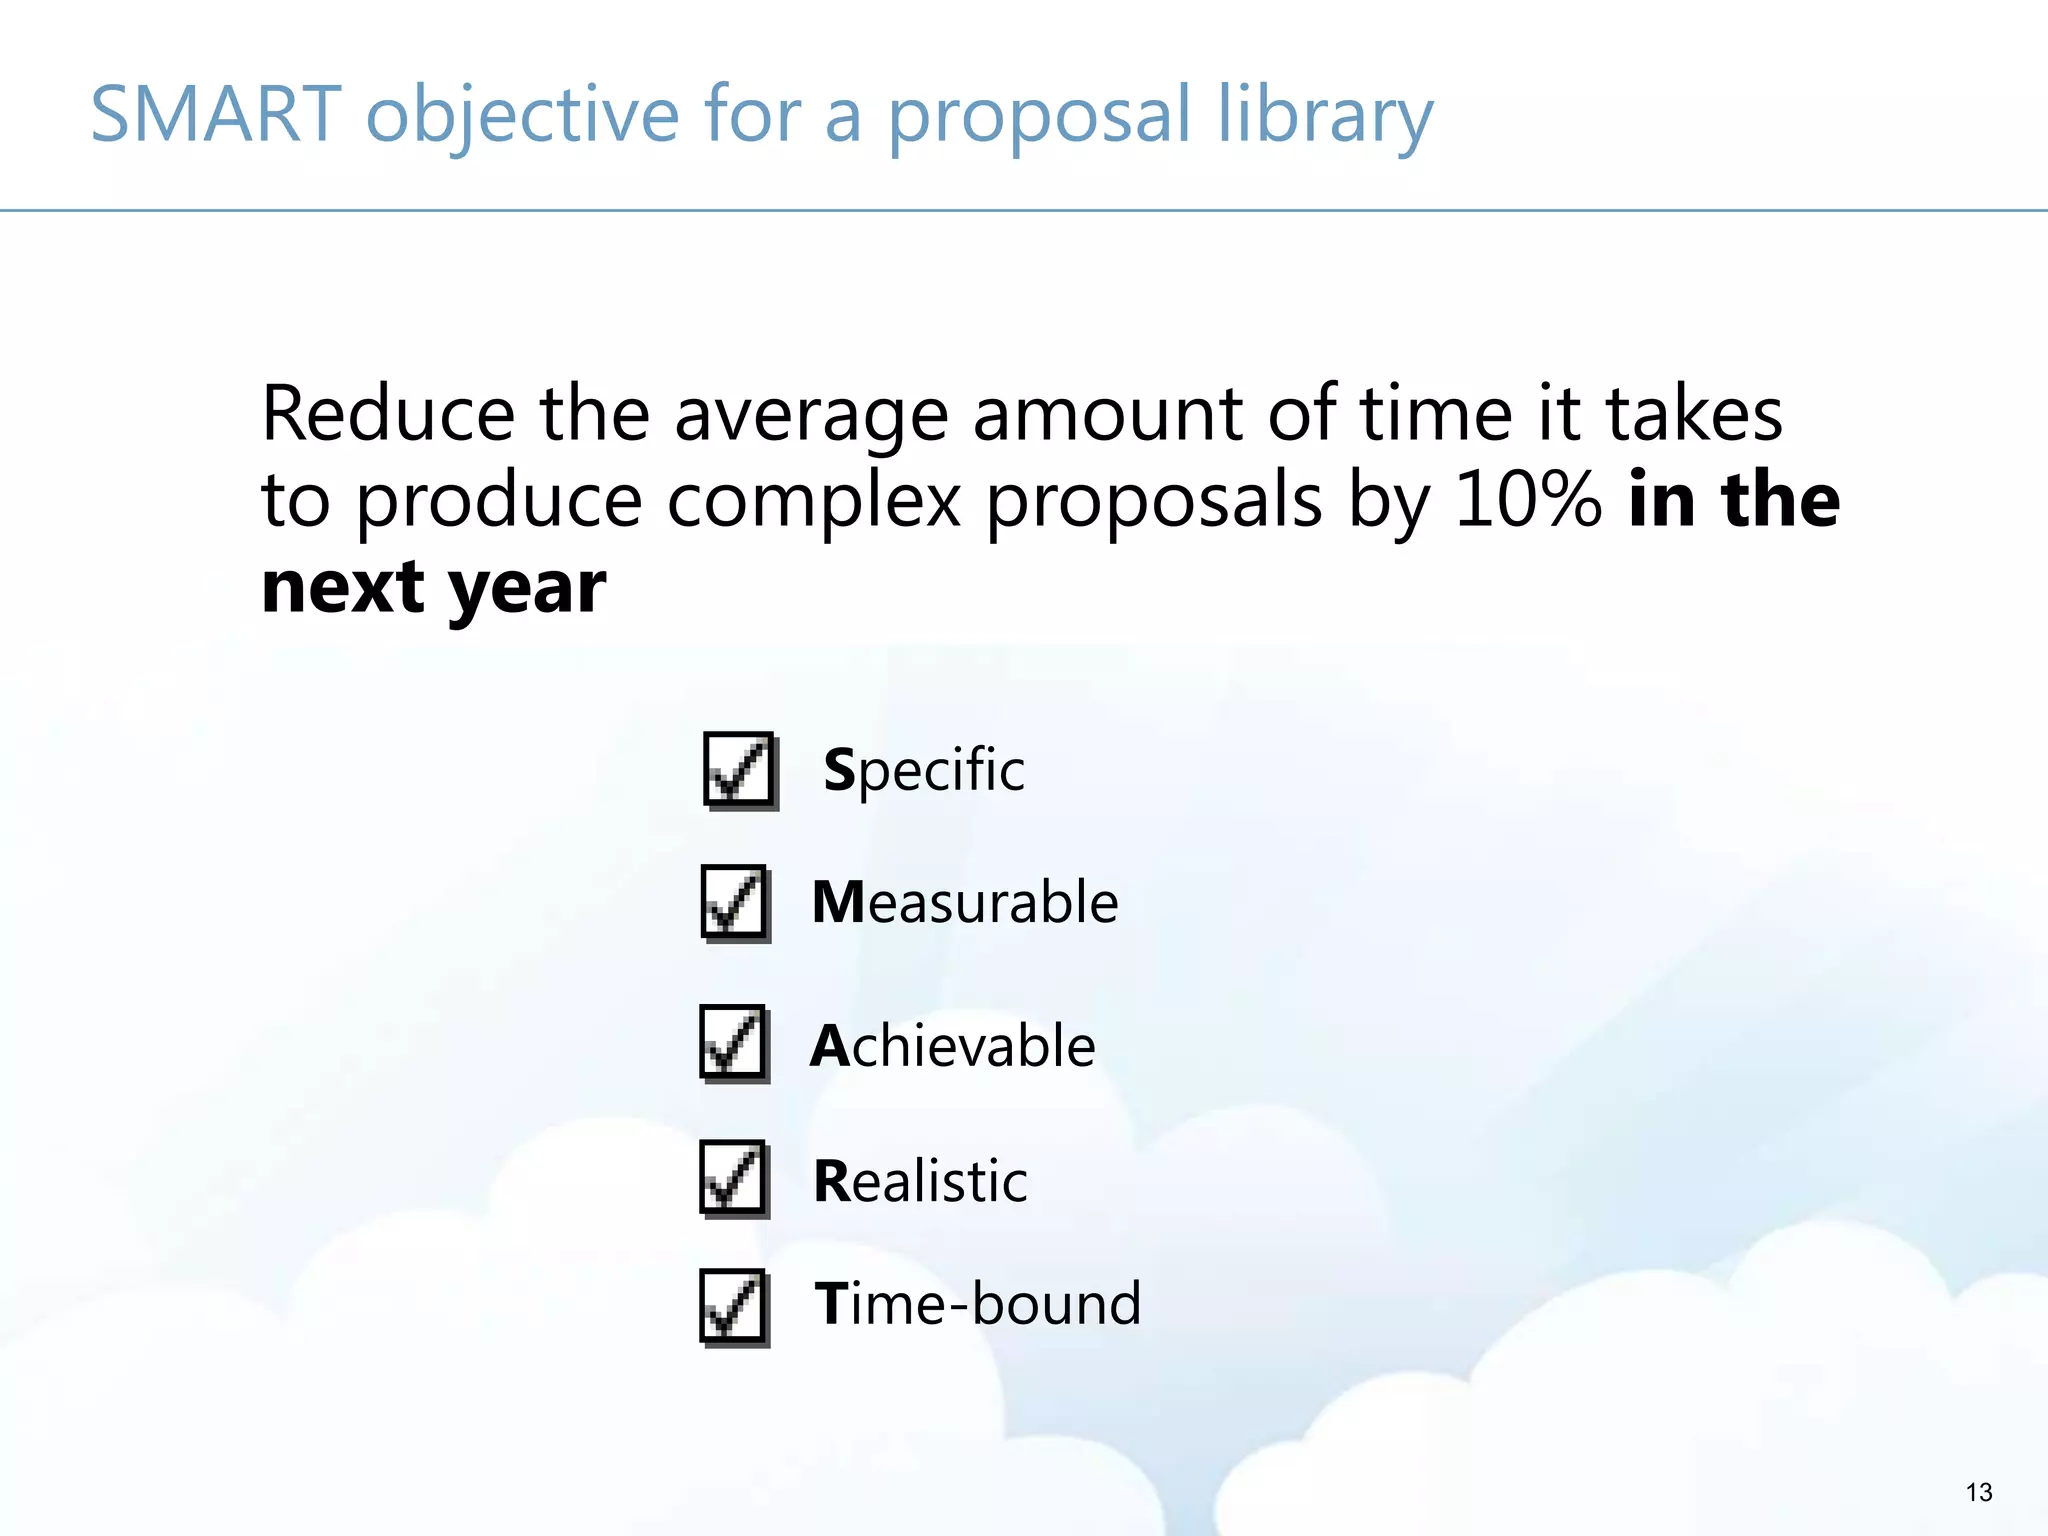
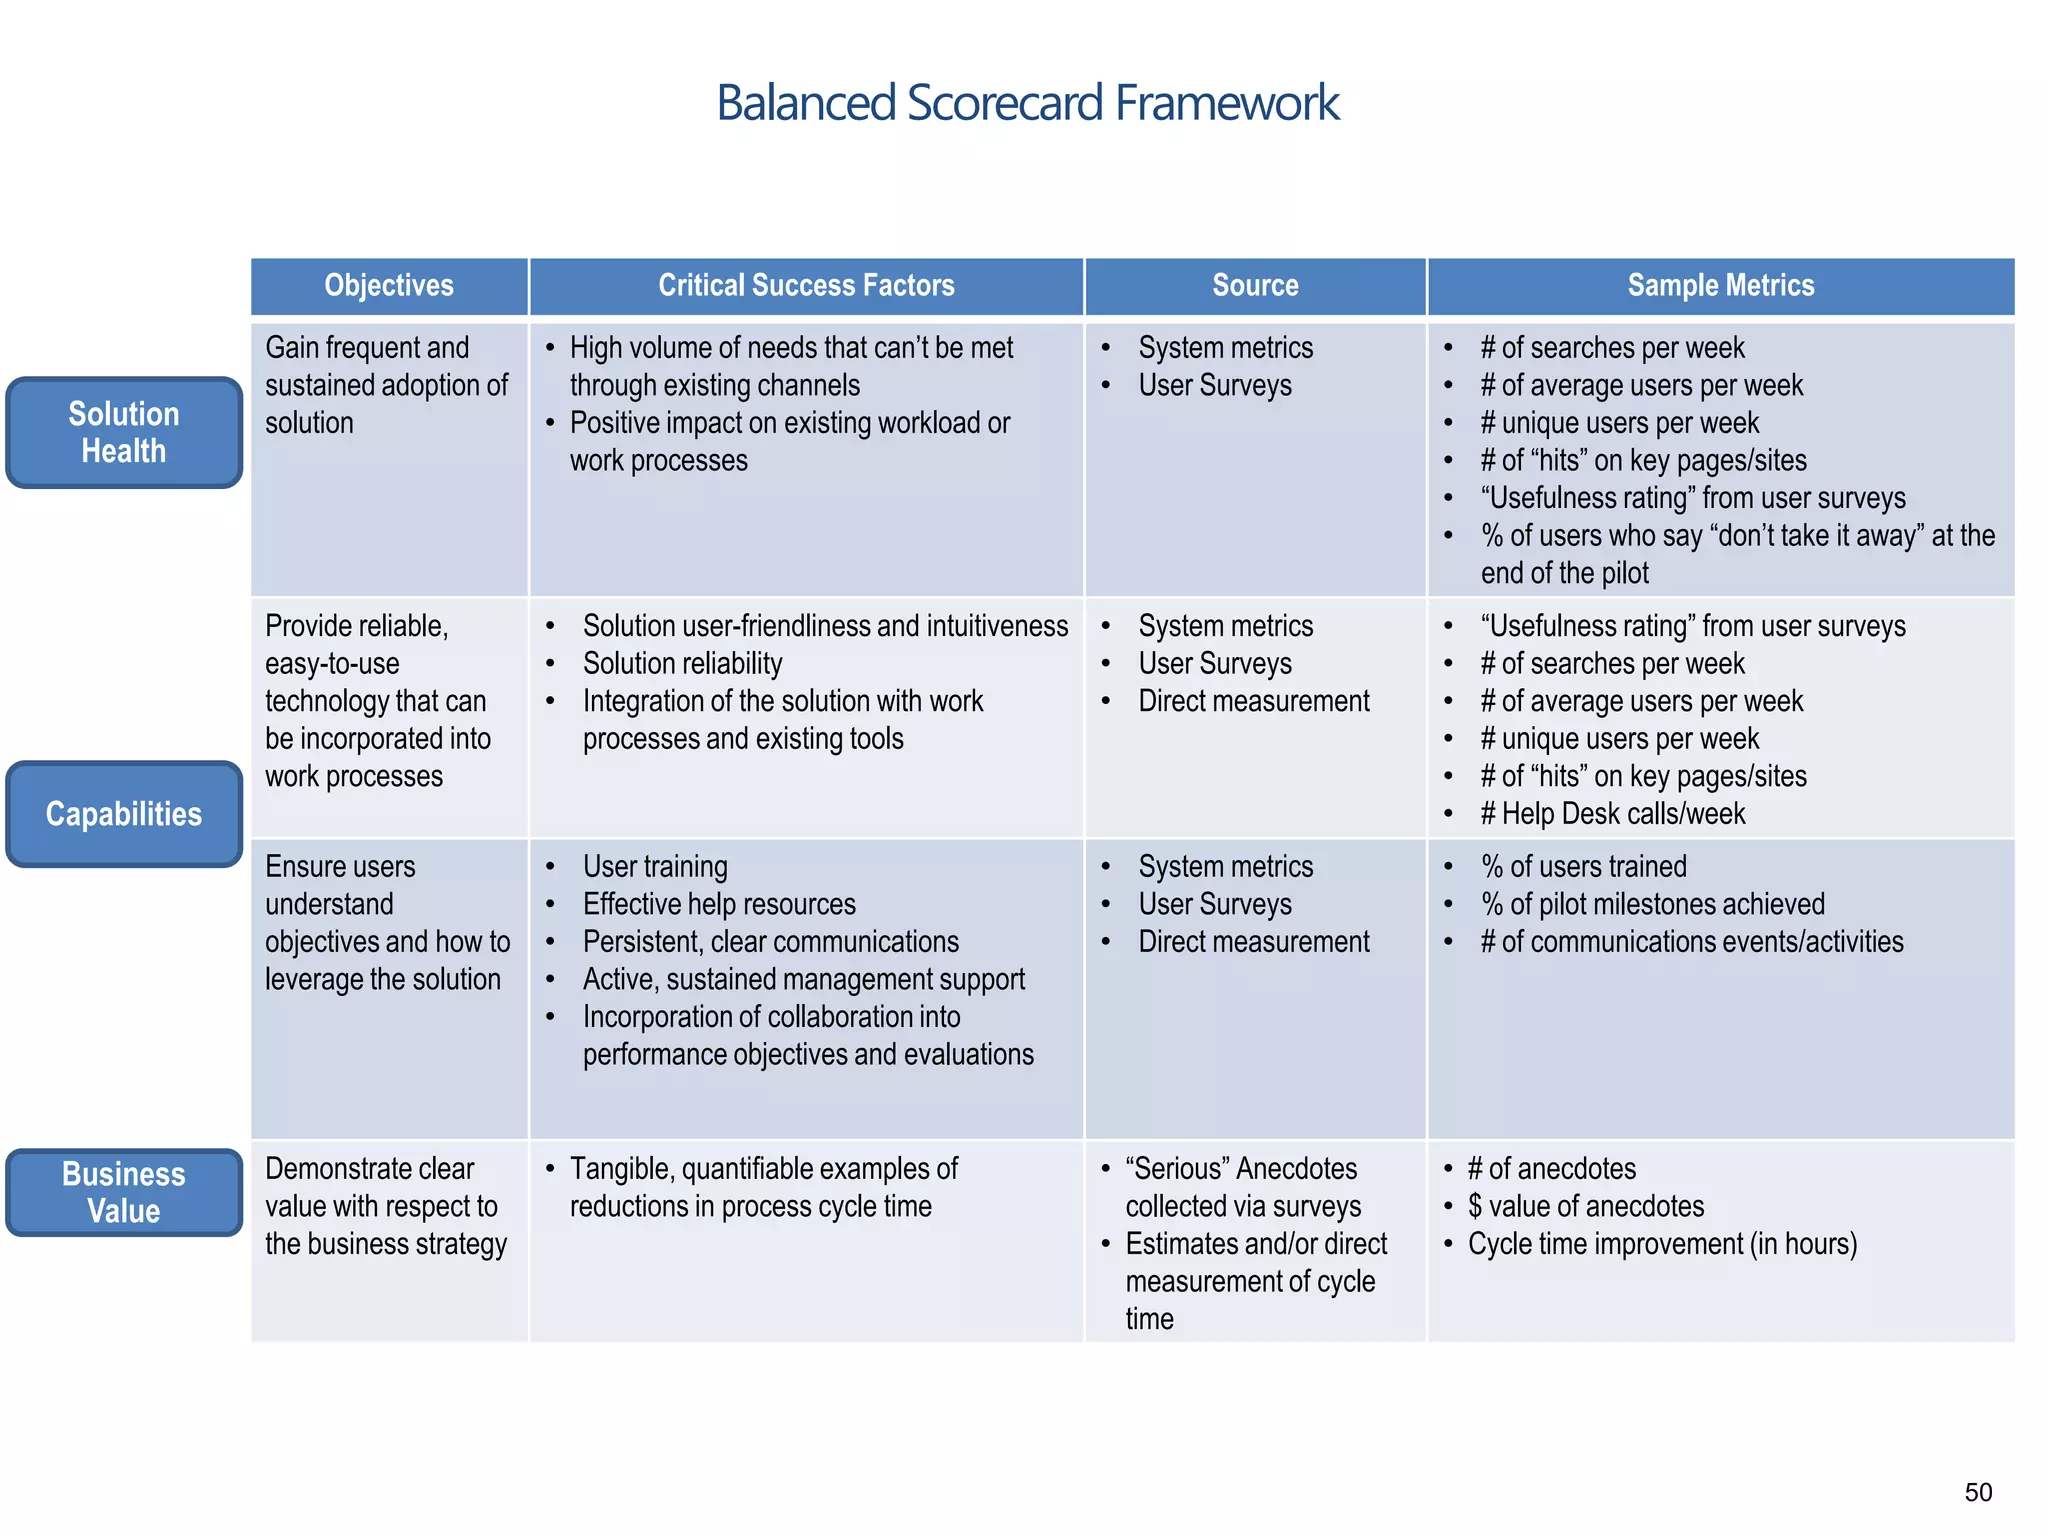
The document outlines the importance of measuring SharePoint metrics to improve business outcomes through a structured approach. It discusses setting SMART objectives, identifying stakeholders, collecting both quantitative and qualitative metrics, and using findings for decision-making. The text emphasizes the need for accountability in monitoring metrics and adapting strategies based on analysis to ensure ongoing success and user satisfaction.


