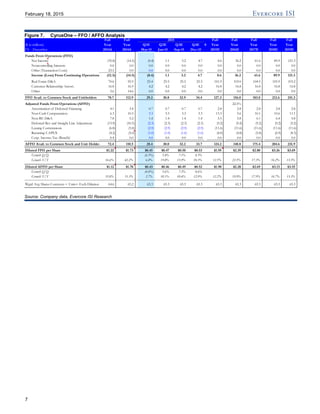
SlideShare a Scribd company logo
Telecommunications | Data Center Services
February 18, 2015
CYRUSONE, INC.
CONE | $30.16
BUY | TARGET PRICE: $35.00
Earnings Report
Jonathan Schildkraut
212 497 0864
jonathan.schildkraut@evercoreisi.com
Robert Gutman
212 497 0877
robert.gutman@evercoreisi.com
Company Statistics
52-Week Range: $19.52 - $29.40
Market Capitalization (M): $1,979
Enterprise Value (M): $2,669
Shares Outstanding (M): 66
Average 10-Day Volume (000s): 324
Dividend Yield: 4.2%
Fiscal Year End Dec
Earnings Summary
2013A 2014A 2015E
EV/EBITDA 19.2x 15.8x 14.0x
P/FFO/shr 24.8x 17.4x 15.5x
P/AFFO/shr 26.9x 17.8x 15.9x
Revenue (M) 1Q $60.1 $77.5 $87.8
2Q $63.6 $81.7 $91.7
3Q $67.5 $84.8 $87.8
4Q $72.3 $86.9 $100.2
FY $263.5 $330.9 $375.9
EBITDA (M) 1Q $31.5 $41.7 $44.4
2Q $30.8 $40.8 $46.3
3Q $36.5 $42.2 $44.4
4Q $39.9 $44.6 $50.8
FY $138.7 $169.3 $190.4
FFO/shr 1Q $0.27 $0.42 $0.45
2Q $0.25 $0.39 $0.47
3Q $0.34 $0.44 $0.45
4Q $0.37 $0.48 $0.53
FY $1.22 $1.73 $1.95
1 Year Price History
CyrusOne, Inc. vs. S&P 500 (SP50)
CONE S&P 500 (SP50)
02/14 05/14 08/14 11/14 02/15
32
30
28
26
24
22
20
18
2,300
2,200
2,100
2,000
1,900
1,800
1,700
Source: FactSet
Solid Print, Remains Undervalued
CONE reported a very strong quarter with revs, EBITDA, FFO and
AFFO ahead by 1.5%, 5.3%, 17.1% and 10.1% respectively – while also
reporting an increase in development yields to 18% (from 17% in 3Q).
For the full year they delivered revs, EBITDA, FFO and AFFO growth of
25.6%, 22.1%, 42.2% and 51.3% respectively. FY15 guidance implies
(at the mid pt), rev growth of 14.0%, EBITDA growth of 12.4% (margin
of 50.3%), and FFO p/shr growth of 12.7%. The qrtrly dividend was
increased by 50%, to $0.315 p/shr to align with a 60-70% AFFO payout
ratio in 2015. Net/net CONE continues to execute well, deliver above
market growth, and achieve industry leading development yields - yet
trades at a meaningful discount to its peers. Maintain BUY, increasing
PT to $35 (from $33).
■ Strong Print. CONE reported 4Q14 revs of $86.9MM (+2.5% Q/Q,
+20.2% Y/Y), vs. our/cons. $85.6MM / $85.7MM, EBITDA of $44.6MM
(+5.7% Q/Q, +11.8% Y/Y), vs. our/cons. $42.4MM / $42.9MM, diluted
FFO per share of $0.48 (+8.1% Q/Q, +30.9% Y/Y), vs. our/cons.
$0.41 / $0.42, and diluted AFFO per share of $0.46 (+2.4% Q/Q,
+41.8% Y/Y), vs. our/cons. $0.41 / $0.38
■ Solid 4Q Leasing, FY14 +33.3% Y/Y. In 4Q, CONE leased 44K CSF,
inline with recent quarters and capping off FY14 leasing of 236K
CSF, +33.3% Y/Y. The largest proportion of leasing occurred in Dallas
(roughly 24K CSF), while the new Phoenix facility launched with 6.5K
CSF in addition to the 30K CSF pre-leased, roughly 7.0K CSF was
scattered throughout the existing footprint, and we estimate 6.5K CSF
were leased at the NoVA facility launched in 1Q. Of the $11.4MM of
annualized GAAP lease revenue signed in 4Q, $3.7MM commenced
within the quarter while $7.6MM is expected to commence in 1Q15.
■ Dispelled Fear of Energy Sector Overhang. As the price of crude oil
plummeted in 4Q, investors raised concerns regarding CONE’s high
exposure to the energy sector (and Texas). In the 4Q presentation,
we believe mgmt provided data largely dispelling these concerns.
■ Development +54.1% Y/Y, Expansion Increasing. CONE delivered
185K gross CSF of space in 2014, with the delivery of 37K CSF in
Phoenix in 4Q. This compares to 120K CSF delivered in 2013, an
increase of 54.1%. Looking to 2015, the company has 212K CSF
under construction with the expectation of bringing 275-325K CSF
online by year-end, bringing the total to roughly 1.5MM CSF.
■ FY15 Guide. Mgmt provided FY15 guidance which implies (at the
midpoint), revenue growth of 14.0%, EBITDA growth of 12.4%
(margin of 50.3%), and FFO per share growth of 12.7%. Factored into
expectations are (1) front-end loaded, elevated churn, (2) the negative
impact on margins due to the rapid growth in metered power and cost
of opening new facilities, (3) elevated stock-based compensation.
■ Maintain BUY, PT to $35 (from $33). Our DCF-based PT implies P/
FFO multiples of 14.6x 16E and 12.5x 17E vs. current multiples of
15.5x 15E and 12.6x 16E. On a P/AFFO basis, our PT implies 15.4x
16E and 13.0x 17E vs. current multiples of 15.9x 15E and 13.2x 16E.
Please see the analyst certification and important disclosures on page 10 of this report. Evercore ISI and affiliates do and seek to do business
with companies covered in its research reports. Investors should be aware that the firm may have a conflict of interest that could affect the
objectivity of this report. Investors should consider this report as only a single factor in making their investment decision.
Solid Print, Remains Undervalued
CONE reported a very strong quarter with revs, EBITDA, FFO and AFFO ahead by 1.5%,
5.3%, 17.1% and 10.1% respectively – while also reporting an increase in development yields
to 18% (from 17% in 3Q). For the full year they delivered revs, EBITDA, FFO and AFFO
growth of 25.6%, 22.1%, 42.2% and 51.3% respectively. FY15 guidance implies (at the
midpoint), revenue growth of 14.0%, EBITDA growth of 12.4% (margin of 50.3%), and FFO
per share growth of 12.7%. The quarterly dividend was increased by 50%, to $0.315 per
share to align with a 60-70% AFFO payout ratio in 2015. Net/net CONE continues to execute
well, deliver above market growth, and achieve industry leading development yields - yet
trades at a meaningful discount to its peers. Maintain BUY, increasing PT to $35 (from $33).
Strong Print
Figure 1. Comparison of Actual Results to Estimates and Prior Period Historicals
Source: Company data, Evercore ISI Research
 Strong Print. In 4Q, revenue was aided by higher metered power (13.2% of total vs.
8.7% in 4Q13), while margins benefitted from seasonally lower electricity costs. The
FFO/AFFO beat was driven by higher margins and lower interest expense in the quarter.
Lastly, the company increased the quarterly dividend by 50% - in order to be inline with
the targeted 60-70% AFFO payout ratio (2015).
 Solid 4Q Leasing, FY14 +33.3% Y/Y. In 4Q, CONE leased 44K CSF, inline with recent
quarters and capping off FY14 leasing of 236K CSF, +33.3% Y/Y. The largest proportion
of leasing occurred in Dallas (roughly 24K CSF), while the new Phoenix facility launched
with 6.5K CSF in addition to the 30K CSF pre-leased, roughly 7.0K CSF was scattered
throughout the existing footprint, and we estimate 6.5K CSF were leased at the NoVA
facility launched in 1Q. This would bring the facility to 61% leased (from 40% pre-leased)
– though mgmt will provide actual numbers in the 1Q print. Of the $11.4MM of annualized
GAAP lease revenue signed in 4Q, $3.7MM commenced within the quarter while $7.6MM
is expected to commence in 1Q15.
- Backlog Unchanged. Commencement backlog was unchanged Q/Q at $9.2MM of
annualized GAAP revenue – with 99% expected to commence by 1Q15.
Figure 2. Leasing Trend
Source: Company data, Evercore ISI Research
4Q14
($ in M M s except per share data) Actual Estimate Difference Result Q/Q Result Y/Y
Revenue (MM) $86.9 $85.6 1.5% $84.8 2.5% $72.3 20.2%
EBITDA (MM) $44.6 $42.4 5.3% $42.2 5.7% $39.9 11.8%
EBITDA Margin 51.3% 49.5% 49.8% 55.2%
Incremental EBITDA Margin 51.3% 20.0% 54.0% 70.8%
FFO (MM) $31.2 $26.6 17.2% $28.9 8.0% $23.6 32.2%
Diluted FFO per share $0.48 $0.41 17.1% $0.44 7.9% $0.37 30.8%
AFFO (MM) $29.8 $27.0 10.2% $29.1 2.4% $20.8 43.3%
Diluted AFFO per share $0.46 $0.41 10.1% $0.45 2.3% $0.32 41.7%
3Q14 4Q13
(CSF SFT 000s) 2013A 1Q14A 2Q14A 3Q14A 4Q14A 2014A
CSF Leases Signed 177.0 100.0 59.0 33.0 44.0 236.0
Q/Q% 112.8% (41.0%) (44.1%) 33.3%
Y/Y% 60.9% 222.6% 59.5% (46.8%) (6.4%) 33.3%
February 18, 2015
2
 Now Breaking Out Metered Power. Given the high growth in metered power sales
(driven by large deals) in 2014, and the pass through nature of this revenue (i.e. it lowers
EBITDA margin), mgmt has broken out metered power from base rent going back to
4Q13. Metered power represented 8.7% of total revenue in 2013 and has climbed
consistently to 13.2% in 4Q14 (12.3% for FY14). On a run rate analysis, CONE added
$15.6MM of metered power revenue in 2014, over the 3Q annualized run rate which will
cause a drag on margins in 2015. The 2015 forecast calls for much lower growth in
metered power (and less drag on margins going forward) as the company does not
anticipate the same pace of large deals.
Figure 3. Metered Power Growth
Source: Company data, Evercore ISI Research
- Building in Escalators. In 4Q, over 72% of new contracts had escalators with a
weighted average of 2.7% Mgmt estimates over 30% of the contracts now have
annual price escalators built in - vs. zero only two years ago.
- Growth Coming From Embedded Base, and Fortune 1000 Logos. In 4Q, 81% of
MRR signed came from the embedded base of customers vs. the TTM average of
55%. In addition, CONE added three new Fortune 1000 logos in 4Q, bringing the
total to 144 (vs. 129 4Q13), and total customer count to 669 (vs. 612 4Q13).
- New Leases Taking IX Services. Mgmt estimates 80% of new leases continue to
include National IX services – which boost average monthly rent by roughly 30%.
Multisite deployments generate over 60% of revenue (vs. 50% in 2012), which we
estimate comes from roughly 20% of the customer base. We believe that
connectivity and services provided by the National IX are accelerating these trends
by enabling fully outsourced solutions to enterprises which replicate their existing
multisite infrastructure.
 Renewals and Churn Inline, But 3% Churn Expected in 1Q. CONE renewed $20MM
of annual revenue, with $/kW down 1.0% on a cash basis, consistent with prior quarters.
We view positively given CONE already high yield /sft. Churn declined Q/Q to 1.7% (3Q:
2.9%), though is expected to increase to 3.0% in 1Q15 due to contract terminations and
renegotiations the occurred in 4Q14.
 Development +54.1% Y/Y, Expansion Increasing. CONE delivered 185K gross CSF of
space in 2014, with the delivery of 37K CSF in Phoenix in 4Q. This compares to 120K
CSF delivered in 2013, an increase of 54.1%. Looking to 2015, the company has 212K
CSF under construction with the expectation of bringing 275-325K CSF online by
yearend, bringing the total to roughly 1.5MM CSF. In addition, the company anticipates
the purchase or construction of 300-400K sft of powered shell for future development,
and expects to close on the purchase of 175K sft shell in Austin near-term. Mgmt sees
the opportunity to reach 2.0MM CSF at roughly $5MM per MW with existing undeveloped
powered shell space. Longer-term, including all land yet to be developed, this figure
would increase to $5.1MM CSF (at roughly $6-7MM per MW).
$MMs
4Q13 Metered Power Rev $6.3
Annualized 25.2
FY14 Reported 40.8
Incremental $15.6
4Q14 Metered Power Rev $11.5
Annualized 46.0
FY15 Guide (Midpoint) 50.5
Incremental MP Rev $4.5
February 18, 2015
3
- Development Yields Increasing. In 4Q 14, CONE achieved development yield of
18%, an increase from 17% in 3Q14. Since 1Q13 the company has invested roughly
$400MM while maintaining yields of 16-19%. Notably, the calculation includes
unstabilized properties – excluding which yields would be >20%. In addition, mgmt
sees the opportunity to improve on these figures over time driven by leveraging fixed
costs across the portfolio.
 Dispelled Fear of Energy Sector Overhang. As the price of crude oil plummeted in 4Q,
investors raised concern regarding CONE’s high exposure to the energy sector (and
Texas). In the 4Q presentation, we believe mgmt provided data largely dispelling these
concerns as (1) as U.S. GDP growth turned negative 2008-2010 (and oil traded at $30),
the data center services still grew at an 18-20% pace, (2) data center service costs
represent a tiny fraction of operating expenses for CONE’s top 10 Oil & Gas customers
(roughly 0.006%), (3) growth from the energy vertical remains consistent contributing
$125-135K of new MRR per quarter, (4) revenue base has become increasing diversified
with energy representing 28% of ABR vs. 37% two years ago, and (5) the Texas
economy remains strong as oil taxes are 4-6% of the tax base vs. 13% in the 1980’s –
while the state is the headquarters for over 25 non-Oil & Gas Fortune 500 companies.
FY15 Guidance
Mgmt provided FY15 guidance which implies (at the midpoint), revenue growth of 14.0%,
EBITDA growth of 12.4% (margin of 50.3%), and FFO per share growth of 12.7%. Factored
into expectations are (1) front-end loaded, elevated churn, (2) the negative impact on margins
due to the rapid growth in metered power and cost of opening new facilities, (3) elevated
stock-based compensation.
 3% Churn in 1Q. Mgmt estimates 3% churn in 1Q due to the terminations or
renegotiation of leases in 4Q by three customers. At 3% of annualized base rent, we
estimate the full cost of the 1Q churn to be $9.0 MM (3% of 4Q14 annualized base rent).
We would consider half of this amount as extraordinary – above the 1-2% ordinary churn
– though a real cost in 2015.
 EBITDA Margin ~50%. EBITDA margin is expected to decline to roughly 50% in FY15,
from 51.2% in FY14 due to (1) the dilutive effect of increased (pass through) metered
revenue, and (2) expansion drag from the opening of new facilities.
 FFO to Reflect Stock Based Compensation. Stock based compensation is expected to
peak in 2015 due to the vesting period of grants associated with the company’s IPO.
Stock based comp is expected to be $3MM higher Y/Y – and then decline thereafter.
Figure 4. FY15 Guidance
Source: Company data, Evercore ISI Research
Guidance Prior
$MMs FY15 Midpoint 2014A Y/Y% EVR Consensus
Base Revenue $322-332 $327.0 $290.0 12.8%
Metered Power Reimb. $48-53 $50.5 $41.0 23.2%
Total Revenue $370-385 $377.5 $331.0 14.0% $378.2 $380.3
Adjusted EBITDA $185-195 $190.0 $169.0 12.4% $194.6 $194.6
Margin % 50.3% 51.5% 51.2%
Norm. FFO per share $1.90-2.00 $1.95 $1.73 12.7% $2.03 $1.98
Capital Expenditures $215-240 $227.5 $284.0 (19.9%) $231.8 $220.2
February 18, 2015
4
Change in Estimates
Figure 5. Change in Estimates
Source: Company data, Evercore ISI Research
Valuation
 Maintain BUY, PT to $35 (from $33). Given above market growth, increasing yields and
low-cost expansion opportunities we are increasing our YE15 PT to $35 from $33.Our
DCF-based PT implies EV/EBITDA multiples of 14.1x 16E and 12.3x 17E, vs. current
multiples of 14.0x 15E and 12.1x 16E. On a P/FFO basis, our PT implies 14.6x 16E and
12.5x 17E vs. current multiples of 15.5x 15E and 12.6x 16E. On a P/AFFO basis, our PT
implies 15.4x 16E and 13.0x 17E vs. current multiples of 15.9x 15E and 13.2x 16E.
 Risks: (1) We believe the market for wholesale colocation space is becoming
increasingly competitive; (2) CONE is exposed to supply and demand dislocations in
markets; (3) CBB owns 43.7% of the company’s combined shares and operating units.
1Q15 2015 2016
($ in M M s except per share data) Current Prior Change Current Prior Change Current Prior Change
Revenue (MM) $87.8 $89.1 (1.5%) $375.9 $378.2 (0.6%) $432.7 $431.8 0.2%
EBITDA (MM) $44.4 $44.8 (0.8%) $190.4 $194.6 (2.2%) $221.3 $224.8 (1.6%)
EBITDA Margin 50.6% 50.3% 50.6% 51.4% 51.1% 52.1%
Incremental EBITDA Margin (175.0%) 50.0% 46.8% 56.7% 54.5% 56.4%
FFO (MM) $29.2 $29.3 (0.6%) $127.3 $132.6 (4.0%) $156.0 $159.7 (2.3%)
Diluted FFO per share $0.45 $0.45 (0.6%) $1.95 $2.03 (4.1%) $2.39 $2.45 (2.4%)
AFFO (MM) $28.4 $30.5 (6.9%) $124.2 $137.4 (9.6%) $148.8 $164.2 (9.4%)
Diluted AFFO per share $0.43 $0.47 (7.0%) $1.90 $2.11 (9.7%) $2.28 $2.52 (9.4%)
February 18, 2015
5
Model
Figure 6. CyrusOne – Income Statement
Source: Company data, Evercore ISI Research
Full Full 2015 Full Full Full Full Full
($ in millions) Year Year Q1E Q2E Q3E Q4E Year Year Year Year Year
FY - December 2013A 2014A Mar-15 Jun-15 Sep-15 Dec-15 2015E 2016E 2017E 2018E 2019E
Base Revenue $290.1 $78.6 $80.2 $83.9 $86.9 $329.6 $379.4 $427.5 $477.1 $526.6
Metered Power Reimbursements 40.8 9.2 11.6 12.4 13.3 46.4 53.3 60.1 67.0 73.9
TOTAL REVENUE $263.5 $330.9 $87.8 $91.7 $96.3 $100.2 $375.9 $432.7 $487.5 $544.1 $600.6
Growth Q/Q 1.0% 4.5% 5.0% 4.0%
Growth Y/Y 19.3% 25.6% 13.3% 12.3% 13.6% 15.3% 13.6% 15.1% 12.7% 11.6% 10.4%
OPERATING EXPENSES
Rental Property Operating & Maintenance 93.2 124.5 33.7 35.3 36.8 38.3 144.1 164.2 180.6 196.1 213.2
Sales and Marketing 10.6 12.8 2.7 2.9 3.0 3.1 11.7 13.3 14.7 15.9 17.3
G&A 21.7 24.3 6.9 7.3 7.6 7.9 29.7 33.8 37.2 40.4 43.9
Other (0.7) 0.0 0.0 0.0 0.0 0.0 0.0 0.0 0.0 0.0 0.0
TOTAL OPERATING EXPENSES 124.8 161.6 43.3 45.5 47.4 49.3 185.6 211.4 232.5 252.4 274.5
EBITDA $138.7 $169.3 $44.4 $46.3 $48.9 $50.8 $190.4 $221.3 $255.1 $291.7 $326.1
EBITDA Margin 52.6% 51.2% 50.6% 50.4% 50.8% 50.7% 50.6% 51.1% 52.3% 53.6% 54.3%
Incremental EBITDA Margin 75.6% 45.4% (175.0%) 10.0% 25.0% 10.0% 46.8% 54.5% 61.5% 64.7% 60.9%
Depreciation & Amortization 95.2 118.0 31.0 31.0 31.1 31.1 124.2 125.6 127.5 129.0 125.8
Stock-based Comp 6.3 10.3 3.3 3.3 3.3 3.3 13.3 9.6 10.1 10.6 11.1
Other 25.6 1.0 0.0 0.0 0.0 0.0 0.0 0.0 0.0 0.0 0.0
EBIT 11.6 40.0 10.1 11.9 14.5 16.3 52.8 86.1 117.5 152.0 189.2
Interest Income 0.0 0.0 0.0 0.0 0.0 0.0 0.0 0.0 0.0 0.0 0.0
Interest Expense 43.7 39.5 10.3 10.5 10.9 11.4 43.0 48.7 54.7 60.9 66.7
Tax Expense 2.3 1.4 0.3 0.3 0.3 0.3 1.2 1.2 1.2 1.2 1.2
Other 1.4 13.6 0.0 0.0 0.0 0.0 0.0 0.0 0.0 0.0 0.0
Net Income / (Loss) (35.8) (14.5) (0.4) 1.1 3.2 4.7 8.6 36.2 61.6 89.9 121.3
Minority Interest 10.3 6.7 0.0 0.0 0.0 0.0 0.0 0.0 0.0 0.0 0.0
NET INCOME (25.5) (7.8) (0.4) 1.1 3.2 4.7 8.6 36.2 61.6 89.9 121.3
Adjustments 19.5 0.0 0.0 0.0 0.0 0.0 0.0 0.0 0.0 0.0 0.0
RECURRING NET INCOME (6.0) (7.8) (0.4) 1.1 3.2 4.7 8.6 36.2 61.6 89.9 121.3
Average Shares Outstanding - Basic 20.9 30.4 38.7 38.8 38.9 39.0 38.9 39.3 39.7 40.1 40.5
Average Shares Outstanding - Diluted 20.9 30.4 38.7 38.8 38.9 39.0 38.9 39.3 39.7 40.1 40.5
EPS - Basic ($0.29) ($0.26) ($0.01) $0.03 $0.08 $0.12 $0.22 $0.92 $1.55 $2.24 $3.00
EPS - Diluted ($0.29) ($0.26) ($0.01) $0.03 $0.08 $0.12 $0.22 $0.92 $1.55 $2.24 $3.00
DIVIDENDS $0.64 $0.95 $0.32 $0.32 $0.32 $0.32 $1.26 $1.37 $1.61 $1.88 $2.13
As a % of AFFO 57.1% 55.7% 72.5% 68.6% 64.0% 61.1% 66.3% 60.0% 60.0% 60.0% 60.0%
EOP Shares & Units 64.6 65.2 65.3 65.3 65.3 65.3 65.3 65.3 65.3 65.3 65.3
February 18, 2015
6
Figure 7. CyrusOne – FFO / AFFO Analysis
Source: Company data, Evercore ISI Research
Full Full 2015 Full Full Full Full Full
($ in millions) Year Year Q1E Q2E Q3E Q4E 0 Year Year Year Year Year
FY - December 2013A 2014A Mar-15 Jun-15 Sep-15 Dec-15 2015E 2016E 2017E 2018E 2019E
Funds From Operations (FFO)
Net Income (35.8) (14.5) (0.4) 1.1 3.2 4.7 8.6 36.2 61.6 89.9 121.3
Noncontrolling Interests 0.0 0.0 0.0 0.0 0.0 0.0 0.0 0.0 0.0 0.0 0.0
Other (Transaction Costs) 23.5 0.0 0.0 0.0 0.0 0.0 0.0 0.0 0.0 0.0 0.0
Income (Loss) From Continuing Operations (12.3) (14.5) (0.4) 1.1 3.2 4.7 8.6 36.2 61.6 89.9 121.3
Real Estate D&A 70.6 95.9 25.4 25.5 25.5 25.5 101.9 103.0 104.5 105.9 103.2
Customer Relationship Amort. 16.8 16.9 4.2 4.2 4.2 4.2 16.8 16.8 16.8 16.8 16.8
Other 3.6 14.6 0.0 0.0 0.0 0.0 0.0 0.0 0.0 0.0 0.0
FFO Avail. to Common Stock and Unitholders 78.7 112.9 29.2 30.8 32.9 34.4 127.3 156.0 183.0 212.6 241.3
Adjusted Funds From Operations (AFFO) 22.5%
Amortization of Deferred Financing 4.1 3.4 0.7 0.7 0.7 0.7 2.8 2.8 2.8 2.8 2.8
Non-Cash Compensation 6.3 10.3 3.3 3.3 3.3 3.3 13.3 9.6 10.1 10.6 11.1
Non RE D&A 7.8 5.2 1.4 1.4 1.4 1.4 5.5 5.8 6.1 6.4 5.8
Deferred Rev and Straight Line Adjustment (13.9) (10.5) (2.3) (2.3) (2.3) (2.3) (9.2) (9.2) (9.2) (9.2) (9.2)
Leasing Commissions (6.8) (5.8) (2.9) (2.9) (2.9) (2.9) (11.6) (11.6) (11.6) (11.6) (11.6)
Recurring CAPEX (4.2) (5.0) (1.0) (1.0) (1.0) (1.0) (4.0) (4.8) (5.8) (6.9) (8.3)
Corp. Income Tax (Benefit) 0.4 0.0 0.0 0.0 0.0 0.0 0.0 0.0 0.0 0.0 0.0
AFFO Avail. to Common Stock and Unit Holders 72.4 110.5 28.4 30.0 32.2 33.7 124.2 148.8 175.4 204.6 231.9
Diluted FFO per Share $1.22 $1.73 $0.45 $0.47 $0.50 $0.53 $1.95 $2.39 $2.80 $3.26 $3.69
Growth Q/Q (6.5%) 5.4% 7.1% 4.5%
Growth Y/Y 16.6% 42.2% 6.8% 19.8% 13.9% 10.3% 12.5% 22.5% 17.3% 16.2% 13.5%
Diluted AFFO per Share $1.12 $1.70 $0.43 $0.46 $0.49 $0.52 $1.90 $2.28 $2.69 $3.13 $3.55
Growth Q/Q (4.8%) 5.6% 7.3% 4.6%
Growth Y/Y 35.8% 51.3% 2.7% 18.1% 10.4% 12.9% 12.2% 19.9% 17.9% 16.7% 13.3%
Wgtd Avg Shares Common + Units+ Exch Dilution 64.6 65.2 65.3 65.3 65.3 65.3 65.3 65.3 65.3 65.3 65.3
February 18, 2015
7
Figure 8. CyrusOne – Balance Sheet
Source: Company data, Evercore Group L.L.C. Research
Full Full 2015 Full Full Full Full Full
($ in millions) Year Year Q1E Q2E Q3E Q4E Year Year Year Year Year
FY - December 2013A 2014A Mar-15 Jun-15 Sep-15 Dec-15 2015E 2016E 2017E 2018E 2019E
ASSETS
Gross PP&E 1,120.5 1,378.4 1,428.9 1,479.4 1,529.9 1,580.4 1,580.4 1,795.0 2,014.6 2,220.1 2,422.1
Accumulated D&A (236.7) (327.0) (358.0) (389.0) (420.1) (451.2) (451.2) (576.8) (704.3) (833.3) (959.1)
Net PP&E 883.8 1,051.4 1,070.9 1,090.4 1,109.8 1,129.1 1,129.1 1,218.2 1,310.3 1,386.8 1,463.1
Cash and Cash Equivalents 148.8 36.5 4.5 15.4 28.5 42.8 42.8 17.8 21.8 49.8 90.4
Restricted Cash 0.0 0.0 0.0 0.0 0.0 0.0 0.0 0.0 0.0 0.0 0.0
Rent and Other Receivables 41.2 60.9 65.3 68.3 71.7 74.6 74.6 89.3 106.1 124.2 143.4
Goodwill 276.2 276.2 276.2 276.2 276.2 276.2 276.2 276.2 276.2 276.2 276.2
Intangible Assets, net 85.9 68.9 68.9 68.9 68.9 68.9 68.9 68.9 68.9 68.9 68.9
Related Party Notes Receivable 0.6 0.8 0.8 0.8 0.8 0.8 0.8 0.8 0.8 0.8 0.8
Other Assets 70.3 91.8 91.8 91.8 91.8 91.8 91.8 91.8 91.8 91.8 91.8
TOTAL ASSETS 1,506.8 1,586.5 1,578.5 1,611.7 1,647.6 1,684.2 1,684.2 1,762.9 1,875.9 1,998.4 2,134.6
LIABILITIES & STOCKHOLDER'S EQUITY
Total Debt 598.0 726.6 726.6 776.6 826.6 876.6 876.6 1,001.6 1,151.6 1,301.6 1,451.6
Accounts Payable, Other Accrued 66.8 69.9 82.9 85.6 88.8 91.3 91.3 98.1 104.7 110.0 114.1
Deferred Revenue 55.9 65.7 65.7 65.7 65.7 65.7 65.7 65.7 65.7 65.7 65.7
Other Liabilities 8.5 7.3 7.3 7.3 7.3 7.3 7.3 7.3 7.3 7.3 7.3
TOTAL LIABILITIES 729.2 869.5 882.5 935.2 988.4 1,040.9 1,040.9 1,172.7 1,329.3 1,484.6 1,638.7
Shareholders' Equity 777.6 717.0 696.0 676.5 659.2 643.3 643.3 590.3 546.7 513.8 496.0
TOTAL LIAB. & STOCKHOLDER'S EQUITY 1,506.8 1,586.5 1,578.5 1,611.7 1,647.6 1,684.2 1,684.2 1,762.9 1,875.9 1,998.4 2,134.6
Variance 0.000 0.000 0.000 0.000 0.000 0.000 0.000 0.000 0.000 0.000 0.000
LEVERAGE RATIOS
Debt / Book Capitalization 43.5% 50.3% 51.1% 53.4% 55.6% 57.7% 57.7% 62.9% 67.8% 71.7% 74.5%
Net Debt / Book Capitalization 32.7% 47.8% 50.8% 52.4% 53.7% 54.9% 54.9% 61.8% 66.5% 69.0% 69.9%
Debt / Adj. EBITDA 4.3x 4.3x 4.1x 4.2x 4.2x 4.3x 4.6x 4.5x 4.5x 4.5x 4.5x
Net Debt / LQA Adj. EBITDA 3.2x 4.1x 4.1x 4.1x 4.1x 4.1x 4.4x 4.4x 4.4x 4.3x 4.2x
Adj. EBITDA / Interest Expense 3.2x 4.3x 4.3x 4.4x 4.5x 4.5x 4.4x 4.5x 4.7x 4.8x 4.9x
February 18, 2015
8
Figure 9. CyrusOne – Cash Flow
Source: Company data, Evercore Group L.L.C. Research
Full Full 2015 Full Full Full Full Full
($ in millions) Year Year Q1E Q2E Q3E Q4E Year Year Year Year Year
FY - December 2013A 2014A Mar-15 Jun-15 Sep-15 Dec-15 2015E 2016E 2017E 2018E 2019E
CASH FLOW FROM OPERATIONS
Net Income (25.5) (14.5) (0.4) 1.1 3.2 4.7 8.6 36.2 61.6 89.9 121.3
Add-back of Non-Cash Expenses
Depreciation & Amortization 95.2 118.0 31.0 31.0 31.1 31.1 124.2 125.6 127.5 129.0 125.8
Other 0.0 17.0 0.0 0.0 0.0 0.0 0.0 0.0 0.0 0.0 0.0
Funds Flow From Operations 69.7 131.6 30.5 32.1 34.3 35.8 132.9 161.8 189.1 219.0 247.1
Change in Net Working Capital 9.7 (20.5) 8.6 (0.2) (0.2) (0.4) 7.7 (7.9) (10.2) (12.7) (15.2)
Cash Flow From Operations 79.4 111.1 39.1 31.9 34.1 35.4 140.5 153.9 178.9 206.2 231.8
CASH FLOW FROM INVESTMENTS
CAPEX (180.6) (284.2) (50.5) (50.5) (50.5) (50.5) (202.0) (214.6) (219.6) (205.5) (202.0)
CAPEX - acq of real estate (48.0) 0.0 0.0 0.0 0.0 0.0 0.0 0.0 0.0 0.0 0.0
Advances to affiliates 0.0 0.0 0.0 0.0 0.0 0.0 0.0 0.0 0.0 0.0 0.0
Other, net 6.1 0.0 0.0 0.0 0.0 0.0 0.0 0.0 0.0 0.0 0.0
Cash Flow From Investing Activities (222.5) (284.2) (50.5) (50.5) (50.5) (50.5) (202.0) (214.6) (219.6) (205.5) (202.0)
FREE CASH FLOW (143.1) (173.1) (11.4) (18.6) (16.4) (15.1) (61.4) (60.7) (40.8) 0.7 29.8
CASH FLOW FROM FINANCING
Change in Debt & Capital Lease Obligations (15.5) 132.8 0.0 50.0 50.0 50.0 150.0 125.0 150.0 150.0 150.0
Issuance of Equity Securities 333.9 355.2 0.0 0.0 0.0 0.0 0.0 0.0 0.0 0.0 0.0
Payment of Dividends (31.0) (50.9) (20.6) (20.6) (20.6) (20.6) (82.3) (89.3) (105.3) (122.8) (139.1)
Other, net (12.0) (376.1) 0.0 0.0 0.0 0.0 0.0 0.0 0.0 0.0 0.0
Cash Flow From Financing 275.4 61.0 (20.6) 29.4 29.4 29.4 67.7 35.7 44.7 27.2 10.9
Change in Cash and Equivalents 132.3 (112.1) (32.0) 10.8 13.1 14.3 6.3 (25.0) 4.0 27.9 40.7
Beginning Cash and Equivalents 16.5 148.8 36.5 4.5 15.4 28.5 36.5 42.8 17.8 21.8 49.8
ENDING CASH AND EQUIVALENTS 148.8 36.5 4.5 15.4 28.5 42.8 42.8 17.8 21.8 49.8 90.4
148.8 36.5 4.5 15.4 28.5 42.8 42.8 17.8 21.8 49.8 90.4
February 18, 2015
9
COMPANIES UNDER COVERAGE BY AUTHOR
Price Evercore ISI
Symbol Company Rating (2015-02-18) Target
COR Coresite Realty Corp. Buy $48.52 $50.00
CONE CyrusOne, Inc. Buy $30.16 $33.00
DLR Digital Realty Trust, Inc. Hold $67.58 $72.00
DFT DuPont Fabros Technology, Inc. Hold $32.07 $35.00
EQIX Equinix, Inc. Buy $228.91 $240.00
INXN InterXion Holding N.V. Hold $32.00 $34.50
RAX Rackspace Hosting, Inc. Buy $51.12 $55.00
TCY-GB TelecityGroup plc Hold 9.44 9.50
T AT&T Inc. Hold 34.49 33.00
GOGO GoGo Inc. Buy $15.64 $26.00
S Sprint Corporation Hold 4.98 4.50
TMUS T-Mobile US, Inc. Buy $31.00 $34.00
VZ Verizon Communications Inc. Hold $48.94 $50.00
AMT American Tower Corporation Buy $96.20 $109.00
CCI Crown Castle International Corp. Hold $88.20 $86.00
SBAC SBA Communications Corporation Buy $122.17 $125.00
February 18, 2015
10
ANALYST CERTIFICATION
The analysts, Jonathan Schildkraut and Robert Gutman, primarily responsible for the preparation of this research report attest to the following: (1)
that the views and opinions rendered in this research report reflect his or her personal views about the subject companies or issuers; and (2) that
no part of the research analyst’s compensation was, is, or will be directly related to the specific recommendations or views in this research report.
DISCLOSURES
This report is approved and/or distributed by International Strategy & Investment Group LLC (“ISI Group LLC”), a U.S. licensed broker-dealer
regulated by the Financial Industry Regulatory Authority (“FINRA”) and by International Strategy & Investment Group (UK) Limited (“ISI UK”),
which is authorised and regulated in the United Kingdom by the Financial Conduct Authority. ISI Group and ISI UK are subsidiaries of Evercore
Partners Inc. and collectively operate under the global marketing brand name Evercore ISI (“Evercore ISI”). The trademarks, logos and service
marks shown on this report are registered trademarks of Evercore Partners Inc.
The analysts and associates responsible for preparing this report receive compensation based on various factors, including the firm’s total
revenues, a portion of which is generated by affiliated investment banking transactions. Evercore ISI publishes and disseminates research
through Evercore ISI, and seeks to update its research as appropriate, but various regulations may prevent this from happening in certain
instances. Aside from certain industry reports published on a periodic basis, the large majority of reports are published at irregular intervals as
appropriate in the analyst’s judgment.
Evercore ISI generally prohibits analysts, associates and members of their households from maintaining a financial interest in the securities
of any company in the analyst’s area of coverage. Any exception to this policy requires specific approval by Evercore ISI Compliance. Such
ownership is subject to compliance with applicable regulations and disclosure. Evercore ISI also prohibits analysts, associates and members of
their households from serving as an officer, director, advisory board member or employee of any company that the analyst covers.
This report may include a Tactical Call, which describes a near-term event or catalyst affecting the subject company or the market overall and
which is expected to have a short-term price impact on the equity shares of the subject company. This Tactical Call is separate from the analyst’s
long-term recommendation (Buy, Hold or Sell) that reflects a stock’s forward 12-month expected return), is not a formal rating and may differ from
the target prices and recommendations reflected in the analyst’s long-term view.
Applicable current disclosures regarding the subject companies covered in this report are available at the offices of Evercore ISI, and
can be obtained by writing to ISI Group LLC, Attn. Compliance, 666 Fifth Avenue, 11th Floor, New York, NY 10103.
Evercore ISI and / or its affiliates, and / or their directors, officers, members and employees, may have, or have had, interests or qualified
holdings on issuers mentioned in this report. Evercore ISI and / or its affiliates may have, or have had, business relationships with the companies
mentioned in this report..
Additional information on securities or financial instruments mentioned in this report is available upon request.
Ratings Definitions
Current Ratings Definition
Evercore ISI’s recommendations are based on a stock’s total forecasted return over the next 12 months. Total forecasted return is equal to the
expected percentage price return plus gross dividend yield. We divide our stocks under coverage into three ratings categories, with the following
return guidelines:
Buy – the total forecasted return is expected to be greater than 10%
Hold – the total forecasted return is expected to be greater than or equal to 0% and less than or equal to 10%
Sell – the total forecasted return is expected to be less than 0%
Suspended – the company rating, target price and earnings estimates have been temporarily suspended.
Historical Ratings Definitions
Prior to October 10, 2014, ISI Group LLC and ISI UK utilized the following different ratings system, which was based on a 12-month risk adjusted
total return:
Strong Buy - Return > 20%
Buy - Return 10% to 20%
Neutral - Return 0% to 10%
Cautious - Return -10% to 0%
Sell - Return < -10%
For disclosure purposes, ISI Group LLC and ISI UK ratings were viewed as follows: Strong Buy and Buy equate to Buy, Neutral equates to Hold,
and Cautious and Sell equate to Sell.
On October 31, 2014, Evercore Partners Inc. acquired ISI Group LLC and ISI UK and transferred its research business to ISI Group LLC (the
“Evercore Acquisition”). Prior to October 31. 2014, certain research reports were separately produced by Evercore ISI’s affiliate, Evercore Group
L.L.C. (“Evercore Group”). Until October 10, 2014, Evercore Group’s recommendations were based on a stock’s expected total return relative to
the analyst’s coverage universe over the following 12 months. Stocks under coverage were divided into three categories:
Overweight – the stock is expected to outperform the average total return of the analyst’s coverage universe over the next 12 months.
Equal-Weight – the stock is expected to perform in line with the average total return of the analyst’s coverage universe over the next 12 months.
Underweight – the stock is expected to underperform the average total return of the analyst’s coverage universe over the next 12 months.
Suspended – the company rating, target price and earnings estimates have been temporarily suspended.
For disclosure purposes, Evercore Group’s prior “Overweight,” “Equal-Weight” and “Underweight” ratings were viewed as “Buy,” “Hold” and “Sell,”
respectively.
February 18, 2015
11
Evercore ISI ratings distribution (as of 02/18/2015)
As a result of the Evercore Acquisition, ISI Group and ISI UK became affiliated with businesses that provide investment banking
services. The ratings distribution chart below reflects information relating to investment banking services that were provided by an
investment banking entity that may or may not have been affiliated with Evercore ISI at the time the rating was made.
Coverage Universe Investment Banking Services / Past 12 Months
Ratings Count Pct. Rating Count Pct.
Buy 310 49% Buy 38 12%
Hold 294 46% Hold 11 4%
Sell 29 5% Sell 1 3%
Suspended 5 1% Suspended 2 40%
Issuer-Specific Disclosures (as of February 18, 2015)
Evercore ISI or an affiliate has acted as a manager or co-manager of a public offering of securities by this subject company CyrusOne, Inc. in
the last 12 months.
Evercore ISI or an affiliate expects to receive or intends to seek compensation for investment banking services from these subject companies
CyrusOne, Inc., Coresite Realty Corp., DuPont Fabros Technology, Inc., Digital Realty Trust, Inc., Equinix, Inc., InterXion Holding N.V. and
Rackspace Hosting, Inc. within the next three months.
Evercore ISI or an affiliate has received compensation from these subject companies CyrusOne, Inc. and Equinix, Inc. for investment banking
services in the last 12 months.
Price Charts
Apr 2012 Jul 2012 Oct 2012 Jan 2013 Apr 2013 Jul 2013 Oct 2013 Jan 2014 Apr 2014 Jul 2014 Oct 2014 Jan 2015
35
30
25
20
15
Closing Price Target Price
CyrusOne, Inc. Rating History as of 02/18/2015
I:OW:$24.00
09/30/13
OW:$25.00
12/09/13
OW:$26.00
02/21/14
OW:$27.00
05/07/14
OW:$30.00
08/04/14
B:$30.00
10/09/14
B:$32.00
10/27/14
B:$33.00
12/10/14
powered by: BlueMatrix
General Disclosures
This report is provided for informational purposes only. It is not to be construed as an offer to buy or sell or a solicitation of an offer to buy
or sell any financial instruments or to participate in any particular trading strategy in any jurisdiction. The information and opinions in this
report were prepared by registered employees of Evercore ISI. The information herein is believed by Evercore ISI to be reliable and has been
obtained from public sources believed to be reliable, but Evercore ISI makes no representation as to the accuracy or completeness of such
information. Opinions, estimates and projections in this report constitute the current judgment of the author as of the date of this report. They do
not necessarily reflect the opinions of Evercore and are subject to change without notice. In addition, opinions, estimates and projections in this
report may differ from or be contrary to those expressed by other business areas or groups of Evercore and its affiliates. Evercore ISI has no
obligation to update, modify or amend this report or to otherwise notify a reader thereof in the event that any matter stated herein, or any opinion,
projection, forecast or estimate set forth herein, changes or subsequently becomes inaccurate. Facts and views in Evercore ISI research reports
and notes have not been reviewed by, and may not reflect information known to, professionals in other Evercore affiliates or business areas,
including investment banking personnel.
Evercore ISI does not provide individually tailored investment advice in research reports. This report has been prepared without regard to the
particular investments and circumstances of the recipient. The financial instruments discussed in this report may not suitable for all investors
and investors must make their own investment decisions using their own independent advisors as they believe necessary and based upon their
specific financial situations and investment objectives. Securities and other financial instruments discussed in this report, or recommended or
offered by Evercore ISI, are not insured by the Federal Deposit Insurance Corporation and are not deposits of or other obligations of any insured
depository institution. If a financial instrument is denominated in a currency other than an investor’s currency, a change in exchange rates may
February 18, 2015
12
adversely affect the price or value of, or the income derived from the financial instrument, and such investor effectively assumes such currency
risk. In addition, income from an investment may fluctuate and the price or value of financial instruments described in this report, either directly or
indirectly, may rise or fall. Estimates of future performance are based on assumptions that may not be realized. Furthermore, past performance is
not necessarily indicative of future performance.
Evercore ISI salespeople, traders and other professionals may provide oral or written market commentary or trading strategies to our clients that
reflect opinions that are contrary to the opinions expressed in this research. Our asset management affiliates and investing businesses may make
investment decisions that are inconsistent with the recommendations or views expressed in this research.
Electronic research is simultaneously available to all clients. This report is provided to Evercore ISI clients and may not be redistributed,
retransmitted or disclosed, in whole or in part, or in any form or manner, without the express written consent of Evercore ISI. Receipt and review
of this research report constitutes your agreement not to redistribute, retransmit, or disclose to others the contents, opinions, conclusion or
information contained in this report (including any investment recommendations, estimates or target prices) without first obtaining express
permission from Evercore ISI.
This report is not intended for distribution to, or use by any person or entity in any jurisdiction or country where such distribution or use would be
contrary to local law or regulation.
For investors in the UK: In making this report available, Evercore makes no recommendation to buy, sell or otherwise deal in any securities or
investments whatsoever and you should neither rely or act upon, directly or indirectly, any of the information contained in this report in respect of
any such investment activity. This report is being directed at or distributed to, (a) persons who fall within the definition of Investment Professionals
(set out in Article 19(5) of the Financial Services and Markets Act 2000 (Financial Promotion) Order 2005 (the “Order”)); (b) persons falling within
the definition of high net worth companies, unincorporated associations, etc. (set out in Article 49(2) of the Order); (c) other persons to whom it
may otherwise lawfully be communicated (all such persons together being referred to as “relevant persons”). This report must not be acted on or
relied on by persons who are not relevant persons.
February 18, 2015
13

More Related Content

What's hot

Tricumen / 1Q15 Capital Markets Result Review_open 110515
Tricumen / 1Q15 Capital Markets Result Review_open 110515Tricumen / 1Q15 Capital Markets Result Review_open 110515
Tricumen / 1Q15 Capital Markets Result Review_open 110515
Tricumen Ltd
 
Marico ru2 qfy2011-261010
Marico ru2 qfy2011-261010Marico ru2 qfy2011-261010
Marico ru2 qfy2011-261010Angel Broking
 
Tricumen / FY15 Capital Markets: Regions_open 080316
Tricumen / FY15 Capital Markets: Regions_open 080316Tricumen / FY15 Capital Markets: Regions_open 080316
Tricumen / FY15 Capital Markets: Regions_open 080316
Tricumen Ltd
 
2006 Analystsand Investors Meeting
2006 Analystsand Investors Meeting2006 Analystsand Investors Meeting
2006 Analystsand Investors MeetingLocaliza
 
qwest communications 2-14-06
qwest communications 2-14-06qwest communications 2-14-06
qwest communications 2-14-06finance19
 
qwest communications Q3 04
qwest communications Q3 04qwest communications Q3 04
qwest communications Q3 04finance19
 
Korean Film & Broadcasting Content Industry
Korean Film & Broadcasting Content IndustryKorean Film & Broadcasting Content Industry
Korean Film & Broadcasting Content Industry
Jeehyun Moon
 
Motilal Oswal reiterate bullish long term view on United Spirits
Motilal Oswal reiterate bullish long term view on United SpiritsMotilal Oswal reiterate bullish long term view on United Spirits
Motilal Oswal reiterate bullish long term view on United Spirits
IndiaNotes.com
 
2014_04_08_ISP_The fragrance of CASH
2014_04_08_ISP_The fragrance of CASH2014_04_08_ISP_The fragrance of CASH
2014_04_08_ISP_The fragrance of CASHAndrea Filtri
 
2007 Q4 TRW Auto Earnings Presentation
2007 Q4 TRW Auto Earnings Presentation 2007 Q4 TRW Auto Earnings Presentation
2007 Q4 TRW Auto Earnings Presentation finance18
 
I-Bytes Automotive Industry
I-Bytes Automotive IndustryI-Bytes Automotive Industry
I-Bytes Automotive Industry
EGBG Services
 
2Q17 EMEA ISG Index
2Q17 EMEA ISG Index2Q17 EMEA ISG Index
US lead the M&A surge, but confidence hits European dealmakers
US lead the M&A surge, but confidence hits European dealmakersUS lead the M&A surge, but confidence hits European dealmakers
US lead the M&A surge, but confidence hits European dealmakers
Deloitte UK
 
A Summary of the US Economy through Corporate Finance
A Summary of the US Economy through Corporate FinanceA Summary of the US Economy through Corporate Finance
A Summary of the US Economy through Corporate Finance
Pranav Ghai
 
Corporate Reporting Analysis: Cable & Wireless / UK Fixed line
Corporate Reporting Analysis: Cable & Wireless / UK Fixed lineCorporate Reporting Analysis: Cable & Wireless / UK Fixed line
Corporate Reporting Analysis: Cable & Wireless / UK Fixed line
Chris Corbishley
 
[2016 Outlook] Media Advertisement
[2016 Outlook] Media Advertisement [2016 Outlook] Media Advertisement
[2016 Outlook] Media Advertisement
Jeehyun Moon
 
JSW Energy Ltd. Q3 FY16 Result Update
JSW Energy Ltd. Q3 FY16 Result UpdateJSW Energy Ltd. Q3 FY16 Result Update
JSW Energy Ltd. Q3 FY16 Result Update
choice broking
 

What's hot (20)

Tricumen / 1Q15 Capital Markets Result Review_open 110515
Tricumen / 1Q15 Capital Markets Result Review_open 110515Tricumen / 1Q15 Capital Markets Result Review_open 110515
Tricumen / 1Q15 Capital Markets Result Review_open 110515
 
Marico ru2 qfy2011-261010
Marico ru2 qfy2011-261010Marico ru2 qfy2011-261010
Marico ru2 qfy2011-261010
 
Tricumen / FY15 Capital Markets: Regions_open 080316
Tricumen / FY15 Capital Markets: Regions_open 080316Tricumen / FY15 Capital Markets: Regions_open 080316
Tricumen / FY15 Capital Markets: Regions_open 080316
 
2006 Analystsand Investors Meeting
2006 Analystsand Investors Meeting2006 Analystsand Investors Meeting
2006 Analystsand Investors Meeting
 
qwest communications 2-14-06
qwest communications 2-14-06qwest communications 2-14-06
qwest communications 2-14-06
 
qwest communications Q3 04
qwest communications Q3 04qwest communications Q3 04
qwest communications Q3 04
 
Korean Film & Broadcasting Content Industry
Korean Film & Broadcasting Content IndustryKorean Film & Broadcasting Content Industry
Korean Film & Broadcasting Content Industry
 
Localiza_Initiate_Oct06
Localiza_Initiate_Oct06Localiza_Initiate_Oct06
Localiza_Initiate_Oct06
 
Motilal Oswal reiterate bullish long term view on United Spirits
Motilal Oswal reiterate bullish long term view on United SpiritsMotilal Oswal reiterate bullish long term view on United Spirits
Motilal Oswal reiterate bullish long term view on United Spirits
 
2014_04_08_ISP_The fragrance of CASH
2014_04_08_ISP_The fragrance of CASH2014_04_08_ISP_The fragrance of CASH
2014_04_08_ISP_The fragrance of CASH
 
2007 Q4 TRW Auto Earnings Presentation
2007 Q4 TRW Auto Earnings Presentation 2007 Q4 TRW Auto Earnings Presentation
2007 Q4 TRW Auto Earnings Presentation
 
I-Bytes Automotive Industry
I-Bytes Automotive IndustryI-Bytes Automotive Industry
I-Bytes Automotive Industry
 
2Q17 EMEA ISG Index
2Q17 EMEA ISG Index2Q17 EMEA ISG Index
2Q17 EMEA ISG Index
 
US lead the M&A surge, but confidence hits European dealmakers
US lead the M&A surge, but confidence hits European dealmakersUS lead the M&A surge, but confidence hits European dealmakers
US lead the M&A surge, but confidence hits European dealmakers
 
A Summary of the US Economy through Corporate Finance
A Summary of the US Economy through Corporate FinanceA Summary of the US Economy through Corporate Finance
A Summary of the US Economy through Corporate Finance
 
Corporate Reporting Analysis: Cable & Wireless / UK Fixed line
Corporate Reporting Analysis: Cable & Wireless / UK Fixed lineCorporate Reporting Analysis: Cable & Wireless / UK Fixed line
Corporate Reporting Analysis: Cable & Wireless / UK Fixed line
 
Weg_Initiate_May06
Weg_Initiate_May06Weg_Initiate_May06
Weg_Initiate_May06
 
[2016 Outlook] Media Advertisement
[2016 Outlook] Media Advertisement [2016 Outlook] Media Advertisement
[2016 Outlook] Media Advertisement
 
Autoparts Initiation 2013
Autoparts Initiation 2013Autoparts Initiation 2013
Autoparts Initiation 2013
 
JSW Energy Ltd. Q3 FY16 Result Update
JSW Energy Ltd. Q3 FY16 Result UpdateJSW Energy Ltd. Q3 FY16 Result Update
JSW Energy Ltd. Q3 FY16 Result Update
 

Similar to Evercore ISI

VALUETRONICS20140620
VALUETRONICS20140620VALUETRONICS20140620
VALUETRONICS20140620Kenneth Koh
 
Credit Corp (CCP) - leading indicators in consumer debt recovery sector
Credit Corp (CCP) - leading indicators in consumer debt recovery sector Credit Corp (CCP) - leading indicators in consumer debt recovery sector
Credit Corp (CCP) - leading indicators in consumer debt recovery sector
George Gabriel
 
Stock Market Report For Investors -Sai Proficient
Stock Market Report For Investors -Sai ProficientStock Market Report For Investors -Sai Proficient
Stock Market Report For Investors -Sai Proficient
sai proficient research
 
SFW - FOFA implications, Sum of parts valuation, possible acquirers
SFW - FOFA implications, Sum of parts valuation, possible acquirers SFW - FOFA implications, Sum of parts valuation, possible acquirers
SFW - FOFA implications, Sum of parts valuation, possible acquirers
George Gabriel
 
Financial services sector - implications of FOFA, possible acquires of SFW, S...
Financial services sector - implications of FOFA, possible acquires of SFW, S...Financial services sector - implications of FOFA, possible acquires of SFW, S...
Financial services sector - implications of FOFA, possible acquires of SFW, S...
George Gabriel
 
Earnings 4Q15 Presentation
Earnings 4Q15 PresentationEarnings 4Q15 Presentation
Earnings 4Q15 Presentation
ir_digitalrealty
 
WFM - Initiating Coverage - Report
WFM - Initiating Coverage - ReportWFM - Initiating Coverage - Report
WFM - Initiating Coverage - Report
Alessandro Masi
 
Financial Analysis
Financial AnalysisFinancial Analysis
Financial AnalysisAmber White
 
Q4 2016 - Management Investor Presentation
Q4 2016 - Management Investor PresentationQ4 2016 - Management Investor Presentation
Q4 2016 - Management Investor Presentation
RioCan
 
BT Funds Management - bigger, better, bolder BT - 20130501
BT Funds Management - bigger, better, bolder BT - 20130501BT Funds Management - bigger, better, bolder BT - 20130501
BT Funds Management - bigger, better, bolder BT - 20130501
George Gabriel
 
BTT - bigger better bolder BT - 20130501
BTT -  bigger better bolder BT - 20130501BTT -  bigger better bolder BT - 20130501
BTT - bigger better bolder BT - 20130501
George Gabriel
 
HCL Q1FY15: Revenue below estimate on lower IMS growth; buy
 HCL Q1FY15: Revenue below estimate on lower IMS growth; buy HCL Q1FY15: Revenue below estimate on lower IMS growth; buy
HCL Q1FY15: Revenue below estimate on lower IMS growth; buy
IndiaNotes.com
 
Tcs 2 qfy2011-221010
Tcs 2 qfy2011-221010Tcs 2 qfy2011-221010
Tcs 2 qfy2011-221010Angel Broking
 
Dabur ru2 qfy2011-271010
Dabur ru2 qfy2011-271010Dabur ru2 qfy2011-271010
Dabur ru2 qfy2011-271010Angel Broking
 
Upl ru2 qfy2011-261010
Upl ru2 qfy2011-261010Upl ru2 qfy2011-261010
Upl ru2 qfy2011-261010Angel Broking
 
Stock Pitch For Pipes And Walves Distribution PowerPoint Presentation Ppt Sli...
Stock Pitch For Pipes And Walves Distribution PowerPoint Presentation Ppt Sli...Stock Pitch For Pipes And Walves Distribution PowerPoint Presentation Ppt Sli...
Stock Pitch For Pipes And Walves Distribution PowerPoint Presentation Ppt Sli...
SlideTeam
 
1CHAPTER 3Analysis of Financial Statements.docx
1CHAPTER 3Analysis of Financial Statements.docx1CHAPTER 3Analysis of Financial Statements.docx
1CHAPTER 3Analysis of Financial Statements.docx
hyacinthshackley2629
 
Earnings Release Presentation - Fourth Quarter 2009 (4Q09).
Earnings Release Presentation - Fourth Quarter 2009 (4Q09).Earnings Release Presentation - Fourth Quarter 2009 (4Q09).
Earnings Release Presentation - Fourth Quarter 2009 (4Q09).
MRVRI
 

Similar to Evercore ISI (20)

Cowen
CowenCowen
Cowen
 
VALUETRONICS20140620
VALUETRONICS20140620VALUETRONICS20140620
VALUETRONICS20140620
 
Credit Corp (CCP) - leading indicators in consumer debt recovery sector
Credit Corp (CCP) - leading indicators in consumer debt recovery sector Credit Corp (CCP) - leading indicators in consumer debt recovery sector
Credit Corp (CCP) - leading indicators in consumer debt recovery sector
 
Stock Market Report For Investors -Sai Proficient
Stock Market Report For Investors -Sai ProficientStock Market Report For Investors -Sai Proficient
Stock Market Report For Investors -Sai Proficient
 
SFW - FOFA implications, Sum of parts valuation, possible acquirers
SFW - FOFA implications, Sum of parts valuation, possible acquirers SFW - FOFA implications, Sum of parts valuation, possible acquirers
SFW - FOFA implications, Sum of parts valuation, possible acquirers
 
Financial services sector - implications of FOFA, possible acquires of SFW, S...
Financial services sector - implications of FOFA, possible acquires of SFW, S...Financial services sector - implications of FOFA, possible acquires of SFW, S...
Financial services sector - implications of FOFA, possible acquires of SFW, S...
 
Earnings 4Q15 Presentation
Earnings 4Q15 PresentationEarnings 4Q15 Presentation
Earnings 4Q15 Presentation
 
WFM - Initiating Coverage - Report
WFM - Initiating Coverage - ReportWFM - Initiating Coverage - Report
WFM - Initiating Coverage - Report
 
Financial Analysis
Financial AnalysisFinancial Analysis
Financial Analysis
 
Q4 2016 - Management Investor Presentation
Q4 2016 - Management Investor PresentationQ4 2016 - Management Investor Presentation
Q4 2016 - Management Investor Presentation
 
BT Funds Management - bigger, better, bolder BT - 20130501
BT Funds Management - bigger, better, bolder BT - 20130501BT Funds Management - bigger, better, bolder BT - 20130501
BT Funds Management - bigger, better, bolder BT - 20130501
 
BTT - bigger better bolder BT - 20130501
BTT -  bigger better bolder BT - 20130501BTT -  bigger better bolder BT - 20130501
BTT - bigger better bolder BT - 20130501
 
HCL Q1FY15: Revenue below estimate on lower IMS growth; buy
 HCL Q1FY15: Revenue below estimate on lower IMS growth; buy HCL Q1FY15: Revenue below estimate on lower IMS growth; buy
HCL Q1FY15: Revenue below estimate on lower IMS growth; buy
 
Tcs 2 qfy2011-221010
Tcs 2 qfy2011-221010Tcs 2 qfy2011-221010
Tcs 2 qfy2011-221010
 
Dabur ru2 qfy2011-271010
Dabur ru2 qfy2011-271010Dabur ru2 qfy2011-271010
Dabur ru2 qfy2011-271010
 
Upl ru2 qfy2011-261010
Upl ru2 qfy2011-261010Upl ru2 qfy2011-261010
Upl ru2 qfy2011-261010
 
Stock Pitch For Pipes And Walves Distribution PowerPoint Presentation Ppt Sli...
Stock Pitch For Pipes And Walves Distribution PowerPoint Presentation Ppt Sli...Stock Pitch For Pipes And Walves Distribution PowerPoint Presentation Ppt Sli...
Stock Pitch For Pipes And Walves Distribution PowerPoint Presentation Ppt Sli...
 
1CHAPTER 3Analysis of Financial Statements.docx
1CHAPTER 3Analysis of Financial Statements.docx1CHAPTER 3Analysis of Financial Statements.docx
1CHAPTER 3Analysis of Financial Statements.docx
 
Aegis060308
Aegis060308Aegis060308
Aegis060308
 
Earnings Release Presentation - Fourth Quarter 2009 (4Q09).
Earnings Release Presentation - Fourth Quarter 2009 (4Q09).Earnings Release Presentation - Fourth Quarter 2009 (4Q09).
Earnings Release Presentation - Fourth Quarter 2009 (4Q09).
 

Evercore ISI

  • 1. Telecommunications | Data Center Services February 18, 2015 CYRUSONE, INC. CONE | $30.16 BUY | TARGET PRICE: $35.00 Earnings Report Jonathan Schildkraut 212 497 0864 jonathan.schildkraut@evercoreisi.com Robert Gutman 212 497 0877 robert.gutman@evercoreisi.com Company Statistics 52-Week Range: $19.52 - $29.40 Market Capitalization (M): $1,979 Enterprise Value (M): $2,669 Shares Outstanding (M): 66 Average 10-Day Volume (000s): 324 Dividend Yield: 4.2% Fiscal Year End Dec Earnings Summary 2013A 2014A 2015E EV/EBITDA 19.2x 15.8x 14.0x P/FFO/shr 24.8x 17.4x 15.5x P/AFFO/shr 26.9x 17.8x 15.9x Revenue (M) 1Q $60.1 $77.5 $87.8 2Q $63.6 $81.7 $91.7 3Q $67.5 $84.8 $87.8 4Q $72.3 $86.9 $100.2 FY $263.5 $330.9 $375.9 EBITDA (M) 1Q $31.5 $41.7 $44.4 2Q $30.8 $40.8 $46.3 3Q $36.5 $42.2 $44.4 4Q $39.9 $44.6 $50.8 FY $138.7 $169.3 $190.4 FFO/shr 1Q $0.27 $0.42 $0.45 2Q $0.25 $0.39 $0.47 3Q $0.34 $0.44 $0.45 4Q $0.37 $0.48 $0.53 FY $1.22 $1.73 $1.95 1 Year Price History CyrusOne, Inc. vs. S&P 500 (SP50) CONE S&P 500 (SP50) 02/14 05/14 08/14 11/14 02/15 32 30 28 26 24 22 20 18 2,300 2,200 2,100 2,000 1,900 1,800 1,700 Source: FactSet Solid Print, Remains Undervalued CONE reported a very strong quarter with revs, EBITDA, FFO and AFFO ahead by 1.5%, 5.3%, 17.1% and 10.1% respectively – while also reporting an increase in development yields to 18% (from 17% in 3Q). For the full year they delivered revs, EBITDA, FFO and AFFO growth of 25.6%, 22.1%, 42.2% and 51.3% respectively. FY15 guidance implies (at the mid pt), rev growth of 14.0%, EBITDA growth of 12.4% (margin of 50.3%), and FFO p/shr growth of 12.7%. The qrtrly dividend was increased by 50%, to $0.315 p/shr to align with a 60-70% AFFO payout ratio in 2015. Net/net CONE continues to execute well, deliver above market growth, and achieve industry leading development yields - yet trades at a meaningful discount to its peers. Maintain BUY, increasing PT to $35 (from $33). ■ Strong Print. CONE reported 4Q14 revs of $86.9MM (+2.5% Q/Q, +20.2% Y/Y), vs. our/cons. $85.6MM / $85.7MM, EBITDA of $44.6MM (+5.7% Q/Q, +11.8% Y/Y), vs. our/cons. $42.4MM / $42.9MM, diluted FFO per share of $0.48 (+8.1% Q/Q, +30.9% Y/Y), vs. our/cons. $0.41 / $0.42, and diluted AFFO per share of $0.46 (+2.4% Q/Q, +41.8% Y/Y), vs. our/cons. $0.41 / $0.38 ■ Solid 4Q Leasing, FY14 +33.3% Y/Y. In 4Q, CONE leased 44K CSF, inline with recent quarters and capping off FY14 leasing of 236K CSF, +33.3% Y/Y. The largest proportion of leasing occurred in Dallas (roughly 24K CSF), while the new Phoenix facility launched with 6.5K CSF in addition to the 30K CSF pre-leased, roughly 7.0K CSF was scattered throughout the existing footprint, and we estimate 6.5K CSF were leased at the NoVA facility launched in 1Q. Of the $11.4MM of annualized GAAP lease revenue signed in 4Q, $3.7MM commenced within the quarter while $7.6MM is expected to commence in 1Q15. ■ Dispelled Fear of Energy Sector Overhang. As the price of crude oil plummeted in 4Q, investors raised concerns regarding CONE’s high exposure to the energy sector (and Texas). In the 4Q presentation, we believe mgmt provided data largely dispelling these concerns. ■ Development +54.1% Y/Y, Expansion Increasing. CONE delivered 185K gross CSF of space in 2014, with the delivery of 37K CSF in Phoenix in 4Q. This compares to 120K CSF delivered in 2013, an increase of 54.1%. Looking to 2015, the company has 212K CSF under construction with the expectation of bringing 275-325K CSF online by year-end, bringing the total to roughly 1.5MM CSF. ■ FY15 Guide. Mgmt provided FY15 guidance which implies (at the midpoint), revenue growth of 14.0%, EBITDA growth of 12.4% (margin of 50.3%), and FFO per share growth of 12.7%. Factored into expectations are (1) front-end loaded, elevated churn, (2) the negative impact on margins due to the rapid growth in metered power and cost of opening new facilities, (3) elevated stock-based compensation. ■ Maintain BUY, PT to $35 (from $33). Our DCF-based PT implies P/ FFO multiples of 14.6x 16E and 12.5x 17E vs. current multiples of 15.5x 15E and 12.6x 16E. On a P/AFFO basis, our PT implies 15.4x 16E and 13.0x 17E vs. current multiples of 15.9x 15E and 13.2x 16E. Please see the analyst certification and important disclosures on page 10 of this report. Evercore ISI and affiliates do and seek to do business with companies covered in its research reports. Investors should be aware that the firm may have a conflict of interest that could affect the objectivity of this report. Investors should consider this report as only a single factor in making their investment decision.
  • 2. Solid Print, Remains Undervalued CONE reported a very strong quarter with revs, EBITDA, FFO and AFFO ahead by 1.5%, 5.3%, 17.1% and 10.1% respectively – while also reporting an increase in development yields to 18% (from 17% in 3Q). For the full year they delivered revs, EBITDA, FFO and AFFO growth of 25.6%, 22.1%, 42.2% and 51.3% respectively. FY15 guidance implies (at the midpoint), revenue growth of 14.0%, EBITDA growth of 12.4% (margin of 50.3%), and FFO per share growth of 12.7%. The quarterly dividend was increased by 50%, to $0.315 per share to align with a 60-70% AFFO payout ratio in 2015. Net/net CONE continues to execute well, deliver above market growth, and achieve industry leading development yields - yet trades at a meaningful discount to its peers. Maintain BUY, increasing PT to $35 (from $33). Strong Print Figure 1. Comparison of Actual Results to Estimates and Prior Period Historicals Source: Company data, Evercore ISI Research  Strong Print. In 4Q, revenue was aided by higher metered power (13.2% of total vs. 8.7% in 4Q13), while margins benefitted from seasonally lower electricity costs. The FFO/AFFO beat was driven by higher margins and lower interest expense in the quarter. Lastly, the company increased the quarterly dividend by 50% - in order to be inline with the targeted 60-70% AFFO payout ratio (2015).  Solid 4Q Leasing, FY14 +33.3% Y/Y. In 4Q, CONE leased 44K CSF, inline with recent quarters and capping off FY14 leasing of 236K CSF, +33.3% Y/Y. The largest proportion of leasing occurred in Dallas (roughly 24K CSF), while the new Phoenix facility launched with 6.5K CSF in addition to the 30K CSF pre-leased, roughly 7.0K CSF was scattered throughout the existing footprint, and we estimate 6.5K CSF were leased at the NoVA facility launched in 1Q. This would bring the facility to 61% leased (from 40% pre-leased) – though mgmt will provide actual numbers in the 1Q print. Of the $11.4MM of annualized GAAP lease revenue signed in 4Q, $3.7MM commenced within the quarter while $7.6MM is expected to commence in 1Q15. - Backlog Unchanged. Commencement backlog was unchanged Q/Q at $9.2MM of annualized GAAP revenue – with 99% expected to commence by 1Q15. Figure 2. Leasing Trend Source: Company data, Evercore ISI Research 4Q14 ($ in M M s except per share data) Actual Estimate Difference Result Q/Q Result Y/Y Revenue (MM) $86.9 $85.6 1.5% $84.8 2.5% $72.3 20.2% EBITDA (MM) $44.6 $42.4 5.3% $42.2 5.7% $39.9 11.8% EBITDA Margin 51.3% 49.5% 49.8% 55.2% Incremental EBITDA Margin 51.3% 20.0% 54.0% 70.8% FFO (MM) $31.2 $26.6 17.2% $28.9 8.0% $23.6 32.2% Diluted FFO per share $0.48 $0.41 17.1% $0.44 7.9% $0.37 30.8% AFFO (MM) $29.8 $27.0 10.2% $29.1 2.4% $20.8 43.3% Diluted AFFO per share $0.46 $0.41 10.1% $0.45 2.3% $0.32 41.7% 3Q14 4Q13 (CSF SFT 000s) 2013A 1Q14A 2Q14A 3Q14A 4Q14A 2014A CSF Leases Signed 177.0 100.0 59.0 33.0 44.0 236.0 Q/Q% 112.8% (41.0%) (44.1%) 33.3% Y/Y% 60.9% 222.6% 59.5% (46.8%) (6.4%) 33.3% February 18, 2015 2
  • 3.  Now Breaking Out Metered Power. Given the high growth in metered power sales (driven by large deals) in 2014, and the pass through nature of this revenue (i.e. it lowers EBITDA margin), mgmt has broken out metered power from base rent going back to 4Q13. Metered power represented 8.7% of total revenue in 2013 and has climbed consistently to 13.2% in 4Q14 (12.3% for FY14). On a run rate analysis, CONE added $15.6MM of metered power revenue in 2014, over the 3Q annualized run rate which will cause a drag on margins in 2015. The 2015 forecast calls for much lower growth in metered power (and less drag on margins going forward) as the company does not anticipate the same pace of large deals. Figure 3. Metered Power Growth Source: Company data, Evercore ISI Research - Building in Escalators. In 4Q, over 72% of new contracts had escalators with a weighted average of 2.7% Mgmt estimates over 30% of the contracts now have annual price escalators built in - vs. zero only two years ago. - Growth Coming From Embedded Base, and Fortune 1000 Logos. In 4Q, 81% of MRR signed came from the embedded base of customers vs. the TTM average of 55%. In addition, CONE added three new Fortune 1000 logos in 4Q, bringing the total to 144 (vs. 129 4Q13), and total customer count to 669 (vs. 612 4Q13). - New Leases Taking IX Services. Mgmt estimates 80% of new leases continue to include National IX services – which boost average monthly rent by roughly 30%. Multisite deployments generate over 60% of revenue (vs. 50% in 2012), which we estimate comes from roughly 20% of the customer base. We believe that connectivity and services provided by the National IX are accelerating these trends by enabling fully outsourced solutions to enterprises which replicate their existing multisite infrastructure.  Renewals and Churn Inline, But 3% Churn Expected in 1Q. CONE renewed $20MM of annual revenue, with $/kW down 1.0% on a cash basis, consistent with prior quarters. We view positively given CONE already high yield /sft. Churn declined Q/Q to 1.7% (3Q: 2.9%), though is expected to increase to 3.0% in 1Q15 due to contract terminations and renegotiations the occurred in 4Q14.  Development +54.1% Y/Y, Expansion Increasing. CONE delivered 185K gross CSF of space in 2014, with the delivery of 37K CSF in Phoenix in 4Q. This compares to 120K CSF delivered in 2013, an increase of 54.1%. Looking to 2015, the company has 212K CSF under construction with the expectation of bringing 275-325K CSF online by yearend, bringing the total to roughly 1.5MM CSF. In addition, the company anticipates the purchase or construction of 300-400K sft of powered shell for future development, and expects to close on the purchase of 175K sft shell in Austin near-term. Mgmt sees the opportunity to reach 2.0MM CSF at roughly $5MM per MW with existing undeveloped powered shell space. Longer-term, including all land yet to be developed, this figure would increase to $5.1MM CSF (at roughly $6-7MM per MW). $MMs 4Q13 Metered Power Rev $6.3 Annualized 25.2 FY14 Reported 40.8 Incremental $15.6 4Q14 Metered Power Rev $11.5 Annualized 46.0 FY15 Guide (Midpoint) 50.5 Incremental MP Rev $4.5 February 18, 2015 3
  • 4. - Development Yields Increasing. In 4Q 14, CONE achieved development yield of 18%, an increase from 17% in 3Q14. Since 1Q13 the company has invested roughly $400MM while maintaining yields of 16-19%. Notably, the calculation includes unstabilized properties – excluding which yields would be >20%. In addition, mgmt sees the opportunity to improve on these figures over time driven by leveraging fixed costs across the portfolio.  Dispelled Fear of Energy Sector Overhang. As the price of crude oil plummeted in 4Q, investors raised concern regarding CONE’s high exposure to the energy sector (and Texas). In the 4Q presentation, we believe mgmt provided data largely dispelling these concerns as (1) as U.S. GDP growth turned negative 2008-2010 (and oil traded at $30), the data center services still grew at an 18-20% pace, (2) data center service costs represent a tiny fraction of operating expenses for CONE’s top 10 Oil & Gas customers (roughly 0.006%), (3) growth from the energy vertical remains consistent contributing $125-135K of new MRR per quarter, (4) revenue base has become increasing diversified with energy representing 28% of ABR vs. 37% two years ago, and (5) the Texas economy remains strong as oil taxes are 4-6% of the tax base vs. 13% in the 1980’s – while the state is the headquarters for over 25 non-Oil & Gas Fortune 500 companies. FY15 Guidance Mgmt provided FY15 guidance which implies (at the midpoint), revenue growth of 14.0%, EBITDA growth of 12.4% (margin of 50.3%), and FFO per share growth of 12.7%. Factored into expectations are (1) front-end loaded, elevated churn, (2) the negative impact on margins due to the rapid growth in metered power and cost of opening new facilities, (3) elevated stock-based compensation.  3% Churn in 1Q. Mgmt estimates 3% churn in 1Q due to the terminations or renegotiation of leases in 4Q by three customers. At 3% of annualized base rent, we estimate the full cost of the 1Q churn to be $9.0 MM (3% of 4Q14 annualized base rent). We would consider half of this amount as extraordinary – above the 1-2% ordinary churn – though a real cost in 2015.  EBITDA Margin ~50%. EBITDA margin is expected to decline to roughly 50% in FY15, from 51.2% in FY14 due to (1) the dilutive effect of increased (pass through) metered revenue, and (2) expansion drag from the opening of new facilities.  FFO to Reflect Stock Based Compensation. Stock based compensation is expected to peak in 2015 due to the vesting period of grants associated with the company’s IPO. Stock based comp is expected to be $3MM higher Y/Y – and then decline thereafter. Figure 4. FY15 Guidance Source: Company data, Evercore ISI Research Guidance Prior $MMs FY15 Midpoint 2014A Y/Y% EVR Consensus Base Revenue $322-332 $327.0 $290.0 12.8% Metered Power Reimb. $48-53 $50.5 $41.0 23.2% Total Revenue $370-385 $377.5 $331.0 14.0% $378.2 $380.3 Adjusted EBITDA $185-195 $190.0 $169.0 12.4% $194.6 $194.6 Margin % 50.3% 51.5% 51.2% Norm. FFO per share $1.90-2.00 $1.95 $1.73 12.7% $2.03 $1.98 Capital Expenditures $215-240 $227.5 $284.0 (19.9%) $231.8 $220.2 February 18, 2015 4
  • 5. Change in Estimates Figure 5. Change in Estimates Source: Company data, Evercore ISI Research Valuation  Maintain BUY, PT to $35 (from $33). Given above market growth, increasing yields and low-cost expansion opportunities we are increasing our YE15 PT to $35 from $33.Our DCF-based PT implies EV/EBITDA multiples of 14.1x 16E and 12.3x 17E, vs. current multiples of 14.0x 15E and 12.1x 16E. On a P/FFO basis, our PT implies 14.6x 16E and 12.5x 17E vs. current multiples of 15.5x 15E and 12.6x 16E. On a P/AFFO basis, our PT implies 15.4x 16E and 13.0x 17E vs. current multiples of 15.9x 15E and 13.2x 16E.  Risks: (1) We believe the market for wholesale colocation space is becoming increasingly competitive; (2) CONE is exposed to supply and demand dislocations in markets; (3) CBB owns 43.7% of the company’s combined shares and operating units. 1Q15 2015 2016 ($ in M M s except per share data) Current Prior Change Current Prior Change Current Prior Change Revenue (MM) $87.8 $89.1 (1.5%) $375.9 $378.2 (0.6%) $432.7 $431.8 0.2% EBITDA (MM) $44.4 $44.8 (0.8%) $190.4 $194.6 (2.2%) $221.3 $224.8 (1.6%) EBITDA Margin 50.6% 50.3% 50.6% 51.4% 51.1% 52.1% Incremental EBITDA Margin (175.0%) 50.0% 46.8% 56.7% 54.5% 56.4% FFO (MM) $29.2 $29.3 (0.6%) $127.3 $132.6 (4.0%) $156.0 $159.7 (2.3%) Diluted FFO per share $0.45 $0.45 (0.6%) $1.95 $2.03 (4.1%) $2.39 $2.45 (2.4%) AFFO (MM) $28.4 $30.5 (6.9%) $124.2 $137.4 (9.6%) $148.8 $164.2 (9.4%) Diluted AFFO per share $0.43 $0.47 (7.0%) $1.90 $2.11 (9.7%) $2.28 $2.52 (9.4%) February 18, 2015 5
  • 6. Model Figure 6. CyrusOne – Income Statement Source: Company data, Evercore ISI Research Full Full 2015 Full Full Full Full Full ($ in millions) Year Year Q1E Q2E Q3E Q4E Year Year Year Year Year FY - December 2013A 2014A Mar-15 Jun-15 Sep-15 Dec-15 2015E 2016E 2017E 2018E 2019E Base Revenue $290.1 $78.6 $80.2 $83.9 $86.9 $329.6 $379.4 $427.5 $477.1 $526.6 Metered Power Reimbursements 40.8 9.2 11.6 12.4 13.3 46.4 53.3 60.1 67.0 73.9 TOTAL REVENUE $263.5 $330.9 $87.8 $91.7 $96.3 $100.2 $375.9 $432.7 $487.5 $544.1 $600.6 Growth Q/Q 1.0% 4.5% 5.0% 4.0% Growth Y/Y 19.3% 25.6% 13.3% 12.3% 13.6% 15.3% 13.6% 15.1% 12.7% 11.6% 10.4% OPERATING EXPENSES Rental Property Operating & Maintenance 93.2 124.5 33.7 35.3 36.8 38.3 144.1 164.2 180.6 196.1 213.2 Sales and Marketing 10.6 12.8 2.7 2.9 3.0 3.1 11.7 13.3 14.7 15.9 17.3 G&A 21.7 24.3 6.9 7.3 7.6 7.9 29.7 33.8 37.2 40.4 43.9 Other (0.7) 0.0 0.0 0.0 0.0 0.0 0.0 0.0 0.0 0.0 0.0 TOTAL OPERATING EXPENSES 124.8 161.6 43.3 45.5 47.4 49.3 185.6 211.4 232.5 252.4 274.5 EBITDA $138.7 $169.3 $44.4 $46.3 $48.9 $50.8 $190.4 $221.3 $255.1 $291.7 $326.1 EBITDA Margin 52.6% 51.2% 50.6% 50.4% 50.8% 50.7% 50.6% 51.1% 52.3% 53.6% 54.3% Incremental EBITDA Margin 75.6% 45.4% (175.0%) 10.0% 25.0% 10.0% 46.8% 54.5% 61.5% 64.7% 60.9% Depreciation & Amortization 95.2 118.0 31.0 31.0 31.1 31.1 124.2 125.6 127.5 129.0 125.8 Stock-based Comp 6.3 10.3 3.3 3.3 3.3 3.3 13.3 9.6 10.1 10.6 11.1 Other 25.6 1.0 0.0 0.0 0.0 0.0 0.0 0.0 0.0 0.0 0.0 EBIT 11.6 40.0 10.1 11.9 14.5 16.3 52.8 86.1 117.5 152.0 189.2 Interest Income 0.0 0.0 0.0 0.0 0.0 0.0 0.0 0.0 0.0 0.0 0.0 Interest Expense 43.7 39.5 10.3 10.5 10.9 11.4 43.0 48.7 54.7 60.9 66.7 Tax Expense 2.3 1.4 0.3 0.3 0.3 0.3 1.2 1.2 1.2 1.2 1.2 Other 1.4 13.6 0.0 0.0 0.0 0.0 0.0 0.0 0.0 0.0 0.0 Net Income / (Loss) (35.8) (14.5) (0.4) 1.1 3.2 4.7 8.6 36.2 61.6 89.9 121.3 Minority Interest 10.3 6.7 0.0 0.0 0.0 0.0 0.0 0.0 0.0 0.0 0.0 NET INCOME (25.5) (7.8) (0.4) 1.1 3.2 4.7 8.6 36.2 61.6 89.9 121.3 Adjustments 19.5 0.0 0.0 0.0 0.0 0.0 0.0 0.0 0.0 0.0 0.0 RECURRING NET INCOME (6.0) (7.8) (0.4) 1.1 3.2 4.7 8.6 36.2 61.6 89.9 121.3 Average Shares Outstanding - Basic 20.9 30.4 38.7 38.8 38.9 39.0 38.9 39.3 39.7 40.1 40.5 Average Shares Outstanding - Diluted 20.9 30.4 38.7 38.8 38.9 39.0 38.9 39.3 39.7 40.1 40.5 EPS - Basic ($0.29) ($0.26) ($0.01) $0.03 $0.08 $0.12 $0.22 $0.92 $1.55 $2.24 $3.00 EPS - Diluted ($0.29) ($0.26) ($0.01) $0.03 $0.08 $0.12 $0.22 $0.92 $1.55 $2.24 $3.00 DIVIDENDS $0.64 $0.95 $0.32 $0.32 $0.32 $0.32 $1.26 $1.37 $1.61 $1.88 $2.13 As a % of AFFO 57.1% 55.7% 72.5% 68.6% 64.0% 61.1% 66.3% 60.0% 60.0% 60.0% 60.0% EOP Shares & Units 64.6 65.2 65.3 65.3 65.3 65.3 65.3 65.3 65.3 65.3 65.3 February 18, 2015 6
  • 7. Figure 7. CyrusOne – FFO / AFFO Analysis Source: Company data, Evercore ISI Research Full Full 2015 Full Full Full Full Full ($ in millions) Year Year Q1E Q2E Q3E Q4E 0 Year Year Year Year Year FY - December 2013A 2014A Mar-15 Jun-15 Sep-15 Dec-15 2015E 2016E 2017E 2018E 2019E Funds From Operations (FFO) Net Income (35.8) (14.5) (0.4) 1.1 3.2 4.7 8.6 36.2 61.6 89.9 121.3 Noncontrolling Interests 0.0 0.0 0.0 0.0 0.0 0.0 0.0 0.0 0.0 0.0 0.0 Other (Transaction Costs) 23.5 0.0 0.0 0.0 0.0 0.0 0.0 0.0 0.0 0.0 0.0 Income (Loss) From Continuing Operations (12.3) (14.5) (0.4) 1.1 3.2 4.7 8.6 36.2 61.6 89.9 121.3 Real Estate D&A 70.6 95.9 25.4 25.5 25.5 25.5 101.9 103.0 104.5 105.9 103.2 Customer Relationship Amort. 16.8 16.9 4.2 4.2 4.2 4.2 16.8 16.8 16.8 16.8 16.8 Other 3.6 14.6 0.0 0.0 0.0 0.0 0.0 0.0 0.0 0.0 0.0 FFO Avail. to Common Stock and Unitholders 78.7 112.9 29.2 30.8 32.9 34.4 127.3 156.0 183.0 212.6 241.3 Adjusted Funds From Operations (AFFO) 22.5% Amortization of Deferred Financing 4.1 3.4 0.7 0.7 0.7 0.7 2.8 2.8 2.8 2.8 2.8 Non-Cash Compensation 6.3 10.3 3.3 3.3 3.3 3.3 13.3 9.6 10.1 10.6 11.1 Non RE D&A 7.8 5.2 1.4 1.4 1.4 1.4 5.5 5.8 6.1 6.4 5.8 Deferred Rev and Straight Line Adjustment (13.9) (10.5) (2.3) (2.3) (2.3) (2.3) (9.2) (9.2) (9.2) (9.2) (9.2) Leasing Commissions (6.8) (5.8) (2.9) (2.9) (2.9) (2.9) (11.6) (11.6) (11.6) (11.6) (11.6) Recurring CAPEX (4.2) (5.0) (1.0) (1.0) (1.0) (1.0) (4.0) (4.8) (5.8) (6.9) (8.3) Corp. Income Tax (Benefit) 0.4 0.0 0.0 0.0 0.0 0.0 0.0 0.0 0.0 0.0 0.0 AFFO Avail. to Common Stock and Unit Holders 72.4 110.5 28.4 30.0 32.2 33.7 124.2 148.8 175.4 204.6 231.9 Diluted FFO per Share $1.22 $1.73 $0.45 $0.47 $0.50 $0.53 $1.95 $2.39 $2.80 $3.26 $3.69 Growth Q/Q (6.5%) 5.4% 7.1% 4.5% Growth Y/Y 16.6% 42.2% 6.8% 19.8% 13.9% 10.3% 12.5% 22.5% 17.3% 16.2% 13.5% Diluted AFFO per Share $1.12 $1.70 $0.43 $0.46 $0.49 $0.52 $1.90 $2.28 $2.69 $3.13 $3.55 Growth Q/Q (4.8%) 5.6% 7.3% 4.6% Growth Y/Y 35.8% 51.3% 2.7% 18.1% 10.4% 12.9% 12.2% 19.9% 17.9% 16.7% 13.3% Wgtd Avg Shares Common + Units+ Exch Dilution 64.6 65.2 65.3 65.3 65.3 65.3 65.3 65.3 65.3 65.3 65.3 February 18, 2015 7
  • 8. Figure 8. CyrusOne – Balance Sheet Source: Company data, Evercore Group L.L.C. Research Full Full 2015 Full Full Full Full Full ($ in millions) Year Year Q1E Q2E Q3E Q4E Year Year Year Year Year FY - December 2013A 2014A Mar-15 Jun-15 Sep-15 Dec-15 2015E 2016E 2017E 2018E 2019E ASSETS Gross PP&E 1,120.5 1,378.4 1,428.9 1,479.4 1,529.9 1,580.4 1,580.4 1,795.0 2,014.6 2,220.1 2,422.1 Accumulated D&A (236.7) (327.0) (358.0) (389.0) (420.1) (451.2) (451.2) (576.8) (704.3) (833.3) (959.1) Net PP&E 883.8 1,051.4 1,070.9 1,090.4 1,109.8 1,129.1 1,129.1 1,218.2 1,310.3 1,386.8 1,463.1 Cash and Cash Equivalents 148.8 36.5 4.5 15.4 28.5 42.8 42.8 17.8 21.8 49.8 90.4 Restricted Cash 0.0 0.0 0.0 0.0 0.0 0.0 0.0 0.0 0.0 0.0 0.0 Rent and Other Receivables 41.2 60.9 65.3 68.3 71.7 74.6 74.6 89.3 106.1 124.2 143.4 Goodwill 276.2 276.2 276.2 276.2 276.2 276.2 276.2 276.2 276.2 276.2 276.2 Intangible Assets, net 85.9 68.9 68.9 68.9 68.9 68.9 68.9 68.9 68.9 68.9 68.9 Related Party Notes Receivable 0.6 0.8 0.8 0.8 0.8 0.8 0.8 0.8 0.8 0.8 0.8 Other Assets 70.3 91.8 91.8 91.8 91.8 91.8 91.8 91.8 91.8 91.8 91.8 TOTAL ASSETS 1,506.8 1,586.5 1,578.5 1,611.7 1,647.6 1,684.2 1,684.2 1,762.9 1,875.9 1,998.4 2,134.6 LIABILITIES & STOCKHOLDER'S EQUITY Total Debt 598.0 726.6 726.6 776.6 826.6 876.6 876.6 1,001.6 1,151.6 1,301.6 1,451.6 Accounts Payable, Other Accrued 66.8 69.9 82.9 85.6 88.8 91.3 91.3 98.1 104.7 110.0 114.1 Deferred Revenue 55.9 65.7 65.7 65.7 65.7 65.7 65.7 65.7 65.7 65.7 65.7 Other Liabilities 8.5 7.3 7.3 7.3 7.3 7.3 7.3 7.3 7.3 7.3 7.3 TOTAL LIABILITIES 729.2 869.5 882.5 935.2 988.4 1,040.9 1,040.9 1,172.7 1,329.3 1,484.6 1,638.7 Shareholders' Equity 777.6 717.0 696.0 676.5 659.2 643.3 643.3 590.3 546.7 513.8 496.0 TOTAL LIAB. & STOCKHOLDER'S EQUITY 1,506.8 1,586.5 1,578.5 1,611.7 1,647.6 1,684.2 1,684.2 1,762.9 1,875.9 1,998.4 2,134.6 Variance 0.000 0.000 0.000 0.000 0.000 0.000 0.000 0.000 0.000 0.000 0.000 LEVERAGE RATIOS Debt / Book Capitalization 43.5% 50.3% 51.1% 53.4% 55.6% 57.7% 57.7% 62.9% 67.8% 71.7% 74.5% Net Debt / Book Capitalization 32.7% 47.8% 50.8% 52.4% 53.7% 54.9% 54.9% 61.8% 66.5% 69.0% 69.9% Debt / Adj. EBITDA 4.3x 4.3x 4.1x 4.2x 4.2x 4.3x 4.6x 4.5x 4.5x 4.5x 4.5x Net Debt / LQA Adj. EBITDA 3.2x 4.1x 4.1x 4.1x 4.1x 4.1x 4.4x 4.4x 4.4x 4.3x 4.2x Adj. EBITDA / Interest Expense 3.2x 4.3x 4.3x 4.4x 4.5x 4.5x 4.4x 4.5x 4.7x 4.8x 4.9x February 18, 2015 8
  • 9. Figure 9. CyrusOne – Cash Flow Source: Company data, Evercore Group L.L.C. Research Full Full 2015 Full Full Full Full Full ($ in millions) Year Year Q1E Q2E Q3E Q4E Year Year Year Year Year FY - December 2013A 2014A Mar-15 Jun-15 Sep-15 Dec-15 2015E 2016E 2017E 2018E 2019E CASH FLOW FROM OPERATIONS Net Income (25.5) (14.5) (0.4) 1.1 3.2 4.7 8.6 36.2 61.6 89.9 121.3 Add-back of Non-Cash Expenses Depreciation & Amortization 95.2 118.0 31.0 31.0 31.1 31.1 124.2 125.6 127.5 129.0 125.8 Other 0.0 17.0 0.0 0.0 0.0 0.0 0.0 0.0 0.0 0.0 0.0 Funds Flow From Operations 69.7 131.6 30.5 32.1 34.3 35.8 132.9 161.8 189.1 219.0 247.1 Change in Net Working Capital 9.7 (20.5) 8.6 (0.2) (0.2) (0.4) 7.7 (7.9) (10.2) (12.7) (15.2) Cash Flow From Operations 79.4 111.1 39.1 31.9 34.1 35.4 140.5 153.9 178.9 206.2 231.8 CASH FLOW FROM INVESTMENTS CAPEX (180.6) (284.2) (50.5) (50.5) (50.5) (50.5) (202.0) (214.6) (219.6) (205.5) (202.0) CAPEX - acq of real estate (48.0) 0.0 0.0 0.0 0.0 0.0 0.0 0.0 0.0 0.0 0.0 Advances to affiliates 0.0 0.0 0.0 0.0 0.0 0.0 0.0 0.0 0.0 0.0 0.0 Other, net 6.1 0.0 0.0 0.0 0.0 0.0 0.0 0.0 0.0 0.0 0.0 Cash Flow From Investing Activities (222.5) (284.2) (50.5) (50.5) (50.5) (50.5) (202.0) (214.6) (219.6) (205.5) (202.0) FREE CASH FLOW (143.1) (173.1) (11.4) (18.6) (16.4) (15.1) (61.4) (60.7) (40.8) 0.7 29.8 CASH FLOW FROM FINANCING Change in Debt & Capital Lease Obligations (15.5) 132.8 0.0 50.0 50.0 50.0 150.0 125.0 150.0 150.0 150.0 Issuance of Equity Securities 333.9 355.2 0.0 0.0 0.0 0.0 0.0 0.0 0.0 0.0 0.0 Payment of Dividends (31.0) (50.9) (20.6) (20.6) (20.6) (20.6) (82.3) (89.3) (105.3) (122.8) (139.1) Other, net (12.0) (376.1) 0.0 0.0 0.0 0.0 0.0 0.0 0.0 0.0 0.0 Cash Flow From Financing 275.4 61.0 (20.6) 29.4 29.4 29.4 67.7 35.7 44.7 27.2 10.9 Change in Cash and Equivalents 132.3 (112.1) (32.0) 10.8 13.1 14.3 6.3 (25.0) 4.0 27.9 40.7 Beginning Cash and Equivalents 16.5 148.8 36.5 4.5 15.4 28.5 36.5 42.8 17.8 21.8 49.8 ENDING CASH AND EQUIVALENTS 148.8 36.5 4.5 15.4 28.5 42.8 42.8 17.8 21.8 49.8 90.4 148.8 36.5 4.5 15.4 28.5 42.8 42.8 17.8 21.8 49.8 90.4 February 18, 2015 9
  • 10. COMPANIES UNDER COVERAGE BY AUTHOR Price Evercore ISI Symbol Company Rating (2015-02-18) Target COR Coresite Realty Corp. Buy $48.52 $50.00 CONE CyrusOne, Inc. Buy $30.16 $33.00 DLR Digital Realty Trust, Inc. Hold $67.58 $72.00 DFT DuPont Fabros Technology, Inc. Hold $32.07 $35.00 EQIX Equinix, Inc. Buy $228.91 $240.00 INXN InterXion Holding N.V. Hold $32.00 $34.50 RAX Rackspace Hosting, Inc. Buy $51.12 $55.00 TCY-GB TelecityGroup plc Hold 9.44 9.50 T AT&T Inc. Hold 34.49 33.00 GOGO GoGo Inc. Buy $15.64 $26.00 S Sprint Corporation Hold 4.98 4.50 TMUS T-Mobile US, Inc. Buy $31.00 $34.00 VZ Verizon Communications Inc. Hold $48.94 $50.00 AMT American Tower Corporation Buy $96.20 $109.00 CCI Crown Castle International Corp. Hold $88.20 $86.00 SBAC SBA Communications Corporation Buy $122.17 $125.00 February 18, 2015 10
  • 11. ANALYST CERTIFICATION The analysts, Jonathan Schildkraut and Robert Gutman, primarily responsible for the preparation of this research report attest to the following: (1) that the views and opinions rendered in this research report reflect his or her personal views about the subject companies or issuers; and (2) that no part of the research analyst’s compensation was, is, or will be directly related to the specific recommendations or views in this research report. DISCLOSURES This report is approved and/or distributed by International Strategy & Investment Group LLC (“ISI Group LLC”), a U.S. licensed broker-dealer regulated by the Financial Industry Regulatory Authority (“FINRA”) and by International Strategy & Investment Group (UK) Limited (“ISI UK”), which is authorised and regulated in the United Kingdom by the Financial Conduct Authority. ISI Group and ISI UK are subsidiaries of Evercore Partners Inc. and collectively operate under the global marketing brand name Evercore ISI (“Evercore ISI”). The trademarks, logos and service marks shown on this report are registered trademarks of Evercore Partners Inc. The analysts and associates responsible for preparing this report receive compensation based on various factors, including the firm’s total revenues, a portion of which is generated by affiliated investment banking transactions. Evercore ISI publishes and disseminates research through Evercore ISI, and seeks to update its research as appropriate, but various regulations may prevent this from happening in certain instances. Aside from certain industry reports published on a periodic basis, the large majority of reports are published at irregular intervals as appropriate in the analyst’s judgment. Evercore ISI generally prohibits analysts, associates and members of their households from maintaining a financial interest in the securities of any company in the analyst’s area of coverage. Any exception to this policy requires specific approval by Evercore ISI Compliance. Such ownership is subject to compliance with applicable regulations and disclosure. Evercore ISI also prohibits analysts, associates and members of their households from serving as an officer, director, advisory board member or employee of any company that the analyst covers. This report may include a Tactical Call, which describes a near-term event or catalyst affecting the subject company or the market overall and which is expected to have a short-term price impact on the equity shares of the subject company. This Tactical Call is separate from the analyst’s long-term recommendation (Buy, Hold or Sell) that reflects a stock’s forward 12-month expected return), is not a formal rating and may differ from the target prices and recommendations reflected in the analyst’s long-term view. Applicable current disclosures regarding the subject companies covered in this report are available at the offices of Evercore ISI, and can be obtained by writing to ISI Group LLC, Attn. Compliance, 666 Fifth Avenue, 11th Floor, New York, NY 10103. Evercore ISI and / or its affiliates, and / or their directors, officers, members and employees, may have, or have had, interests or qualified holdings on issuers mentioned in this report. Evercore ISI and / or its affiliates may have, or have had, business relationships with the companies mentioned in this report.. Additional information on securities or financial instruments mentioned in this report is available upon request. Ratings Definitions Current Ratings Definition Evercore ISI’s recommendations are based on a stock’s total forecasted return over the next 12 months. Total forecasted return is equal to the expected percentage price return plus gross dividend yield. We divide our stocks under coverage into three ratings categories, with the following return guidelines: Buy – the total forecasted return is expected to be greater than 10% Hold – the total forecasted return is expected to be greater than or equal to 0% and less than or equal to 10% Sell – the total forecasted return is expected to be less than 0% Suspended – the company rating, target price and earnings estimates have been temporarily suspended. Historical Ratings Definitions Prior to October 10, 2014, ISI Group LLC and ISI UK utilized the following different ratings system, which was based on a 12-month risk adjusted total return: Strong Buy - Return > 20% Buy - Return 10% to 20% Neutral - Return 0% to 10% Cautious - Return -10% to 0% Sell - Return < -10% For disclosure purposes, ISI Group LLC and ISI UK ratings were viewed as follows: Strong Buy and Buy equate to Buy, Neutral equates to Hold, and Cautious and Sell equate to Sell. On October 31, 2014, Evercore Partners Inc. acquired ISI Group LLC and ISI UK and transferred its research business to ISI Group LLC (the “Evercore Acquisition”). Prior to October 31. 2014, certain research reports were separately produced by Evercore ISI’s affiliate, Evercore Group L.L.C. (“Evercore Group”). Until October 10, 2014, Evercore Group’s recommendations were based on a stock’s expected total return relative to the analyst’s coverage universe over the following 12 months. Stocks under coverage were divided into three categories: Overweight – the stock is expected to outperform the average total return of the analyst’s coverage universe over the next 12 months. Equal-Weight – the stock is expected to perform in line with the average total return of the analyst’s coverage universe over the next 12 months. Underweight – the stock is expected to underperform the average total return of the analyst’s coverage universe over the next 12 months. Suspended – the company rating, target price and earnings estimates have been temporarily suspended. For disclosure purposes, Evercore Group’s prior “Overweight,” “Equal-Weight” and “Underweight” ratings were viewed as “Buy,” “Hold” and “Sell,” respectively. February 18, 2015 11
  • 12. Evercore ISI ratings distribution (as of 02/18/2015) As a result of the Evercore Acquisition, ISI Group and ISI UK became affiliated with businesses that provide investment banking services. The ratings distribution chart below reflects information relating to investment banking services that were provided by an investment banking entity that may or may not have been affiliated with Evercore ISI at the time the rating was made. Coverage Universe Investment Banking Services / Past 12 Months Ratings Count Pct. Rating Count Pct. Buy 310 49% Buy 38 12% Hold 294 46% Hold 11 4% Sell 29 5% Sell 1 3% Suspended 5 1% Suspended 2 40% Issuer-Specific Disclosures (as of February 18, 2015) Evercore ISI or an affiliate has acted as a manager or co-manager of a public offering of securities by this subject company CyrusOne, Inc. in the last 12 months. Evercore ISI or an affiliate expects to receive or intends to seek compensation for investment banking services from these subject companies CyrusOne, Inc., Coresite Realty Corp., DuPont Fabros Technology, Inc., Digital Realty Trust, Inc., Equinix, Inc., InterXion Holding N.V. and Rackspace Hosting, Inc. within the next three months. Evercore ISI or an affiliate has received compensation from these subject companies CyrusOne, Inc. and Equinix, Inc. for investment banking services in the last 12 months. Price Charts Apr 2012 Jul 2012 Oct 2012 Jan 2013 Apr 2013 Jul 2013 Oct 2013 Jan 2014 Apr 2014 Jul 2014 Oct 2014 Jan 2015 35 30 25 20 15 Closing Price Target Price CyrusOne, Inc. Rating History as of 02/18/2015 I:OW:$24.00 09/30/13 OW:$25.00 12/09/13 OW:$26.00 02/21/14 OW:$27.00 05/07/14 OW:$30.00 08/04/14 B:$30.00 10/09/14 B:$32.00 10/27/14 B:$33.00 12/10/14 powered by: BlueMatrix General Disclosures This report is provided for informational purposes only. It is not to be construed as an offer to buy or sell or a solicitation of an offer to buy or sell any financial instruments or to participate in any particular trading strategy in any jurisdiction. The information and opinions in this report were prepared by registered employees of Evercore ISI. The information herein is believed by Evercore ISI to be reliable and has been obtained from public sources believed to be reliable, but Evercore ISI makes no representation as to the accuracy or completeness of such information. Opinions, estimates and projections in this report constitute the current judgment of the author as of the date of this report. They do not necessarily reflect the opinions of Evercore and are subject to change without notice. In addition, opinions, estimates and projections in this report may differ from or be contrary to those expressed by other business areas or groups of Evercore and its affiliates. Evercore ISI has no obligation to update, modify or amend this report or to otherwise notify a reader thereof in the event that any matter stated herein, or any opinion, projection, forecast or estimate set forth herein, changes or subsequently becomes inaccurate. Facts and views in Evercore ISI research reports and notes have not been reviewed by, and may not reflect information known to, professionals in other Evercore affiliates or business areas, including investment banking personnel. Evercore ISI does not provide individually tailored investment advice in research reports. This report has been prepared without regard to the particular investments and circumstances of the recipient. The financial instruments discussed in this report may not suitable for all investors and investors must make their own investment decisions using their own independent advisors as they believe necessary and based upon their specific financial situations and investment objectives. Securities and other financial instruments discussed in this report, or recommended or offered by Evercore ISI, are not insured by the Federal Deposit Insurance Corporation and are not deposits of or other obligations of any insured depository institution. If a financial instrument is denominated in a currency other than an investor’s currency, a change in exchange rates may February 18, 2015 12
  • 13. adversely affect the price or value of, or the income derived from the financial instrument, and such investor effectively assumes such currency risk. In addition, income from an investment may fluctuate and the price or value of financial instruments described in this report, either directly or indirectly, may rise or fall. Estimates of future performance are based on assumptions that may not be realized. Furthermore, past performance is not necessarily indicative of future performance. Evercore ISI salespeople, traders and other professionals may provide oral or written market commentary or trading strategies to our clients that reflect opinions that are contrary to the opinions expressed in this research. Our asset management affiliates and investing businesses may make investment decisions that are inconsistent with the recommendations or views expressed in this research. Electronic research is simultaneously available to all clients. This report is provided to Evercore ISI clients and may not be redistributed, retransmitted or disclosed, in whole or in part, or in any form or manner, without the express written consent of Evercore ISI. Receipt and review of this research report constitutes your agreement not to redistribute, retransmit, or disclose to others the contents, opinions, conclusion or information contained in this report (including any investment recommendations, estimates or target prices) without first obtaining express permission from Evercore ISI. This report is not intended for distribution to, or use by any person or entity in any jurisdiction or country where such distribution or use would be contrary to local law or regulation. For investors in the UK: In making this report available, Evercore makes no recommendation to buy, sell or otherwise deal in any securities or investments whatsoever and you should neither rely or act upon, directly or indirectly, any of the information contained in this report in respect of any such investment activity. This report is being directed at or distributed to, (a) persons who fall within the definition of Investment Professionals (set out in Article 19(5) of the Financial Services and Markets Act 2000 (Financial Promotion) Order 2005 (the “Order”)); (b) persons falling within the definition of high net worth companies, unincorporated associations, etc. (set out in Article 49(2) of the Order); (c) other persons to whom it may otherwise lawfully be communicated (all such persons together being referred to as “relevant persons”). This report must not be acted on or relied on by persons who are not relevant persons. February 18, 2015 13