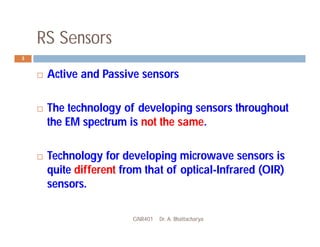
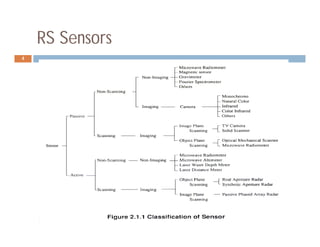
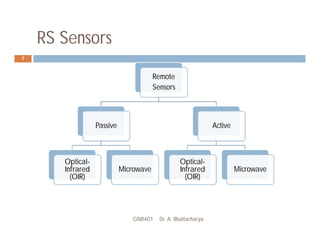
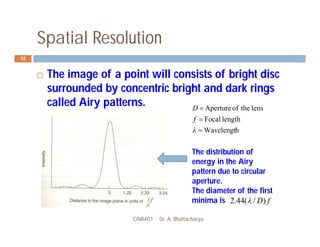
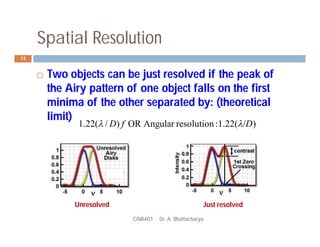
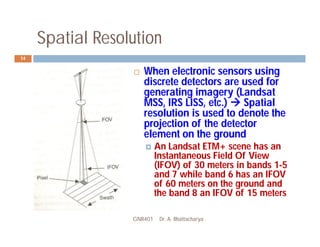
REMOTE SENSING
SENSORS
Lecture 6
GNR401 Dr. A. Bhattacharya 1
RS Sensors
GNR401 Dr. A. Bhattacharya
2
 RS sensors are instruments that measures the
properties of EM radiation leaving a
surface/medium due to scattering or emission
 Generally, radiance is the property measured as
a function of wavelength but could also include
other parameters such as polarization
RS Sensors
GNR401 Dr. A. Bhattacharya
3
 Active and Passive sensors
 The technology of developing sensors throughout
the EM spectrum is not the same.
 Technology for developing microwave sensors is
quite different from that of optical-Infrared (OIR)
sensors.
RS Sensors
GNR401 Dr. A. Bhattacharya
4
RS Sensors
GNR401 Dr. A. Bhattacharya
5
 Understand the basic design characteristics of the
sensors an the various trade-offs that determine
whether a sensor will be suitable for a given
application
 U.S. Landsat and French SPOT satellite systems
were the first and most robust global monitoring
systems to acquire moderate resolution data
systematically
RS Sensors
GNR401 Dr. A. Bhattacharya
6
Satellites
Moderate
resolution
satellites
High resolution
satellites
Hyperspectral
satellites
Microwave
satellites
Earth
Observation
Meteorological
Ocean
monitoring
RS Sensors
GNR401 Dr. A. Bhattacharya
7
Remote
Sensors
Passive
Optical-
Infrared
(OIR)
Microwave
Active
Optical-
Infrared
(OIR)
Microwave
RS Sensors Characteristics
GNR401 Dr. A. Bhattacharya
8
 Classification of sensors is evaluated based on
its classification as well as its mapping accuracy
requirements
 Reasonable assumption:
 Instruments ability to detect small differences in the
emittance/reflectance of the earth’s surface in
number of spectral bands for as small an object as
possible and as often as possible
RS Sensors Characteristics
GNR401 Dr. A. Bhattacharya
9
 What is the optimum set of specifications for
remote sensing sensors ?
 Even if we identify an ideal set of parameters, the
realization of a combination of these parametric
values (i.e., Spatial resolution, Number of spectral
bands, spectral bandwidth, signal-to-noise ration,
etc.) is a complex problem due to strong correlation
among these parameters.
RS Sensors Characteristics
GNR401 Dr. A. Bhattacharya
10
 Sensors parameter under 4 domains:
 1. Spatial
 2. Spectral
 3. Radiometric
 4. Temporal
Spatial Resolution
GNR401 Dr. A. Bhattacharya
11
 Measure of the sensor ability to image closely
spaced objects so that they are distinguishable as
separate objects
 The theoretical limit of resolving two objects by a
imaging system (Lens) is due to diffraction of the EM
wave
 Without any lens aberration (not possible !) one
expects the lens to image a point object as a point in
the image plane
Spatial Resolution
GNR401 Dr. A. Bhattacharya
12
 The image of a point will consists of bright disc
surrounded by concentric bright and dark rings
called Airy patterns.
h
Wavelengt
length
Focal
lens
the
of
Aperture




f
D
The distribution of
energy in the Airy
pattern due to circular
aperture.
The diameter of the first
minima is f
D)
/
(
44
.
2 
Spatial Resolution
GNR401 Dr. A. Bhattacharya
13
 Two objects can be just resolved if the peak of
the Airy pattern of one object falls on the first
minima of the other separated by: (theoretical
limit)
)
1.22(
:
resolution
Angular
OR
)
/
(
22
.
1 D
f
D 


Unresolved Just resolved
Spatial Resolution
GNR401 Dr. A. Bhattacharya
14
 When electronic sensors using
discrete detectors are used for
generating imagery (Landsat
MSS, IRS LISS, etc.)  Spatial
resolution is used to denote the
projection of the detector
element on the ground
 An Landsat ETM+ scene has an
Instantaneous Field Of View
(IFOV) of 30 meters in bands 1-5
and 7 while band 6 has an IFOV
of 60 meters on the ground and
the band 8 an IFOV of 15 meters
Spatial Resolution
GNR401 Dr. A. Bhattacharya
15
 IFOV in radians :
 d is the dimension of the detector
 f is the focal length
 The advantage of using IFOV is that, it characterizes
a sensor irrespective of the altitude of the sensor.
 The information in the IFOV is represented by a
pixel.
 The field of view (FOV) is the total view of the
camera which defines the swath
f
d /
Spectral Resolution
GNR401 Dr. A. Bhattacharya
16
 In multi-spectral RS, the variation in reflected/emitted spectral
radiation is used to distinguish various features
 It is rather difficult (nor essential in most cases) to get continuous
spectral information
 We sample the reflected/emitted spectrum by making
measurements at few selected bands
 The wavelength region of observation : Spectral bands is defined
in terms of
 Central wavelength
 Band width
c



Spectral Resolution
GNR401 Dr. A. Bhattacharya
17
3 Aspects of spectral band selection
• Location of the central
wavelength
• The bandwidth
• The total number of bands
Bandwidth is defined by:
The spectral resolution
The wavelength interval in which the
observation is made. Smaller the ,
higher the spectral resolution
h)
wavelengt
off
-
(cut
and
)
(lower 
 


 

 




Full width at half maximum(FWHM)
Spectral Resolution
GNR401 Dr. A. Bhattacharya
18
IRS LISS, Band 1 is 0.45µm – 0.52µm ?
 In an ideal system the response should be 1 between the
wavelength 0.45µm – 0.52µm and 0 for wavelengths
outside
 Not practicable !
 Bandwidth is defined in terms of 50% of the peak value
on either side (holds for Gaussian system)
 In practice, the pass band response has number of
‘ringings’ and assigning the peak value is not a
straightforward process
 Techniques: method of moments to compute and
(computationally involved)
c
 

Spectral Resolution
GNR401 Dr. A. Bhattacharya
19
Location of spectral bands
GNR401 Dr. A. Bhattacharya
20
 Important criteria for location of spectral bands:
 In the atmospheric window and away from the
absorption bands
 Certain spectral bands are best suited for specific themes
 The bands selected should be un-correlated to the extent
possible (statistical methods to evaluate correlation
between bands)
 Minimum set of optimal bands
 Study showed that addition of middle IR band with any
other band combination gives improved separability in
agriculture classification
Radiometric Resolution
GNR401 Dr. A. Bhattacharya
21
 Constant ratio :
 The difference in the radiance of the objects in a
scene plays an important role in their detection
 The contrast is usually defined usually w.r.t to 2
adjacent areas
 Contrast modulation :
min
max/ L
L
CR 
)
/(
)
( min
max
min
max L
L
L
L
CM 


Radiometric Resolution
GNR401 Dr. A. Bhattacharya
22
 The contrast in the image is different from that of
the scene (object plane)  The degradation of
the contrast by imaging system is represented by
the Modulation Transfer Function (MTF)
MTF =
Radiometric Resolution
GNR401 Dr. A. Bhattacharya
23
 In computer classification of the features from RS
data
 Statistical difference in the reflected value measured
by the instrument
 The absolute value of the reflectance (or radiance) is
not important since one compares the relative
reflectance value between pixels
 However, if one needs two date data for
classification or information fusion, then it is
mandatory to have the absolute radiance value
Radiometric Resolution
GNR401 Dr. A. Bhattacharya
24
MTF effect on radiometry: The ‘square’ wave pattern gives the actual radiance from
three targets- barley, mildewed barley (MB) and sand. Two fields of mildewed
barley- (a)one amongst barley and (b) one among sand. The ‘sine curve’ gives the
radiance when measured with a radiometer. The MTF of the radiometer modifies the
radiance value. Mildewed barley (MB) both (a) and (b) have same radiance (3.85).
But due to radiometer MTF, the MB at (a) shows a lower value (3.6), while MB at (b)
shows a higher value of (4.02). In case (b) the higher radiance of sand spills over to
MB and reverse in (a).

sensors in remote sensing.pdfbbbbbbbbbbbbbbbbbbbbbbbbbbb

  • 1.
  • 2.
    RS Sensors GNR401 Dr.A. Bhattacharya 2  RS sensors are instruments that measures the properties of EM radiation leaving a surface/medium due to scattering or emission  Generally, radiance is the property measured as a function of wavelength but could also include other parameters such as polarization
  • 3.
    RS Sensors GNR401 Dr.A. Bhattacharya 3  Active and Passive sensors  The technology of developing sensors throughout the EM spectrum is not the same.  Technology for developing microwave sensors is quite different from that of optical-Infrared (OIR) sensors.
  • 4.
    RS Sensors GNR401 Dr.A. Bhattacharya 4
  • 5.
    RS Sensors GNR401 Dr.A. Bhattacharya 5  Understand the basic design characteristics of the sensors an the various trade-offs that determine whether a sensor will be suitable for a given application  U.S. Landsat and French SPOT satellite systems were the first and most robust global monitoring systems to acquire moderate resolution data systematically
  • 6.
    RS Sensors GNR401 Dr.A. Bhattacharya 6 Satellites Moderate resolution satellites High resolution satellites Hyperspectral satellites Microwave satellites Earth Observation Meteorological Ocean monitoring
  • 7.
    RS Sensors GNR401 Dr.A. Bhattacharya 7 Remote Sensors Passive Optical- Infrared (OIR) Microwave Active Optical- Infrared (OIR) Microwave
  • 8.
    RS Sensors Characteristics GNR401Dr. A. Bhattacharya 8  Classification of sensors is evaluated based on its classification as well as its mapping accuracy requirements  Reasonable assumption:  Instruments ability to detect small differences in the emittance/reflectance of the earth’s surface in number of spectral bands for as small an object as possible and as often as possible
  • 9.
    RS Sensors Characteristics GNR401Dr. A. Bhattacharya 9  What is the optimum set of specifications for remote sensing sensors ?  Even if we identify an ideal set of parameters, the realization of a combination of these parametric values (i.e., Spatial resolution, Number of spectral bands, spectral bandwidth, signal-to-noise ration, etc.) is a complex problem due to strong correlation among these parameters.
  • 10.
    RS Sensors Characteristics GNR401Dr. A. Bhattacharya 10  Sensors parameter under 4 domains:  1. Spatial  2. Spectral  3. Radiometric  4. Temporal
  • 11.
    Spatial Resolution GNR401 Dr.A. Bhattacharya 11  Measure of the sensor ability to image closely spaced objects so that they are distinguishable as separate objects  The theoretical limit of resolving two objects by a imaging system (Lens) is due to diffraction of the EM wave  Without any lens aberration (not possible !) one expects the lens to image a point object as a point in the image plane
  • 12.
    Spatial Resolution GNR401 Dr.A. Bhattacharya 12  The image of a point will consists of bright disc surrounded by concentric bright and dark rings called Airy patterns. h Wavelengt length Focal lens the of Aperture     f D The distribution of energy in the Airy pattern due to circular aperture. The diameter of the first minima is f D) / ( 44 . 2 
  • 13.
    Spatial Resolution GNR401 Dr.A. Bhattacharya 13  Two objects can be just resolved if the peak of the Airy pattern of one object falls on the first minima of the other separated by: (theoretical limit) ) 1.22( : resolution Angular OR ) / ( 22 . 1 D f D    Unresolved Just resolved
  • 14.
    Spatial Resolution GNR401 Dr.A. Bhattacharya 14  When electronic sensors using discrete detectors are used for generating imagery (Landsat MSS, IRS LISS, etc.)  Spatial resolution is used to denote the projection of the detector element on the ground  An Landsat ETM+ scene has an Instantaneous Field Of View (IFOV) of 30 meters in bands 1-5 and 7 while band 6 has an IFOV of 60 meters on the ground and the band 8 an IFOV of 15 meters
  • 15.
    Spatial Resolution GNR401 Dr.A. Bhattacharya 15  IFOV in radians :  d is the dimension of the detector  f is the focal length  The advantage of using IFOV is that, it characterizes a sensor irrespective of the altitude of the sensor.  The information in the IFOV is represented by a pixel.  The field of view (FOV) is the total view of the camera which defines the swath f d /
  • 16.
    Spectral Resolution GNR401 Dr.A. Bhattacharya 16  In multi-spectral RS, the variation in reflected/emitted spectral radiation is used to distinguish various features  It is rather difficult (nor essential in most cases) to get continuous spectral information  We sample the reflected/emitted spectrum by making measurements at few selected bands  The wavelength region of observation : Spectral bands is defined in terms of  Central wavelength  Band width c   
  • 17.
    Spectral Resolution GNR401 Dr.A. Bhattacharya 17 3 Aspects of spectral band selection • Location of the central wavelength • The bandwidth • The total number of bands Bandwidth is defined by: The spectral resolution The wavelength interval in which the observation is made. Smaller the , higher the spectral resolution h) wavelengt off - (cut and ) (lower               Full width at half maximum(FWHM)
  • 18.
    Spectral Resolution GNR401 Dr.A. Bhattacharya 18 IRS LISS, Band 1 is 0.45µm – 0.52µm ?  In an ideal system the response should be 1 between the wavelength 0.45µm – 0.52µm and 0 for wavelengths outside  Not practicable !  Bandwidth is defined in terms of 50% of the peak value on either side (holds for Gaussian system)  In practice, the pass band response has number of ‘ringings’ and assigning the peak value is not a straightforward process  Techniques: method of moments to compute and (computationally involved) c   
  • 19.
  • 20.
    Location of spectralbands GNR401 Dr. A. Bhattacharya 20  Important criteria for location of spectral bands:  In the atmospheric window and away from the absorption bands  Certain spectral bands are best suited for specific themes  The bands selected should be un-correlated to the extent possible (statistical methods to evaluate correlation between bands)  Minimum set of optimal bands  Study showed that addition of middle IR band with any other band combination gives improved separability in agriculture classification
  • 21.
    Radiometric Resolution GNR401 Dr.A. Bhattacharya 21  Constant ratio :  The difference in the radiance of the objects in a scene plays an important role in their detection  The contrast is usually defined usually w.r.t to 2 adjacent areas  Contrast modulation : min max/ L L CR  ) /( ) ( min max min max L L L L CM   
  • 22.
    Radiometric Resolution GNR401 Dr.A. Bhattacharya 22  The contrast in the image is different from that of the scene (object plane)  The degradation of the contrast by imaging system is represented by the Modulation Transfer Function (MTF) MTF =
  • 23.
    Radiometric Resolution GNR401 Dr.A. Bhattacharya 23  In computer classification of the features from RS data  Statistical difference in the reflected value measured by the instrument  The absolute value of the reflectance (or radiance) is not important since one compares the relative reflectance value between pixels  However, if one needs two date data for classification or information fusion, then it is mandatory to have the absolute radiance value
  • 24.
    Radiometric Resolution GNR401 Dr.A. Bhattacharya 24 MTF effect on radiometry: The ‘square’ wave pattern gives the actual radiance from three targets- barley, mildewed barley (MB) and sand. Two fields of mildewed barley- (a)one amongst barley and (b) one among sand. The ‘sine curve’ gives the radiance when measured with a radiometer. The MTF of the radiometer modifies the radiance value. Mildewed barley (MB) both (a) and (b) have same radiance (3.85). But due to radiometer MTF, the MB at (a) shows a lower value (3.6), while MB at (b) shows a higher value of (4.02). In case (b) the higher radiance of sand spills over to MB and reverse in (a).