As investors grow fearful, they sell riskier assets, like stocks, and buy safe haven assets such as U.S. Treasuries and gold. As they grow more confident, they seek higher returns by re-investing in stocks. We designed the Select Directional ETF Model (SD Model) with a simple premise, buy the best performing assets and sell the laggards.
The SD Model begins with eleven strategically selected ETFs, each representing a distinct asset class. The SD Model’s objective ranking system and rebalancing rules ensure the portfolio stays invested in only the three highest ranked ETFs. A white paper containing more information regarding the SD Model is available at http://successfulportfolios.com.
netwealth educational webinar - The evolution of asset allocationnetwealthInvest
On April 14, 2016 Tracey McNaughton, Head of Investment Strategy at UBS presented to financial advisers on the evolution of asset allocation during a netwealth educational webinar.
Netwealth portfolio construction series - Why you should consider investing o...netwealthInvest
Julian Beaumont from Bennelong Australian Equity Partners presented a webinar session on how to invest outside of the top 20 ASX stocks, for Netwealth on May 26, 2016.
Strategies for positive returns in volatile marketsnetwealthInvest
Part of Netwealth's portfolio construction webinar series - ST Wong from Prime Value presented to an audience on 14th June 2016 on the topic of absolute investing.
This is to compare the Returns of Fixed Deposits and Debt Oriented Hybrid Funds [Capital Protection Oriented Fund / Scheme (CPOF), Mutual Fund Monthly Income Plan / Scheme (MIP), Equity Savings Funds], to demonstrate how the latter is better.
Analyse of the endowment model employed by Harvard and Yale and identify the reasons why Harvard made more losses than the other endowment funds in 2009
Bring structure to your financial plan with our visually appealing Financial Concepts Risk Return PowerPoint Presentation Slides. The content ready portfolio risk and return analysis PowerPoint compete deck comprises of PPT slides such as risk and return of stock bonds, and T-bills, investment strategies of predefined portfolios, risk and return of portfolio manager, measuring stock volatility, proportionate, portfolio return analysis, calculating asset beta, portfolio value at risk, ranking the passive income streams impact of to name a few. Furthermore, to cover all the important concepts our designers have included additional slides like meet our team, mission and vision, comparison, timeline, financial, sticky notes, target, contact us, etc. Since all our slides are fully editable, you can easily customize it as per your needs. The visually appealing portfolio risk-return in security analysis PPT template can keep your audience engaged. Get access to this risk and return relationship PowerPoint template to design risk management strategies. Facilitate the joining of hands with our Financial Concepts Risk Return PowerPoint Presentation Slides. Improve the chances of cohesive action.
Financial analysts are concerned with factors, or common sources of risk that contribute to changes in asset prices. Analysts may be able to control a portfolio’s risk more efficiently and perhaps even improve its returns by identifying such factors.
Factor analysis is a powerful tool for quantifying the risk profile of a portfolio, constructing a portfolio relative to a benchmark, and controlling risk.
Myths and Realities of ETFs and Index Investing - Ananth Madhavan, Managing Director, Global Head of Research for ETF and Index Investing, BlackRock
Presented at the AQR Asset Management Institute conference, Perspectives: Systemic Risk in Asset Management held on 26 April 2017 at London Business School.
Portfolio Risk And Return Analysis PowerPoint Presentation Slides SlideTeam
Presenting this set of slides with name - Portfolio Risk And Return Analysis Powerpoint Presentation Slides. Enhance your audiences knowledge with this well researched complete deck. Showcase all the important features of the deck with perfect visuals. This deck comprises of total of twenty nine slides with each slide explained in detail. Each template comprises of professional diagrams and layouts. Our professional PowerPoint experts have also included icons, graphs and charts for your convenience. All you have to do is DOWNLOAD the deck. Make changes as per the requirement. Yes, these PPT slides are completely customizable. Edit the colour, text and font size. Add or delete the content from the slide. And leave your audience awestruck with the professionally designed Portfolio Risk And Return Analysis Powerpoint Presentation Slides complete deck.
In this presentation, we review methods and best practices for the portfolio construction and evaluation process. The presentation covers risk and return estimation, mean-variance optimization as well as techniques for analyzing exposure to loss and wealth potential.
Julia Butler - The Fiduciary Group - Best Practices for Meeting Fiduciary Dut...Downey Brand LLP
In her presentation at the 2015 Savannah Fiduciary Seminar, Julia Butler of the Fiduciary Group describes how plan sponsors, trustees, and investment committees can best meet their fiduciary duties to manage the plan’s investments. She outlines what should be in an effective Investment Policy Statement, and lays out the fiduciary processes to select, monitor, and replace the plan’s investment options. She also explains how a Section 3(38) fiduciary investment advisor can significantly reduce or eliminate a plan sponsor’s fiduciary liability for plan investments.
Smartsheet Inc. provides cloud-based enterprise platform to plan, capture, manage, automate, and report on work for teams and organizations. The company offers Dashboards for real-time visibility into the status of work to align individuals, managers, and executives.
Based on the Smartsheet Inc stock forecasts from 13 analysts, the average analyst target price for Smartsheet Inc is USD 63.50 over the next 12 months. Smartsheet Inc’s average analyst rating is Strong Buy. Stock Target Advisor’s own stock analysis of Smartsheet Inc is Bearish, which is based on 1 positive signals and 3 negative signals. At the last closing, Smartsheet Inc’s stock price was USD 37.76. Smartsheet Inc’s stock price has changed by +4.22% over the past week, -13.51% over the past month and -40.00% over the last year.
If your company needs to submit a Investment Advisory PowerPoint Presentation Slides look no further.Our researchers have analyzed thousands of proposals on this topic for effectiveness and conversion. Just download our template, add your company data and submit to your client for a positive response. http://bit.ly/2UCGDB8
In a matter of minutes, you can generate a detailed report with a side-by-side comparison that addresses the opportunities discovered in The Retirement Plan Diagnostic™. Communicate the features, benefits and overall impact of your value proposition in a concise format that's co-branded and customized to your firm's unique investment models and menus.
This tool is fully integrated with PlanFinder SM and The Retirement Plan Diagnostic SM for seamless data transfer from previously collected prospective plans. With the Retirement Plan Efficiency Analysis SM , you can save significant time and money while delivering tangible value in client meetings.
If your company needs to submit a Financial Advisory Proposal PowerPoint Presentation Slides look no further.Our researchers have analyzed thousands of proposals on this topic for effectiveness and conversion. Just download our template, add your company data and submit to your client for a positive response. http://bit.ly/2HwkAEs
Here is our topic-specific Investment Management Analysis Powerpoint Presentation Slides for portfolio strategy and implementation. The professionally designed wealth management PowerPoint complete deck has various professional looking PPT slides such as introduction to investments, objectives of portfolio management, types of investment, market scenario overview investment instruments, securities portfolio, analysis and valuation of equity securities, industry analysis PESTEL, SWOT analysis, discounted cash flow method, financial statement analysis, company cash flow statement, issues inefficient markets, technical analysis types, investment in special situations, fixed income and leveraged securities, bond valuation system, reinvestment risk table, type of convertible securities, options analysis, warrants summarization overview, derivative products, put and call options, stock index futures and options, stock indexes comparison table, broaden the investment perspective, international security market highlights, global market trends, mutual funds investment criteria overview, investment in real estate, diversified real estate classification, KPIs and dashboards, etc. Download the wealth management presentation deck to achieve your investment objectives. Charge up your audience with our Investment Management Analysis Powerpoint Presentation Slides. They will get completely energized.
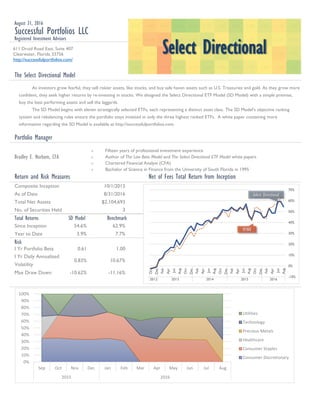
1. The Select Directional Model
Portfolio Manager
Composite Inception
As of Date
Total Net Assets
No. of Securities Held
Total Returns SD Model Benchmark
Since Inception 54.6% 62.9%
Year to Date 3.9% 7.7%
Risk
I Yr Portfolio Beta 0.61 1.00
Max Draw Down -10.62% -11.16%
August 31, 2016
Successful Portfolios LLC
Registered Investment Advisors
As investors grow fearful, they sell riskier assets, like stocks, and buy safe haven assets such as U.S. Treasuries and gold. As they grow more
confident, they seek higher returns by re-investing in stocks. We designed the Select Directional ETF Model (SD Model) with a simple premise,
buy the best performing assets and sell the laggards.
The SD Model begins with eleven strategically selected ETFs, each representing a distinct asset class. The SD Model’s objective ranking
system and rebalancing rules ensure the portfolio stays invested in only the three highest ranked ETFs. A white paper containing more
information regarding the SD Model is available at http://successfulportfolios.com.
Bradley E. Norbom, CFA
Net of Fees Total Return from Inception
10/1/2012
8/31/2016
$2,104,693
Return and Risk Measures
3
I Yr Daily Annualized
Volatility
0.83% 10.67%
Historical Sector Walk
-10%
0%
10%
20%
30%
40%
50%
60%
70%
Oct
Dec
Feb
Apr
Jun
Aug
Oct
Dec
Feb
Apr
Jun
Aug
Oct
Dec
Feb
Apr
Jun
Aug
Oct
Dec
Feb
Apr
Jun
Aug
2012 2013 2014 2015 2016
Select Directional
Fifteen years of professional investment experience
Author of The Low Beta Model and The Select Directional ETF Model white papers
Chartered Financial Analyst (CFA)
Bachelor of Science in Finance from the University of South Florida in 1995
VFINX
Select Directional
611 Druid Road East, Suite 407
Clearwater, Florida 33756
http://successfulportfolios.com/
0%
10%
20%
30%
40%
50%
60%
70%
80%
90%
100%
Sep Oct Nov Dec Jan Feb Mar Apr May Jun Jul Aug
2015 2016
Utilities
Technology
Precious Metals
Healthcare
Consumer Staples
Consumer Discretionary
2. Summary of Actual Monthly Returns (Net of Fees)
Jan Feb Mar Apr May Jun Jul Aug Sep Oct Nov Dec YTD
Select Directional -2.88% 0.87% 5.03% -2.85% -0.02% 7.12% 0.08% -3.03% 3.89%
VFINX Total Return -4.98% -0.16% 6.79% 0.37% 1.77% 0.23% 3.67% 0.15% 7.69%
Select Directional 0.09% 1.91% -1.39% -1.01% 2.38% -1.36% 3.45% -6.57% -2.54% 5.40% -0.56% -0.77% -1.50%
VFINX Total Return -3.02% 5.73% -1.57% 0.97% 1.27% -1.92% 2.08% -6.04% -2.49% 8.43% 0.29% -1.59% 1.30%
Select Directional -3.15% 5.37% -1.11% -0.20% 2.50% 0.78% -1.48% 3.12% -0.28% 2.38% 3.07% -0.59% 10.57%
VFINX Total Return -3.47% 4.56% 0.82% 0.72% 2.34% 2.04% -1.40% 3.99% -1.42% 2.42% 2.71% -0.26% 13.51%
Select Directional 6.93% 1.46% 4.73% 1.78% 2.32% -0.23% 6.17% -3.86% 3.73% 3.94% 4.10% 2.05% 38.00%
VFINX Total Return 5.16% 1.33% 3.74% 1.89% 2.33% -1.34% 5.08% -2.92% 3.14% 4.62% 2.99% 2.51% 32.15%
Select Directional -2.67% 0.84% 0.88% -1.00%
VFINX Total Return -1.87% 0.58% 0.89% -0.42%
Select Directional Universe
XLK - Technology Select Sector SPDR Fund 47$ 33.2% Technology
XLU - Utilities Select Sector SPDR Fund 49$ 33.0% Utilities
GLD - SPDR Gold Trust 125$ 32.4% Precious Metals
XLB - Materials Select Sector SPDR Fund Materials
SHY - iShares 1-3 Year Treasury Bond ETF 85$ Short Term Treasuries
XLP - Consumer Staples Select Sector SPDR 54$ Consumer Staples
XLV - Health Care Select Sector SPDR Fund 73$ Healthcare
XLE - Energy Select Sector SPDR Fund 69$ Energy
XLY - Consumer Discretionary Select Sector 81$ Consumer Discretionary
XLF - Financial Select Sector SPDR Fund 25$ Financial
XLI - Industrial Select Sector SPDR Fund 59$ Industrials
Additional Information
Total Net Assets - Includes only the fee paying accounts invested in the SD Model.
1 Yr Portfolio Beta - Calculated from daily returns using the Excel formula =Slope(y,x).
I Yr Daily Annualized Volatility - Calculated as the standard deviation sample of the 252 most recent daily returns.
A cash balance is included when calculating Total Returns. The SD Model's cash balance is typically 1% of the portfolio.
Benchmark - Total Return of the Vanguard 500 Index Investor Fund (VFINX), an investable proxy for the S&P 500 Index.
Recent Price - The closing price for a stock as of the date of the report and retrieved from Interactive Brokers.
Max Draw Down - The greatest percent change from peak to trough.
Performance is expressed in US Dollars.
Firm Definition
Successful Portfolios LLC is an independent Registered Investment Advisor formed in February 2010.
Successful Portfolios LLC has no affiliations with any other investment advisors. For further information regarding our firm,
fee structure, and our qualifications, please visit successfulportfolios.com.
Successful Portfolios LLC claims compliance with the Global Investment Performance Standards (GIPS®).
Composite Definition and Description
The Select Directional (SD) Model Composite is a carve-out composite. A carve-out represents a specific strategy within a portfolio
with a broader strategic investment mandate. The total return calculation for the SD Model Composite is net of fees and includes
a cash position, usually about 1%. The SDM is a rotational ETF strategy that rebalances monthly to the top 3 price performing ETFs
in a universe consisting of all 9 Select Sector Spyder ETFs, the SPDR Gold Shares ETF, and the iShares Short Term Treasuries ETF.
A white paper with more information regarding the SDM is available at http://successfulportfolios.com. A list of all composites with
descriptions is available upon request.
Risks
Past returns or simulated results are not indicative of future performance. While we took steps to mitigate hindsight bias
when developing the SD Model, simulated performance was nonetheless performed on historical data. We believe the data
provided by Portfolio 123 to be accurate; however, we can make no guarantee of past or future data reliability.
The portfolio manager, in his sole discretion, may override model investment decisions when he deems it to be in the
best interest of the client.
20162015201420132012
Ticker - Description
Recent
Price
Port.
Weight
Sector