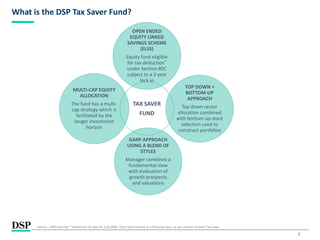
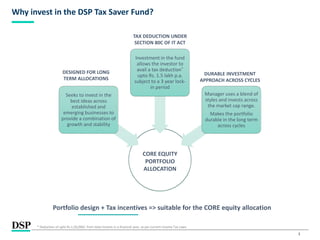
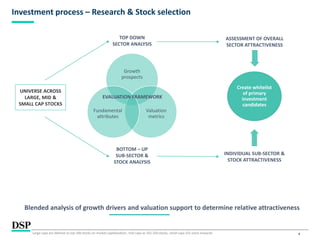
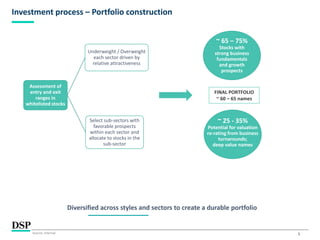
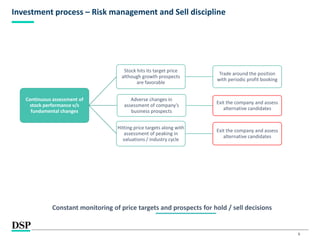
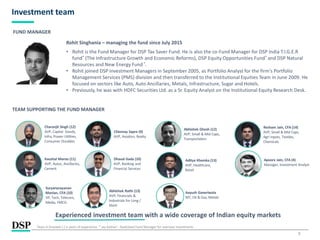
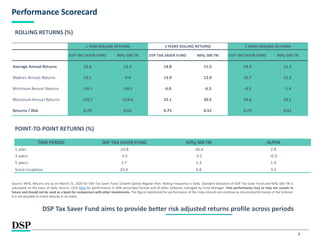
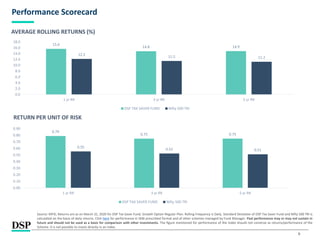
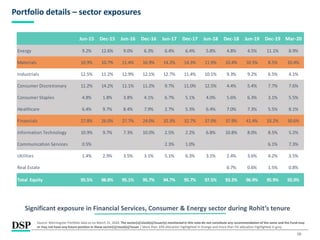
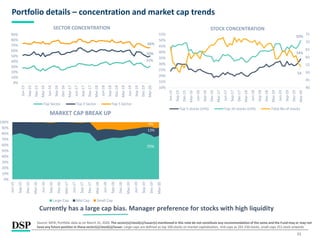
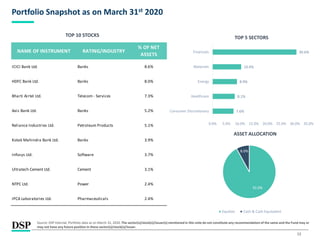
[Title to come]
[Sub-Title to come]
Strictly for Intended Recipients OnlyDate
* DSP India Fund is the Company incorporated in Mauritius, under which ILSF is the corresponding share class
March 2020
| People | Processes | Performance |
DSP Tax Saver Fund
2
What is the DSP Tax Saver Fund?
TAX SAVER
FUND
OPEN ENDED
EQUITY LINKED
SAVINGS SCHEME
(ELSS)
Equity fund eligible
for tax deduction*
under Section 80C
subject to a 3 year
lock in
TOP DOWN +
BOTTOM-UP
APPROACH
Top down sector
allocation combined
with bottom-up stock
selection used to
construct portfolios
GARP APPROACH
USING A BLEND OF
STYLES
Manager combines a
fundamental view
with evaluation of
growth prospects
and valuations
MULTI-CAP EQUITY
ALLOCATION
The fund has a multi-
cap strategy which is
facilitated by the
longer investment
horizon
Source – DSP Internal. * Deduction of upto Rs.1,50,000/- from total income in a financial year, as per current Income Tax Laws.
3
Why invest in the DSP Tax Saver Fund?
Seeks to invest in the
best ideas across
established and
emerging businesses to
provide a combination of
growth and stability
Investment in the fund
allows the investor to
avail a tax deduction*
upto Rs. 1.5 lakh p.a.
subject to a 3 year lock-
in period
Manager uses a blend of
styles and invests across
the market cap range.
Makes the portfolio
durable in the long term
across cycles
DESIGNED FOR LONG
TERM ALLOCATIONS
DURABLE INVESTMENT
APPROACH ACROSS CYCLES
Portfolio design + Tax incentives => suitable for the CORE equity allocation
CORE EQUITY
PORTFOLIO
ALLOCATION
TAX DEDUCTION UNDER
SECTION 80C OF IT ACT
* Deduction of upto Rs.1,50,000/- from total income in a financial year, as per current Income Tax Laws.
4
Investment process – Research & Stock selection
TOP DOWN
SECTOR ANALYSIS
UNIVERSE ACROSS
LARGE, MID &
SMALL CAP STOCKS
BOTTOM – UP
SUB-SECTOR &
STOCK ANALYSIS
Blended analysis of growth drivers and valuation support to determine relative attractiveness
Growth
prospects
Valuation
metrics
Fundamental
attributes
Create whitelist
of primary
investment
candidates
ASSESSMENT OF OVERALL
SECTOR ATTRACTIVENESS
INDIVIDUAL SUB-SECTOR &
STOCK ATTRACTIVENESS
EVALUATION FRAMEWORK
Large-caps are defined as top 100 stocks on market capitalization, mid-caps as 101-250 stocks, small-caps 251 stock onwards
5
Investment process – Portfolio construction
Assessment of
entry and exit
ranges in
whitelisted stocks
Underweight / Overweight
each sector driven by
relative attractiveness
Select sub-sectors with
favorable prospects
within each sector and
allocate to stocks in the
sub-sector
Diversified across styles and sectors to create a durable portfolio
~ 65 – 75%
Stocks with
strong business
fundamentals
and growth
prospects
FINAL PORTFOLIO
~ 60 – 65 names
~ 25 - 35%
Potential for valuation
re-rating from business
turnarounds;
deep value names
Source: Internal
6
Investment process – Risk management and Sell discipline
Continuous assessment of
stock performance v/s
fundamental changes
Stock hits its target price
although growth prospects
are favorable
Trade around the position
with periodic profit booking
Adverse changes in
assessment of company’s
business prospects
Exit the company and assess
alternative candidates
Hitting price targets along with
assessment of peaking in
valuations / industry cycle
Exit the company and assess
alternative candidates
Constant monitoring of price targets and prospects for hold / sell decisions
7
Investment team
Rohit Singhania – managing the fund since July 2015
• Rohit is the Fund Manager for DSP Tax Saver Fund. He is also the co-Fund Manager for DSP India T.I.G.E.R
fund* (The Infrastructure Growth and Economic Reforms), DSP Equity Opportunities Fund* and DSP Natural
Resources and New Energy Fund*.
• Rohit joined DSP Investment Managers in September 2005, as Portfolio Analyst for the firm's Portfolio
Management Services (PMS) division and then transferred to the Institutional Equities Team in June 2009. He
focused on sectors like Auto, Auto Ancillaries, Metals, Infrastructure, Sugar and Hotels.
• Previously, he was with HDFC Securities Ltd. as a Sr. Equity Analyst on the Institutional Equity Research Desk.
Chinmay Sapre (9)
AVP, Aviation, Realty
Abhishek Ghosh (12)
AVP, Small & Mid Caps,
Transportation
Kaushal Maroo (11)
AVP, Autos, Ancillaries,
Cement
Charanjit Singh (12)
AVP, Capital Goods,
Infra, Power Utilities,
Consumer Durables
Dhaval Gada (10)
AVP, Banking and
Financial Services
Apoorv Jain, CFA (4)
Manager, Investment Analyst
Abhishek Rathi (13)
AVP, Financials &
Industrials for Long /
Short
Aayush Ganeriwala
MT, Oil & Gas, Metals
TEAM SUPPORTING THE FUND MANAGER
Experienced investment team with a wide coverage of Indian equity markets
FUND MANAGER
Years in brackets ( ) is years of experience. * Jay Kothari - Dedicated Fund Manager for overseas investments
Aditya Khemka (13)
AVP, Healthcare,
Retail
Suryanarayanan
Manian, CFA (10)
VP, Tech, Telecom,
Media, FMCG
Resham Jain, CFA (14)
AVP, Small & Mid Caps,
Agri inputs, Textiles,
Chemicals
8
Performance Scorecard
Source: MFIE; Returns are as on March 31, 2020 for DSP Tax Saver Fund, Growth Option Regular Plan. Rolling Frequency is Daily. Standard Deviation of DSP Tax Saver Fund and Nifty 500 TRI is
calculated on the basis of daily returns. Click here for performance in SEBI prescribed format and of other schemes managed by Fund Manager. Past performance may or may not sustain in
future and should not be used as a basis for comparison with other investments. The figure mentioned for performance of the index should not construe as returns/performance of the Scheme.
It is not possible to invest directly in an index.
ROLLING RETURNS (%)
DSP Tax Saver Fund aims to provide better risk adjusted returns profile across periods
POINT-TO-POINT RETURNS (%)
DSP TAX SAVER FUND Nifty 500 TRI DSP TAX SAVER FUND Nifty 500 TRI DSP TAX SAVER FUND Nifty 500 TRI
Average Annual Returns 15.6 12.2 14.8 11.5 14.9 11.2
Median Annual Returns 12.1 9.4 13.9 12.0 15.7 11.5
Minimum Annual Returns -59.1 -59.5 -6.0 -6.3 -0.5 -1.4
Maximum Annual Returns 120.7 118.6 32.1 30.5 24.6 22.1
Returns / Risk 0.79 0.55 0.75 0.52 0.75 0.51
1 YEAR ROLLING RETURNS 3 YEARS ROLLING RETURNS 5 YEARS ROLLING RETURNS
TIME PERIOD DSP TAX SAVER FUND Nifty 500 TRI ALPHA
1 year -23.8 -26.6 2.8
3 years -3.5 -3.1 -0.3
5 years 2.7 1.3 1.4
Since Inception 10.4 6.8 3.5
9
Performance Scorecard
Source: MFIE; Returns are as on March 31, 2020 for DSP Tax Saver Fund, Growth Option Regular Plan. Rolling Frequency is Daily. Standard Deviation of DSP Tax Saver Fund and Nifty 500 TRI is
calculated on the basis of daily returns. Click here for performance in SEBI prescribed format and of other schemes managed by Fund Manager. Past performance may or may not sustain in
future and should not be used as a basis for comparison with other investments. The figure mentioned for performance of the index should not construe as returns/performance of the
Scheme. It is not possible to invest directly in an index.
AVERAGE ROLLING RETURNS (%)
RETURN PER UNIT OF RISK
15.6
14.8 14.9
12.2
11.5 11.2
0.0
2.0
4.0
6.0
8.0
10.0
12.0
14.0
16.0
18.0
1 yr RR 3 yr RR 5 yr RR
DSP TAX SAVER FUND Nifty 500 TRI
0.79
0.75 0.75
0.55
0.52 0.51
0.00
0.10
0.20
0.30
0.40
0.50
0.60
0.70
0.80
0.90
1 yr RR 3 yr RR 5 yr RR
DSP TAX SAVER FUND Nifty 500 TRI
10
Portfolio details – sector exposures
Significant exposure in Financial Services, Consumer & Energy sector during Rohit’s tenure
Source: Morningstar Portfolio data as on March 31, 2020. The sector(s)/stock(s)/issuer(s) mentioned in this note do not constitute any recommendation of the same and the Fund may
or may not have any future position in these sector(s)/stock(s)/issuer | More than 10% allocation highlighted in Orange and more than 5% allocation highlighted in grey
Jun-15 Dec-15 Jun-16 Dec-16 Jun-17 Dec-17 Jun-18 Dec-18 Jun-19 Dec-19 Mar-20
Energy 9.2% 12.6% 9.0% 6.3% 6.4% 6.4% 5.8% 4.8% 4.5% 11.1% 8.9%
Materials 10.9% 10.7% 11.4% 16.9% 14.2% 14.3% 11.9% 10.4% 10.5% 8.5% 10.4%
Industrials 12.5% 11.2% 12.9% 12.1% 12.7% 11.4% 10.1% 9.3% 9.2% 6.5% 4.1%
Consumer Discretionary 11.2% 14.2% 11.1% 11.2% 9.7% 11.0% 12.5% 4.4% 5.4% 7.7% 7.6%
Consumer Staples 4.8% 1.8% 3.8% 4.1% 6.7% 5.1% 4.0% 5.6% 6.3% 3.1% 5.5%
Healthcare 6.4% 9.7% 8.4% 7.9% 2.7% 5.3% 6.4% 7.0% 7.3% 5.5% 8.1%
Financials 27.8% 26.0% 27.7% 24.0% 32.3% 32.7% 37.0% 37.9% 41.4% 33.2% 30.6%
Information Technology 10.9% 9.7% 7.3% 10.0% 2.5% 2.2% 6.8% 10.8% 8.0% 8.5% 5.2%
Communication Services 0.5% 2.3% 1.0% 6.1% 7.3%
Utilities 1.4% 2.9% 3.5% 3.1% 5.1% 6.3% 3.1% 2.4% 3.6% 4.2% 3.5%
Real Estate 0.7% 0.6% 1.5% 0.8%
Total Equity 95.5% 98.8% 95.1% 95.7% 94.7% 95.7% 97.5% 93.3% 96.9% 95.9% 92.0%
0%
10%
20%
30%
40%
50%
60%
70%
80%
90%
100%
Jun-15
Sep-15
Dec-15
Mar-16
Jun-16
Sep-16
Dec-16
Mar-17
Jun-17
Sep-17
Dec-17
Mar-18
Jun-18
Sep-18
Dec-18
Mar-19
Jun-19
Sep-19
Dec-19
Mar-20
MARKET CAP BREAK UP
Large Cap Mid Cap Small Cap
11
Portfolio details – concentration and market cap trends
Source: MFIE; Portfolio data as on March 31, 2020. The sector(s)/stock(s)/issuer(s) mentioned in this note do not constitute any recommendation of the same and the Fund may or may not
have any future position in these sector(s)/stock(s)/issuer. Large-caps are defined as top 100 stocks on market capitalization, mid-caps as 101-250 stocks, small-caps 251 stock onwards
70%
Currently has a large cap bias. Manager preference for stocks with high liquidity
9%
STOCK CONCENTRATIONSECTOR CONCENTRATION
13%
34%
50%
54
40
45
50
55
60
65
70
75
10%
15%
20%
25%
30%
35%
40%
45%
50%
55%
Jun-15
Sep-15
Dec-15
Mar-16
Jun-16
Sep-16
Dec-16
Mar-17
Jun-17
Sep-17
Dec-17
Mar-18
Jun-18
Sep-18
Dec-18
Mar-19
Jun-19
Sep-19
Dec-19
Mar-20
Top 5 stocks (LHS) Top 10 stocks (LHS) Total No of stocks
31%
50%
66%
0%
10%
20%
30%
40%
50%
60%
70%
80%
90%
Jun-15
Sep-15
Dec-15
Mar-16
Jun-16
Sep-16
Dec-16
Mar-17
Jun-17
Sep-17
Dec-17
Mar-18
Jun-18
Sep-18
Dec-18
Mar-19
Jun-19
Sep-19
Dec-19
Mar-20
Top Sector Top 3 Sector Top 5 Sector
12
Portfolio Snapshot as on March 31st 2020
Source: DSP Internal; Portfolio data as on March 31, 2020. The sector(s)/stock(s)/issuer(s) mentioned in this note do not constitute any recommendation of the same and the Fund may or
may not have any future position in these sector(s)/stock(s)/issuer.
2%
11%11%
8%
14%
74%
TOP 10 STOCKS TOP 5 SECTORS
ASSET ALLOCATION
NAME OF INSTRUMENT RATING/INDUSTRY
% OF NET
ASSETS
ICICI Bank Ltd. Banks 8.6%
HDFC Bank Ltd. Banks 8.0%
Bharti Airtel Ltd. Telecom - Services 7.3%
Axis Bank Ltd. Banks 5.2%
Reliance Industries Ltd. Petroleum Products 5.1%
Kotak Mahindra Bank Ltd. Banks 3.9%
Infosys Ltd. Software 3.7%
Ultratech Cement Ltd. Cement 3.1%
NTPC Ltd. Power 2.4%
IPCA Laboratories Ltd. Pharmaceuticals 2.4%
7.6%
8.1%
8.9%
10.4%
30.6%
0.0% 5.0% 10.0% 15.0% 20.0% 25.0% 30.0% 35.0%
Consumer Discretionary
Healthcare
Energy
Materials
Financials
92.0%
8.0%
Equities Cash & Cash Equivalent
13
Disclaimer & Product Labeling Details
In this material DSP Investment Managers Pvt. Ltd. (the AMC) has used information that is publicly available, including information developed in-house. Information gathered and used in this material is
believed to be from reliable sources. The AMC however does not warrant the accuracy, reasonableness and / or completeness of any information. The data/statistics are given to explain general market
trends in the securities market, it should not be construed as any research report/research recommendation. We have included statements / opinions / recommendations in this document, which contain
words, or phrases such as “will”, “expect”, “should”, “believe” and similar expressions or variations of such expressions that are “forward looking statements”. Actual results may differ materially from
those suggested by the forward looking statements due to risk or uncertainties associated with our expectations with respect to, but not to, exposure to market risks, general economic and political
conditions in India and other countries globally, which have an impact on our services and / or investments, the monetary and interest policies of India, inflation, deflation, unanticipated turbulence in
interest rates, foreign exchange rates, equity prices or other rates or prices etc. The sector(s)/stock(s)/issuer(s) mentioned in this presentation do not constitute any research report/recommendation of
the same and may or may not have any future position in these sector(s)/stock(s)/issuer(s). The portfolio of the scheme is subject to changes within the provisions of the Scheme Information document of
the scheme. Please refer to the SID for investment pattern, strategy and risk factors. Past performance may or may not sustain in future and should not be used as a basis for comparison with other
investments. For Schemes Performance in SEBI prescribed format refer annexure as attached with this presentation. All figures and other data given in this document are as on March 31st, 2020 (unless
otherwise specified) and the same may or may not be relevant in future and the same should not be considered as solicitation/ recommendation/guarantee of future investments by the AMC or its
affiliates. Investors are advised to consult their own legal, tax and financial advisors to determine possible tax, legal and other financial implication or consequence of subscribing to the units of DSP Mutual
Fund. For scheme specific risk factors and more details, please read the Scheme Information Document, Statement of Additional Information and Key Information Memorandum of respective Scheme
available on ISC of AMC and also available on www.dspim.com. For Index disclaimer click here
The distribution of this material in certain jurisdictions may be restricted or subject to registration requirements and, accordingly, persons who come into possession of this material in such jurisdictions are
required to inform themselves about, and to observe, any such restrictions
The strategy mentioned has been currently followed by the Scheme and the same may change in future depending on market conditions and other factors. Large-caps are defined as top 100 stocks on
market capitalization, mid-caps as 101-250 , small-caps as 251 and above.
Mutual Fund investments are subject to market risks, read all scheme related documents carefully.
Scheme Product Suitability Riskometer
DSP Tax Saver Fund
(An open ended equity linked saving
scheme with a statutory lock in of 3 years
and tax benefit)
The Open ended equity linked saving scheme is suitable for investors who are
seeking*
Long-term capital growth with a three-year lock-in
Investment in equity and equity-related securities to form a diversified portfolio
*Investors should consult their financial advisers if in doubt about whether the Scheme is suitable for them.

DSP Tax Saver Fund

  • 1.
    [Title to come] [Sub-Titleto come] Strictly for Intended Recipients OnlyDate * DSP India Fund is the Company incorporated in Mauritius, under which ILSF is the corresponding share class March 2020 | People | Processes | Performance | DSP Tax Saver Fund
  • 2.
    2 What is theDSP Tax Saver Fund? TAX SAVER FUND OPEN ENDED EQUITY LINKED SAVINGS SCHEME (ELSS) Equity fund eligible for tax deduction* under Section 80C subject to a 3 year lock in TOP DOWN + BOTTOM-UP APPROACH Top down sector allocation combined with bottom-up stock selection used to construct portfolios GARP APPROACH USING A BLEND OF STYLES Manager combines a fundamental view with evaluation of growth prospects and valuations MULTI-CAP EQUITY ALLOCATION The fund has a multi- cap strategy which is facilitated by the longer investment horizon Source – DSP Internal. * Deduction of upto Rs.1,50,000/- from total income in a financial year, as per current Income Tax Laws.
  • 3.
    3 Why invest inthe DSP Tax Saver Fund? Seeks to invest in the best ideas across established and emerging businesses to provide a combination of growth and stability Investment in the fund allows the investor to avail a tax deduction* upto Rs. 1.5 lakh p.a. subject to a 3 year lock- in period Manager uses a blend of styles and invests across the market cap range. Makes the portfolio durable in the long term across cycles DESIGNED FOR LONG TERM ALLOCATIONS DURABLE INVESTMENT APPROACH ACROSS CYCLES Portfolio design + Tax incentives => suitable for the CORE equity allocation CORE EQUITY PORTFOLIO ALLOCATION TAX DEDUCTION UNDER SECTION 80C OF IT ACT * Deduction of upto Rs.1,50,000/- from total income in a financial year, as per current Income Tax Laws.
  • 4.
    4 Investment process –Research & Stock selection TOP DOWN SECTOR ANALYSIS UNIVERSE ACROSS LARGE, MID & SMALL CAP STOCKS BOTTOM – UP SUB-SECTOR & STOCK ANALYSIS Blended analysis of growth drivers and valuation support to determine relative attractiveness Growth prospects Valuation metrics Fundamental attributes Create whitelist of primary investment candidates ASSESSMENT OF OVERALL SECTOR ATTRACTIVENESS INDIVIDUAL SUB-SECTOR & STOCK ATTRACTIVENESS EVALUATION FRAMEWORK Large-caps are defined as top 100 stocks on market capitalization, mid-caps as 101-250 stocks, small-caps 251 stock onwards
  • 5.
    5 Investment process –Portfolio construction Assessment of entry and exit ranges in whitelisted stocks Underweight / Overweight each sector driven by relative attractiveness Select sub-sectors with favorable prospects within each sector and allocate to stocks in the sub-sector Diversified across styles and sectors to create a durable portfolio ~ 65 – 75% Stocks with strong business fundamentals and growth prospects FINAL PORTFOLIO ~ 60 – 65 names ~ 25 - 35% Potential for valuation re-rating from business turnarounds; deep value names Source: Internal
  • 6.
    6 Investment process –Risk management and Sell discipline Continuous assessment of stock performance v/s fundamental changes Stock hits its target price although growth prospects are favorable Trade around the position with periodic profit booking Adverse changes in assessment of company’s business prospects Exit the company and assess alternative candidates Hitting price targets along with assessment of peaking in valuations / industry cycle Exit the company and assess alternative candidates Constant monitoring of price targets and prospects for hold / sell decisions
  • 7.
    7 Investment team Rohit Singhania– managing the fund since July 2015 • Rohit is the Fund Manager for DSP Tax Saver Fund. He is also the co-Fund Manager for DSP India T.I.G.E.R fund* (The Infrastructure Growth and Economic Reforms), DSP Equity Opportunities Fund* and DSP Natural Resources and New Energy Fund*. • Rohit joined DSP Investment Managers in September 2005, as Portfolio Analyst for the firm's Portfolio Management Services (PMS) division and then transferred to the Institutional Equities Team in June 2009. He focused on sectors like Auto, Auto Ancillaries, Metals, Infrastructure, Sugar and Hotels. • Previously, he was with HDFC Securities Ltd. as a Sr. Equity Analyst on the Institutional Equity Research Desk. Chinmay Sapre (9) AVP, Aviation, Realty Abhishek Ghosh (12) AVP, Small & Mid Caps, Transportation Kaushal Maroo (11) AVP, Autos, Ancillaries, Cement Charanjit Singh (12) AVP, Capital Goods, Infra, Power Utilities, Consumer Durables Dhaval Gada (10) AVP, Banking and Financial Services Apoorv Jain, CFA (4) Manager, Investment Analyst Abhishek Rathi (13) AVP, Financials & Industrials for Long / Short Aayush Ganeriwala MT, Oil & Gas, Metals TEAM SUPPORTING THE FUND MANAGER Experienced investment team with a wide coverage of Indian equity markets FUND MANAGER Years in brackets ( ) is years of experience. * Jay Kothari - Dedicated Fund Manager for overseas investments Aditya Khemka (13) AVP, Healthcare, Retail Suryanarayanan Manian, CFA (10) VP, Tech, Telecom, Media, FMCG Resham Jain, CFA (14) AVP, Small & Mid Caps, Agri inputs, Textiles, Chemicals
  • 8.
    8 Performance Scorecard Source: MFIE;Returns are as on March 31, 2020 for DSP Tax Saver Fund, Growth Option Regular Plan. Rolling Frequency is Daily. Standard Deviation of DSP Tax Saver Fund and Nifty 500 TRI is calculated on the basis of daily returns. Click here for performance in SEBI prescribed format and of other schemes managed by Fund Manager. Past performance may or may not sustain in future and should not be used as a basis for comparison with other investments. The figure mentioned for performance of the index should not construe as returns/performance of the Scheme. It is not possible to invest directly in an index. ROLLING RETURNS (%) DSP Tax Saver Fund aims to provide better risk adjusted returns profile across periods POINT-TO-POINT RETURNS (%) DSP TAX SAVER FUND Nifty 500 TRI DSP TAX SAVER FUND Nifty 500 TRI DSP TAX SAVER FUND Nifty 500 TRI Average Annual Returns 15.6 12.2 14.8 11.5 14.9 11.2 Median Annual Returns 12.1 9.4 13.9 12.0 15.7 11.5 Minimum Annual Returns -59.1 -59.5 -6.0 -6.3 -0.5 -1.4 Maximum Annual Returns 120.7 118.6 32.1 30.5 24.6 22.1 Returns / Risk 0.79 0.55 0.75 0.52 0.75 0.51 1 YEAR ROLLING RETURNS 3 YEARS ROLLING RETURNS 5 YEARS ROLLING RETURNS TIME PERIOD DSP TAX SAVER FUND Nifty 500 TRI ALPHA 1 year -23.8 -26.6 2.8 3 years -3.5 -3.1 -0.3 5 years 2.7 1.3 1.4 Since Inception 10.4 6.8 3.5
  • 9.
    9 Performance Scorecard Source: MFIE;Returns are as on March 31, 2020 for DSP Tax Saver Fund, Growth Option Regular Plan. Rolling Frequency is Daily. Standard Deviation of DSP Tax Saver Fund and Nifty 500 TRI is calculated on the basis of daily returns. Click here for performance in SEBI prescribed format and of other schemes managed by Fund Manager. Past performance may or may not sustain in future and should not be used as a basis for comparison with other investments. The figure mentioned for performance of the index should not construe as returns/performance of the Scheme. It is not possible to invest directly in an index. AVERAGE ROLLING RETURNS (%) RETURN PER UNIT OF RISK 15.6 14.8 14.9 12.2 11.5 11.2 0.0 2.0 4.0 6.0 8.0 10.0 12.0 14.0 16.0 18.0 1 yr RR 3 yr RR 5 yr RR DSP TAX SAVER FUND Nifty 500 TRI 0.79 0.75 0.75 0.55 0.52 0.51 0.00 0.10 0.20 0.30 0.40 0.50 0.60 0.70 0.80 0.90 1 yr RR 3 yr RR 5 yr RR DSP TAX SAVER FUND Nifty 500 TRI
  • 10.
    10 Portfolio details –sector exposures Significant exposure in Financial Services, Consumer & Energy sector during Rohit’s tenure Source: Morningstar Portfolio data as on March 31, 2020. The sector(s)/stock(s)/issuer(s) mentioned in this note do not constitute any recommendation of the same and the Fund may or may not have any future position in these sector(s)/stock(s)/issuer | More than 10% allocation highlighted in Orange and more than 5% allocation highlighted in grey Jun-15 Dec-15 Jun-16 Dec-16 Jun-17 Dec-17 Jun-18 Dec-18 Jun-19 Dec-19 Mar-20 Energy 9.2% 12.6% 9.0% 6.3% 6.4% 6.4% 5.8% 4.8% 4.5% 11.1% 8.9% Materials 10.9% 10.7% 11.4% 16.9% 14.2% 14.3% 11.9% 10.4% 10.5% 8.5% 10.4% Industrials 12.5% 11.2% 12.9% 12.1% 12.7% 11.4% 10.1% 9.3% 9.2% 6.5% 4.1% Consumer Discretionary 11.2% 14.2% 11.1% 11.2% 9.7% 11.0% 12.5% 4.4% 5.4% 7.7% 7.6% Consumer Staples 4.8% 1.8% 3.8% 4.1% 6.7% 5.1% 4.0% 5.6% 6.3% 3.1% 5.5% Healthcare 6.4% 9.7% 8.4% 7.9% 2.7% 5.3% 6.4% 7.0% 7.3% 5.5% 8.1% Financials 27.8% 26.0% 27.7% 24.0% 32.3% 32.7% 37.0% 37.9% 41.4% 33.2% 30.6% Information Technology 10.9% 9.7% 7.3% 10.0% 2.5% 2.2% 6.8% 10.8% 8.0% 8.5% 5.2% Communication Services 0.5% 2.3% 1.0% 6.1% 7.3% Utilities 1.4% 2.9% 3.5% 3.1% 5.1% 6.3% 3.1% 2.4% 3.6% 4.2% 3.5% Real Estate 0.7% 0.6% 1.5% 0.8% Total Equity 95.5% 98.8% 95.1% 95.7% 94.7% 95.7% 97.5% 93.3% 96.9% 95.9% 92.0%
  • 11.
    0% 10% 20% 30% 40% 50% 60% 70% 80% 90% 100% Jun-15 Sep-15 Dec-15 Mar-16 Jun-16 Sep-16 Dec-16 Mar-17 Jun-17 Sep-17 Dec-17 Mar-18 Jun-18 Sep-18 Dec-18 Mar-19 Jun-19 Sep-19 Dec-19 Mar-20 MARKET CAP BREAKUP Large Cap Mid Cap Small Cap 11 Portfolio details – concentration and market cap trends Source: MFIE; Portfolio data as on March 31, 2020. The sector(s)/stock(s)/issuer(s) mentioned in this note do not constitute any recommendation of the same and the Fund may or may not have any future position in these sector(s)/stock(s)/issuer. Large-caps are defined as top 100 stocks on market capitalization, mid-caps as 101-250 stocks, small-caps 251 stock onwards 70% Currently has a large cap bias. Manager preference for stocks with high liquidity 9% STOCK CONCENTRATIONSECTOR CONCENTRATION 13% 34% 50% 54 40 45 50 55 60 65 70 75 10% 15% 20% 25% 30% 35% 40% 45% 50% 55% Jun-15 Sep-15 Dec-15 Mar-16 Jun-16 Sep-16 Dec-16 Mar-17 Jun-17 Sep-17 Dec-17 Mar-18 Jun-18 Sep-18 Dec-18 Mar-19 Jun-19 Sep-19 Dec-19 Mar-20 Top 5 stocks (LHS) Top 10 stocks (LHS) Total No of stocks 31% 50% 66% 0% 10% 20% 30% 40% 50% 60% 70% 80% 90% Jun-15 Sep-15 Dec-15 Mar-16 Jun-16 Sep-16 Dec-16 Mar-17 Jun-17 Sep-17 Dec-17 Mar-18 Jun-18 Sep-18 Dec-18 Mar-19 Jun-19 Sep-19 Dec-19 Mar-20 Top Sector Top 3 Sector Top 5 Sector
  • 12.
    12 Portfolio Snapshot ason March 31st 2020 Source: DSP Internal; Portfolio data as on March 31, 2020. The sector(s)/stock(s)/issuer(s) mentioned in this note do not constitute any recommendation of the same and the Fund may or may not have any future position in these sector(s)/stock(s)/issuer. 2% 11%11% 8% 14% 74% TOP 10 STOCKS TOP 5 SECTORS ASSET ALLOCATION NAME OF INSTRUMENT RATING/INDUSTRY % OF NET ASSETS ICICI Bank Ltd. Banks 8.6% HDFC Bank Ltd. Banks 8.0% Bharti Airtel Ltd. Telecom - Services 7.3% Axis Bank Ltd. Banks 5.2% Reliance Industries Ltd. Petroleum Products 5.1% Kotak Mahindra Bank Ltd. Banks 3.9% Infosys Ltd. Software 3.7% Ultratech Cement Ltd. Cement 3.1% NTPC Ltd. Power 2.4% IPCA Laboratories Ltd. Pharmaceuticals 2.4% 7.6% 8.1% 8.9% 10.4% 30.6% 0.0% 5.0% 10.0% 15.0% 20.0% 25.0% 30.0% 35.0% Consumer Discretionary Healthcare Energy Materials Financials 92.0% 8.0% Equities Cash & Cash Equivalent
  • 13.
    13 Disclaimer & ProductLabeling Details In this material DSP Investment Managers Pvt. Ltd. (the AMC) has used information that is publicly available, including information developed in-house. Information gathered and used in this material is believed to be from reliable sources. The AMC however does not warrant the accuracy, reasonableness and / or completeness of any information. The data/statistics are given to explain general market trends in the securities market, it should not be construed as any research report/research recommendation. We have included statements / opinions / recommendations in this document, which contain words, or phrases such as “will”, “expect”, “should”, “believe” and similar expressions or variations of such expressions that are “forward looking statements”. Actual results may differ materially from those suggested by the forward looking statements due to risk or uncertainties associated with our expectations with respect to, but not to, exposure to market risks, general economic and political conditions in India and other countries globally, which have an impact on our services and / or investments, the monetary and interest policies of India, inflation, deflation, unanticipated turbulence in interest rates, foreign exchange rates, equity prices or other rates or prices etc. The sector(s)/stock(s)/issuer(s) mentioned in this presentation do not constitute any research report/recommendation of the same and may or may not have any future position in these sector(s)/stock(s)/issuer(s). The portfolio of the scheme is subject to changes within the provisions of the Scheme Information document of the scheme. Please refer to the SID for investment pattern, strategy and risk factors. Past performance may or may not sustain in future and should not be used as a basis for comparison with other investments. For Schemes Performance in SEBI prescribed format refer annexure as attached with this presentation. All figures and other data given in this document are as on March 31st, 2020 (unless otherwise specified) and the same may or may not be relevant in future and the same should not be considered as solicitation/ recommendation/guarantee of future investments by the AMC or its affiliates. Investors are advised to consult their own legal, tax and financial advisors to determine possible tax, legal and other financial implication or consequence of subscribing to the units of DSP Mutual Fund. For scheme specific risk factors and more details, please read the Scheme Information Document, Statement of Additional Information and Key Information Memorandum of respective Scheme available on ISC of AMC and also available on www.dspim.com. For Index disclaimer click here The distribution of this material in certain jurisdictions may be restricted or subject to registration requirements and, accordingly, persons who come into possession of this material in such jurisdictions are required to inform themselves about, and to observe, any such restrictions The strategy mentioned has been currently followed by the Scheme and the same may change in future depending on market conditions and other factors. Large-caps are defined as top 100 stocks on market capitalization, mid-caps as 101-250 , small-caps as 251 and above. Mutual Fund investments are subject to market risks, read all scheme related documents carefully. Scheme Product Suitability Riskometer DSP Tax Saver Fund (An open ended equity linked saving scheme with a statutory lock in of 3 years and tax benefit) The Open ended equity linked saving scheme is suitable for investors who are seeking* Long-term capital growth with a three-year lock-in Investment in equity and equity-related securities to form a diversified portfolio *Investors should consult their financial advisers if in doubt about whether the Scheme is suitable for them.