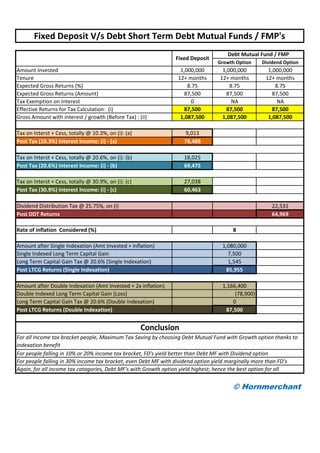
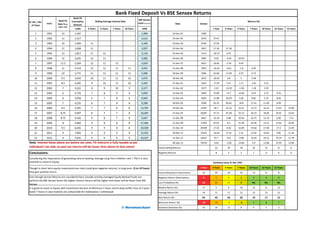
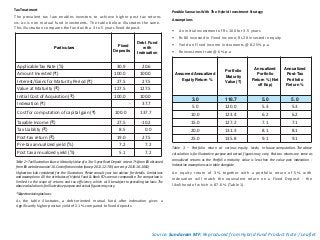
Value of the Allocation,
@ given rate of return
Value of the Allocation,
@ given rate of return
9% 0% -10% 15% 9% 0% -10% 15%
1 82 25 23 29 1 82 25 23 29
2 89 25 20 33 2 89 25 20 33
3 97 25 18 38 3 97 25 18 38
4 106 25 16 44 100
5 115 25 15 50 122
100 115
140 135
130
166
Value of the
Investment @ 9% rate
of return
Value of the
Investment @ 9% rate
of return
Amt
Allocated
Amt
Allocated
75 25 2575
Amt
Allocated
Value of the Investment, @ 9% Return /
interst, After Tax @ given tax slabsAmt
Invested
Total Amount Inveted ( = 75 Debt + 25 Equity)
Maturity Amount if Equity Returns are @ 0%
Maturity Amount if Equity Returns are @ -10%
Maturity Amount if Equity Returns are @ +15%
Year No.
Fixed Deposit
Capital Protection Fund / Debt Oriented Hybrid Fund (3 Year)
Year No.
Debt Equity
Value of Allocation @ given rate of returnsAmt
Allocated
Capital Protection Fund / Debt Oriented Hybrid Fund (5 Year)
Maturity Amount if Equity Returns are @ -10%
Maturity Amount if Equity Returns are @ +15%
Year No.
Maturity Amount if Equity Returns are @ 0%
Total Amount Inveted
Year No.
EquityDebt
Value of Allocation @ given rate of returns
Fixed Deposit
Value of the Investment, @ 9% Return /
interst, After Tax @ given tax slabsAmt
Invested (Before Tax) (Before Tax)
Interst Rate = 9% Tax = 10% Tax = 20% Tax = 30% Interst Rate = 9% Tax = 10% Tax = 20% Tax = 30%
1 109 108 107 106 1 109 108 107 106
2 119 117 115 113 2 119 117 115 113
3 130 126 123 120 3 130 126 123 120
4 141 137 132 128
5 154 148 142 136
©Hormerchat.com
100
Invested
> Capital protection Fund is beneficial only if the equity return are 15% or more
For People Falling in 10% Tax bracket or Non-Tax Payers
> Capital protection Fund is beneficial only if the equity return are 15% or more
> Capital Protection Fund gives at par or more than FD returns, if the returns from equity allocation
are are zero
> If the Equtiy Allocated investments give 15% positive returns Capital Prtection Fund will give
superior returns than a Fixed Deposit
> If Equity Allocation produces negative returns, then also, Capital Protection Fund is likely to give
positive returns though it undeperforms the FD retuns.
> Capital Protection is better in 2 of 3 possible situations, and worst likely possiblity is positive
returns but lesser than FD (say, slightly more than Savings Bank Account returns)
> Capital Protection Fund gives at par or more than FD returns, if the returns from equity allocation
are zero
> If the Equtiy Allocated investments give 15% positive returns Capital Prtection Fund will give
superior returns than a Fixed Deposit
> If Equity Allocation produces negative returns, then capital is presereved though underperform
the returns of the FD
> Capital Protection is better in 2 of 3 possible situations, and worst likely possiblity is postive
returns which may be little less than FD Returns
For People Falling in 10% Tax bracket or Non-Tax Payers
For People Falling in 20% & 30% Tax bracket,
Year No.
Conclusion
For People Falling in 20% & 30% Tax bracket,
Consclusion
Year No.
Invested
100
Objective
To generate current income and capital appreciation through a mix of
investments in equities and fixed income securities.
FundSuitability
• Investors who primarily want accrual income and also a limited exposure
to equities in order to benefit from any potential upward move in equity
markets
Reasonsto Invest
• Specially suitable for investing in volatile markets
• O ffers an attractive route to take limited equity allocation for conservative
investors
• Combines the relative stability of debt with the possibility of
higher return on equities thereby endeavouring to provide a
return higher than fixed deposits and debt funds
PortfolioStrategy
Fixed Income:Passive; in instruments rated AA & above
Equity: Active management; in diversified equity and equity related securities
of companies that have the potential to appreciate over the long term.
Therefore the fund would have the flexibility to invest in stocks from
sectors and industries of all market capitalization. The allocation to the
different market caps would vary from time to time depending on the
overall market conditions/opportunities and the fund manager’s view.
How doestheHybrid Strategywork?
• Predominantly investment is made in fixed income portfolio to
provide stability
• A smaller allocation to equities in order to be able to participate in any
upward movement in the equity markets with an aim to provide
capital appreciation
• The prevalent tax laws enables investors to achieve better post tax
returns vis-à-vis non mutual fund investments
Fixed IncomeAllocation
Based on the current market conditions, an allocation of 80% may be
made to this asset class. The prevalent yield (as on January 31, 2016) on the
fixed income instruments, mainly corporate bonds, with a 1300 days tenure is
around 8.25%. (Source: Internal).
Equity Allocation
The allocation to Equity may be around 20% of the total assets. While
it is not possible to predict the capital gains from the equity allocation, it
is a fact that equity markets in the past have delivered higher returns
than fixed income although accompanied by a higher degree of risk.
To help understand the linkage between degrees of risk and return in the
past, the table below analyses the data based on the CN X Nifty,
obtained over a ten-year period on a 1300 days rolling return basis. A
total of 1,598 observation points have been used.
Table 1: CNX Nifty 10-year observations; Source – Bloomberg; In- house computation. Index
values taken from January 31, 2006 to January 31, 2016.
The highlights of the above table are:
• CNX Nifty has delivered a negative return in only 7.5% of the
observations
• CNX Nifty has delivered greater than single digit return in 46% of
the observations
• CN X Nifty has delivered greater than 15% return in 17.4% of the
observations,
Thus, it is apparent that the equity markets do carry a risk of erosion of
capital, but also deliver the reward of high appreciation.
Annualized Return
# of
Occasions
% of
Occasions
Cumulative %
of
Occasions
20% to 25% p.a 39 2.4 2.4
15% to 20% p.a 201 12.6 15.0
10% to 15% p.a 495 31.0 46.0
5% to 10% p.a 426 26.0 72.7
0% to 5% p.a 318 19.9 92.6
<0% p.a 118 7.4 99.9
<-5% p.a 1 0.1 100
Source: Sundaram MF; Reproduced from Hybrid Fund Product Note / Leaflet
TaxTreatment
The prevalent tax law enables investors to achieve higher post tax returns
vis-à-vis non mutual fund investments. The table below illustrates the same.
This illustration compares the fund with a 3 to 5 years fixed deposit.
Table2 –Tax Illustration Source: Maturity Valueof a3 to 5-year Fixed Deposit rateat 7% from SBI obtained
from SBI websiteason Jan’16. Costinflation index (baseyr 2011-12:785;currentyr 2015-16:1081)
Highest tax slab considered for the illustration. Please consult your tax advisor for details. Limitations
and assumptions: All the attributes of Hybrid Fund & Bank FD’s are not comparable. The comparison is
limited to the scope of returns and tax efficiency which will besubject to prevailing tax laws. The
abovecalculation isfor illustrativepurpose and actual figuresmay vary.
*Subjecttoexistingtaxlaws
As the table illustrates, a debt-oriented mutual fund after indexation gives a
significantly higher posttax yield of 2.1% compared to fixed deposits.
Possible ScenariosWith The Hybrid Investment Strategy
Assumptions
• An initial investment of Rs 100 for 3.5 years
• Rs 80 invested in Fixed Income; Rs 20 invested in equity
• Yield on Fixed Income instruments @ 8.25% p.a
• Reinvestment rate @ 6% p.a
Table 3 – Portfolio return at various equity levels; In-house computation. The above
calculation is for illustrative purpose and actual figures may vary. Post tax returns are same as
annualized returns as the Portfolio maturity value is less than the value post indexation -
Indexation assumptionsasin table alongside
An equity return of 3% together with a portfolio return of 5% with
indexation will match the equivalent return on a Fixed Deposit - the
likelihood of which is 87.6% (Table 1).
Assumed Annualized
Equity Return %
Portfolio
Maturity
Value (₹)
Annualized
Portfolio
Return % (Net
off Exp)
Annualized
Post-Tax
Portfolio
Return %
3.0 118.7 5.0 5.0
5.0 120.0 5.3 5.3
10.0 123.4 6.2 6.2
15.0 127.2 7.1 7.1
20.0 131.3 8.1 8.1
25.0 135.8 9.1 9.1
Particulars
Fixed
Deposits
Debt Fund
with
Indexation
Applicable Tax Rate (%) 30.9 20.6
Amount Invested (₹) 100.0 100.0
Interest/Gains for Maturity Period (₹) 27.5 27.5
Value at Maturity (₹) 127.5 127.5
Initial Cost of Acquisition (₹) 100.0 100.0
Indexation (₹) - 37.7
Cost for computation of capital gain (₹) 100.0 137.7
Taxable Income (₹) 27.5 -10.2
Tax Liability (₹) 8.5 0.0
Post-tax return (₹) 19.0 27.5
Pre-tax annualized yield (%) 7.2 7.2
Post tax annualized yield (%) 5.1 7.2
Source: Sundaram MF; Reproduced from Hybrid Fund Product Note / Leaflet

Fixed Deposit vs Debt Oriented Hybrid Fund

  • 1.
    Value of theAllocation, @ given rate of return Value of the Allocation, @ given rate of return 9% 0% -10% 15% 9% 0% -10% 15% 1 82 25 23 29 1 82 25 23 29 2 89 25 20 33 2 89 25 20 33 3 97 25 18 38 3 97 25 18 38 4 106 25 16 44 100 5 115 25 15 50 122 100 115 140 135 130 166 Value of the Investment @ 9% rate of return Value of the Investment @ 9% rate of return Amt Allocated Amt Allocated 75 25 2575 Amt Allocated Value of the Investment, @ 9% Return / interst, After Tax @ given tax slabsAmt Invested Total Amount Inveted ( = 75 Debt + 25 Equity) Maturity Amount if Equity Returns are @ 0% Maturity Amount if Equity Returns are @ -10% Maturity Amount if Equity Returns are @ +15% Year No. Fixed Deposit Capital Protection Fund / Debt Oriented Hybrid Fund (3 Year) Year No. Debt Equity Value of Allocation @ given rate of returnsAmt Allocated Capital Protection Fund / Debt Oriented Hybrid Fund (5 Year) Maturity Amount if Equity Returns are @ -10% Maturity Amount if Equity Returns are @ +15% Year No. Maturity Amount if Equity Returns are @ 0% Total Amount Inveted Year No. EquityDebt Value of Allocation @ given rate of returns Fixed Deposit Value of the Investment, @ 9% Return / interst, After Tax @ given tax slabsAmt Invested (Before Tax) (Before Tax) Interst Rate = 9% Tax = 10% Tax = 20% Tax = 30% Interst Rate = 9% Tax = 10% Tax = 20% Tax = 30% 1 109 108 107 106 1 109 108 107 106 2 119 117 115 113 2 119 117 115 113 3 130 126 123 120 3 130 126 123 120 4 141 137 132 128 5 154 148 142 136 ©Hormerchat.com 100 Invested > Capital protection Fund is beneficial only if the equity return are 15% or more For People Falling in 10% Tax bracket or Non-Tax Payers > Capital protection Fund is beneficial only if the equity return are 15% or more > Capital Protection Fund gives at par or more than FD returns, if the returns from equity allocation are are zero > If the Equtiy Allocated investments give 15% positive returns Capital Prtection Fund will give superior returns than a Fixed Deposit > If Equity Allocation produces negative returns, then also, Capital Protection Fund is likely to give positive returns though it undeperforms the FD retuns. > Capital Protection is better in 2 of 3 possible situations, and worst likely possiblity is positive returns but lesser than FD (say, slightly more than Savings Bank Account returns) > Capital Protection Fund gives at par or more than FD returns, if the returns from equity allocation are zero > If the Equtiy Allocated investments give 15% positive returns Capital Prtection Fund will give superior returns than a Fixed Deposit > If Equity Allocation produces negative returns, then capital is presereved though underperform the returns of the FD > Capital Protection is better in 2 of 3 possible situations, and worst likely possiblity is postive returns which may be little less than FD Returns For People Falling in 10% Tax bracket or Non-Tax Payers For People Falling in 20% & 30% Tax bracket, Year No. Conclusion For People Falling in 20% & 30% Tax bracket, Consclusion Year No. Invested 100
  • 2.
    Objective To generate currentincome and capital appreciation through a mix of investments in equities and fixed income securities. FundSuitability • Investors who primarily want accrual income and also a limited exposure to equities in order to benefit from any potential upward move in equity markets Reasonsto Invest • Specially suitable for investing in volatile markets • O ffers an attractive route to take limited equity allocation for conservative investors • Combines the relative stability of debt with the possibility of higher return on equities thereby endeavouring to provide a return higher than fixed deposits and debt funds PortfolioStrategy Fixed Income:Passive; in instruments rated AA & above Equity: Active management; in diversified equity and equity related securities of companies that have the potential to appreciate over the long term. Therefore the fund would have the flexibility to invest in stocks from sectors and industries of all market capitalization. The allocation to the different market caps would vary from time to time depending on the overall market conditions/opportunities and the fund manager’s view. How doestheHybrid Strategywork? • Predominantly investment is made in fixed income portfolio to provide stability • A smaller allocation to equities in order to be able to participate in any upward movement in the equity markets with an aim to provide capital appreciation • The prevalent tax laws enables investors to achieve better post tax returns vis-à-vis non mutual fund investments Fixed IncomeAllocation Based on the current market conditions, an allocation of 80% may be made to this asset class. The prevalent yield (as on January 31, 2016) on the fixed income instruments, mainly corporate bonds, with a 1300 days tenure is around 8.25%. (Source: Internal). Equity Allocation The allocation to Equity may be around 20% of the total assets. While it is not possible to predict the capital gains from the equity allocation, it is a fact that equity markets in the past have delivered higher returns than fixed income although accompanied by a higher degree of risk. To help understand the linkage between degrees of risk and return in the past, the table below analyses the data based on the CN X Nifty, obtained over a ten-year period on a 1300 days rolling return basis. A total of 1,598 observation points have been used. Table 1: CNX Nifty 10-year observations; Source – Bloomberg; In- house computation. Index values taken from January 31, 2006 to January 31, 2016. The highlights of the above table are: • CNX Nifty has delivered a negative return in only 7.5% of the observations • CNX Nifty has delivered greater than single digit return in 46% of the observations • CN X Nifty has delivered greater than 15% return in 17.4% of the observations, Thus, it is apparent that the equity markets do carry a risk of erosion of capital, but also deliver the reward of high appreciation. Annualized Return # of Occasions % of Occasions Cumulative % of Occasions 20% to 25% p.a 39 2.4 2.4 15% to 20% p.a 201 12.6 15.0 10% to 15% p.a 495 31.0 46.0 5% to 10% p.a 426 26.0 72.7 0% to 5% p.a 318 19.9 92.6 <0% p.a 118 7.4 99.9 <-5% p.a 1 0.1 100 Source: Sundaram MF; Reproduced from Hybrid Fund Product Note / Leaflet
  • 3.
    TaxTreatment The prevalent taxlaw enables investors to achieve higher post tax returns vis-à-vis non mutual fund investments. The table below illustrates the same. This illustration compares the fund with a 3 to 5 years fixed deposit. Table2 –Tax Illustration Source: Maturity Valueof a3 to 5-year Fixed Deposit rateat 7% from SBI obtained from SBI websiteason Jan’16. Costinflation index (baseyr 2011-12:785;currentyr 2015-16:1081) Highest tax slab considered for the illustration. Please consult your tax advisor for details. Limitations and assumptions: All the attributes of Hybrid Fund & Bank FD’s are not comparable. The comparison is limited to the scope of returns and tax efficiency which will besubject to prevailing tax laws. The abovecalculation isfor illustrativepurpose and actual figuresmay vary. *Subjecttoexistingtaxlaws As the table illustrates, a debt-oriented mutual fund after indexation gives a significantly higher posttax yield of 2.1% compared to fixed deposits. Possible ScenariosWith The Hybrid Investment Strategy Assumptions • An initial investment of Rs 100 for 3.5 years • Rs 80 invested in Fixed Income; Rs 20 invested in equity • Yield on Fixed Income instruments @ 8.25% p.a • Reinvestment rate @ 6% p.a Table 3 – Portfolio return at various equity levels; In-house computation. The above calculation is for illustrative purpose and actual figures may vary. Post tax returns are same as annualized returns as the Portfolio maturity value is less than the value post indexation - Indexation assumptionsasin table alongside An equity return of 3% together with a portfolio return of 5% with indexation will match the equivalent return on a Fixed Deposit - the likelihood of which is 87.6% (Table 1). Assumed Annualized Equity Return % Portfolio Maturity Value (₹) Annualized Portfolio Return % (Net off Exp) Annualized Post-Tax Portfolio Return % 3.0 118.7 5.0 5.0 5.0 120.0 5.3 5.3 10.0 123.4 6.2 6.2 15.0 127.2 7.1 7.1 20.0 131.3 8.1 8.1 25.0 135.8 9.1 9.1 Particulars Fixed Deposits Debt Fund with Indexation Applicable Tax Rate (%) 30.9 20.6 Amount Invested (₹) 100.0 100.0 Interest/Gains for Maturity Period (₹) 27.5 27.5 Value at Maturity (₹) 127.5 127.5 Initial Cost of Acquisition (₹) 100.0 100.0 Indexation (₹) - 37.7 Cost for computation of capital gain (₹) 100.0 137.7 Taxable Income (₹) 27.5 -10.2 Tax Liability (₹) 8.5 0.0 Post-tax return (₹) 19.0 27.5 Pre-tax annualized yield (%) 7.2 7.2 Post tax annualized yield (%) 5.1 7.2 Source: Sundaram MF; Reproduced from Hybrid Fund Product Note / Leaflet