Download as PDF, PPTX
![About us
● Juan Berner
○ @89berner
○ Hobbies = ['Movies/Series','Reading','Programming']
○ Mostly Blue Team
○ http://secureandscalable.wordpress.com/
● Hernán Costante
○ @hachedece
○ Security Monitoring & Incident Response fan
○ Open Source lover ♥](https://image.slidesharecdn.com/m7hym80qvinnwjjyn61a-signature-307bdad223ddaf7e09c1324593a7df2c9033282cf4797356d99c7abdb7ebfaa4-poli-141103184728-conversion-gate02/75/Security-Monitoring-for-big-Infrastructures-without-a-Million-Dollar-budget-2-2048.jpg)


![Logstash Filters
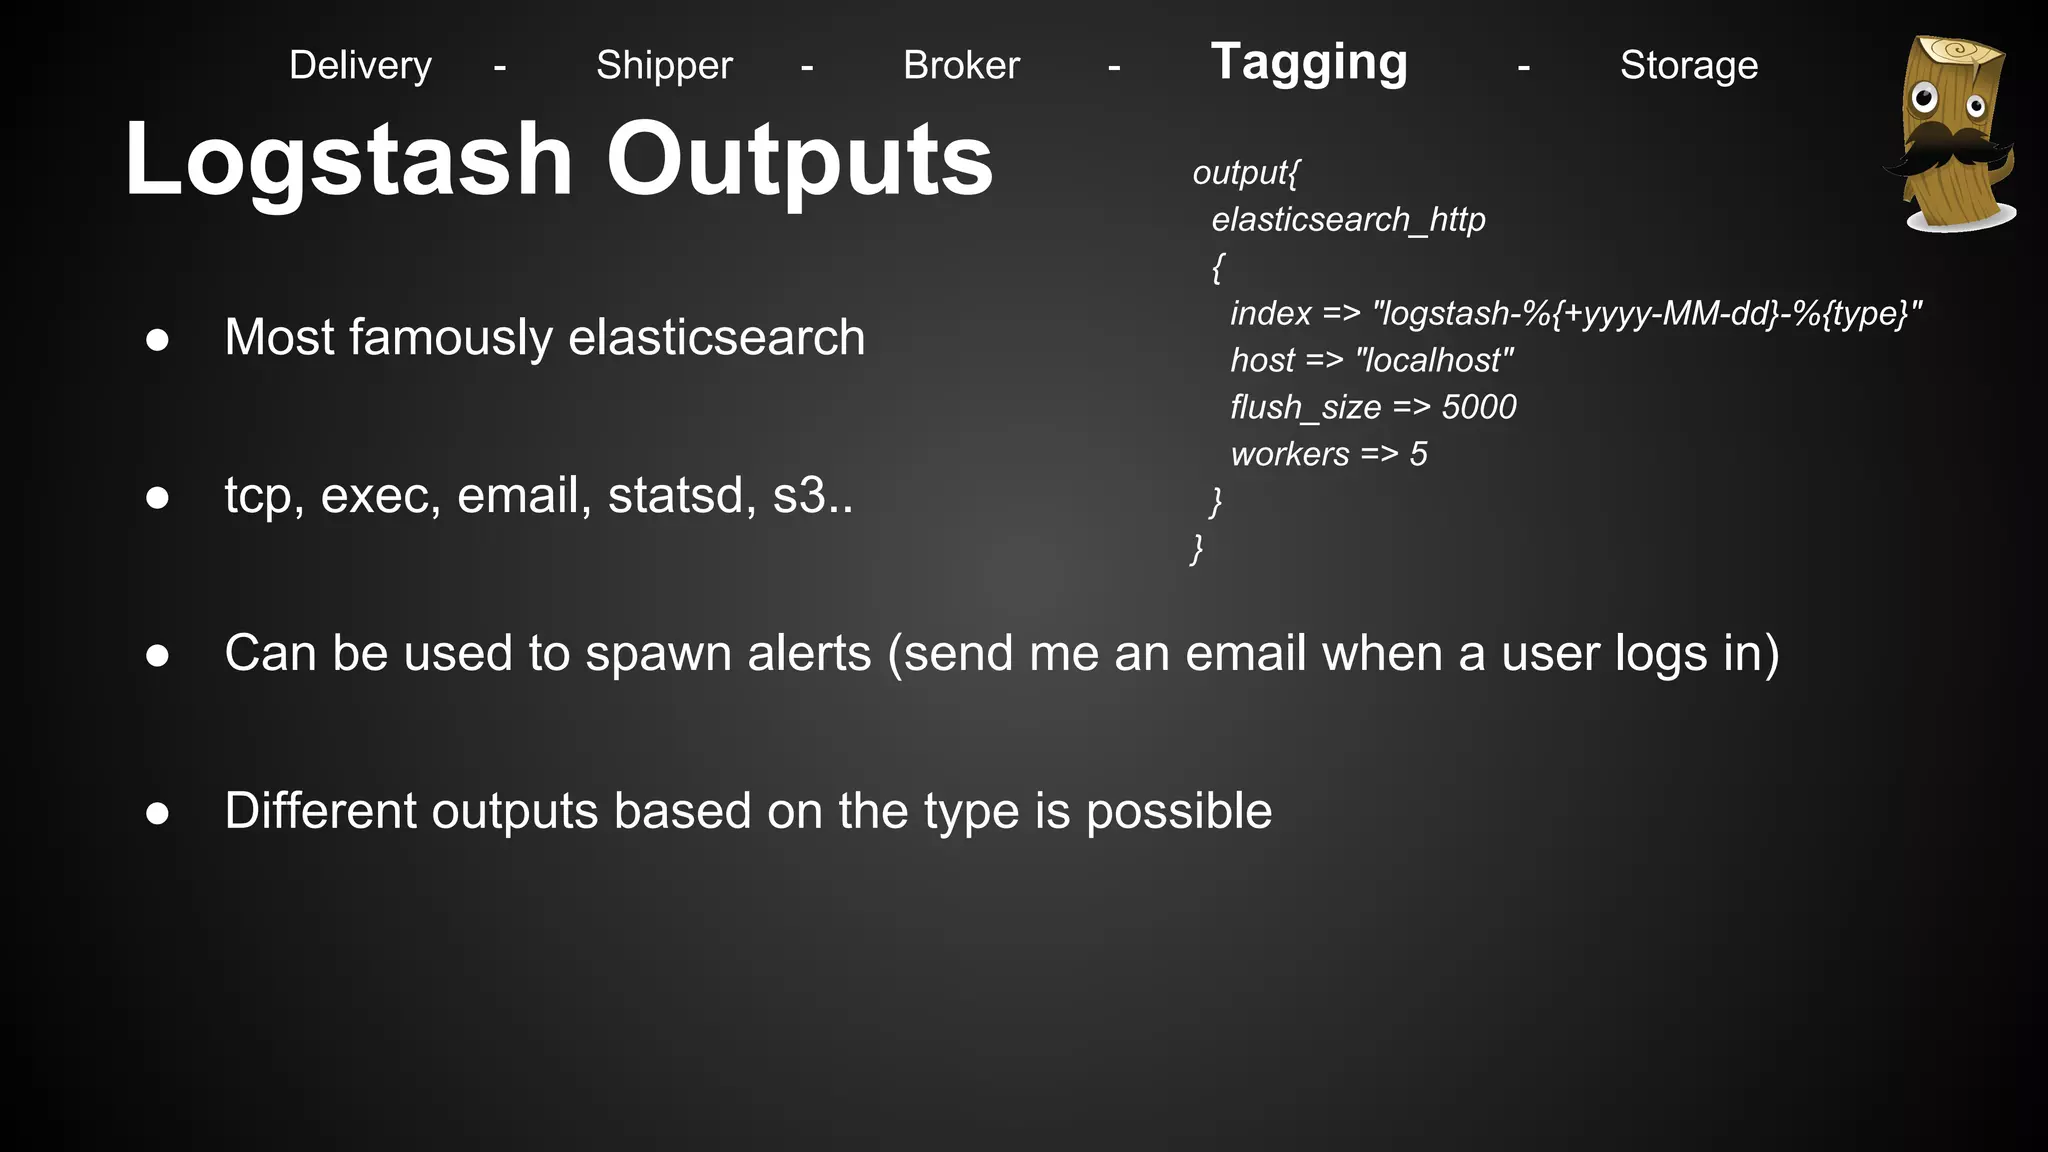
● They can help you parse, tag and modify
events on the fly
● GROK => Replacing regex with names
● You can build your own custom GROK
patterns
● Other useful filters such as Metrics,
Geoip, DNS, Anonymize, Date, etc..
filter {
grok {
pattern => "%
{SYSLOGTIMESTAMP:date}...%
{HOSTNAME:srcip},%{HOSTNAME:
dstip}...%{NUMBER:srcport},%{NUMBER:
dstport}..."
}
geoip {
source => "dstip"
target => "dst_geo"
fields => ["country_code2"]
}
dns {
resolve => [ "@dns"]
action => "replace"
}
}
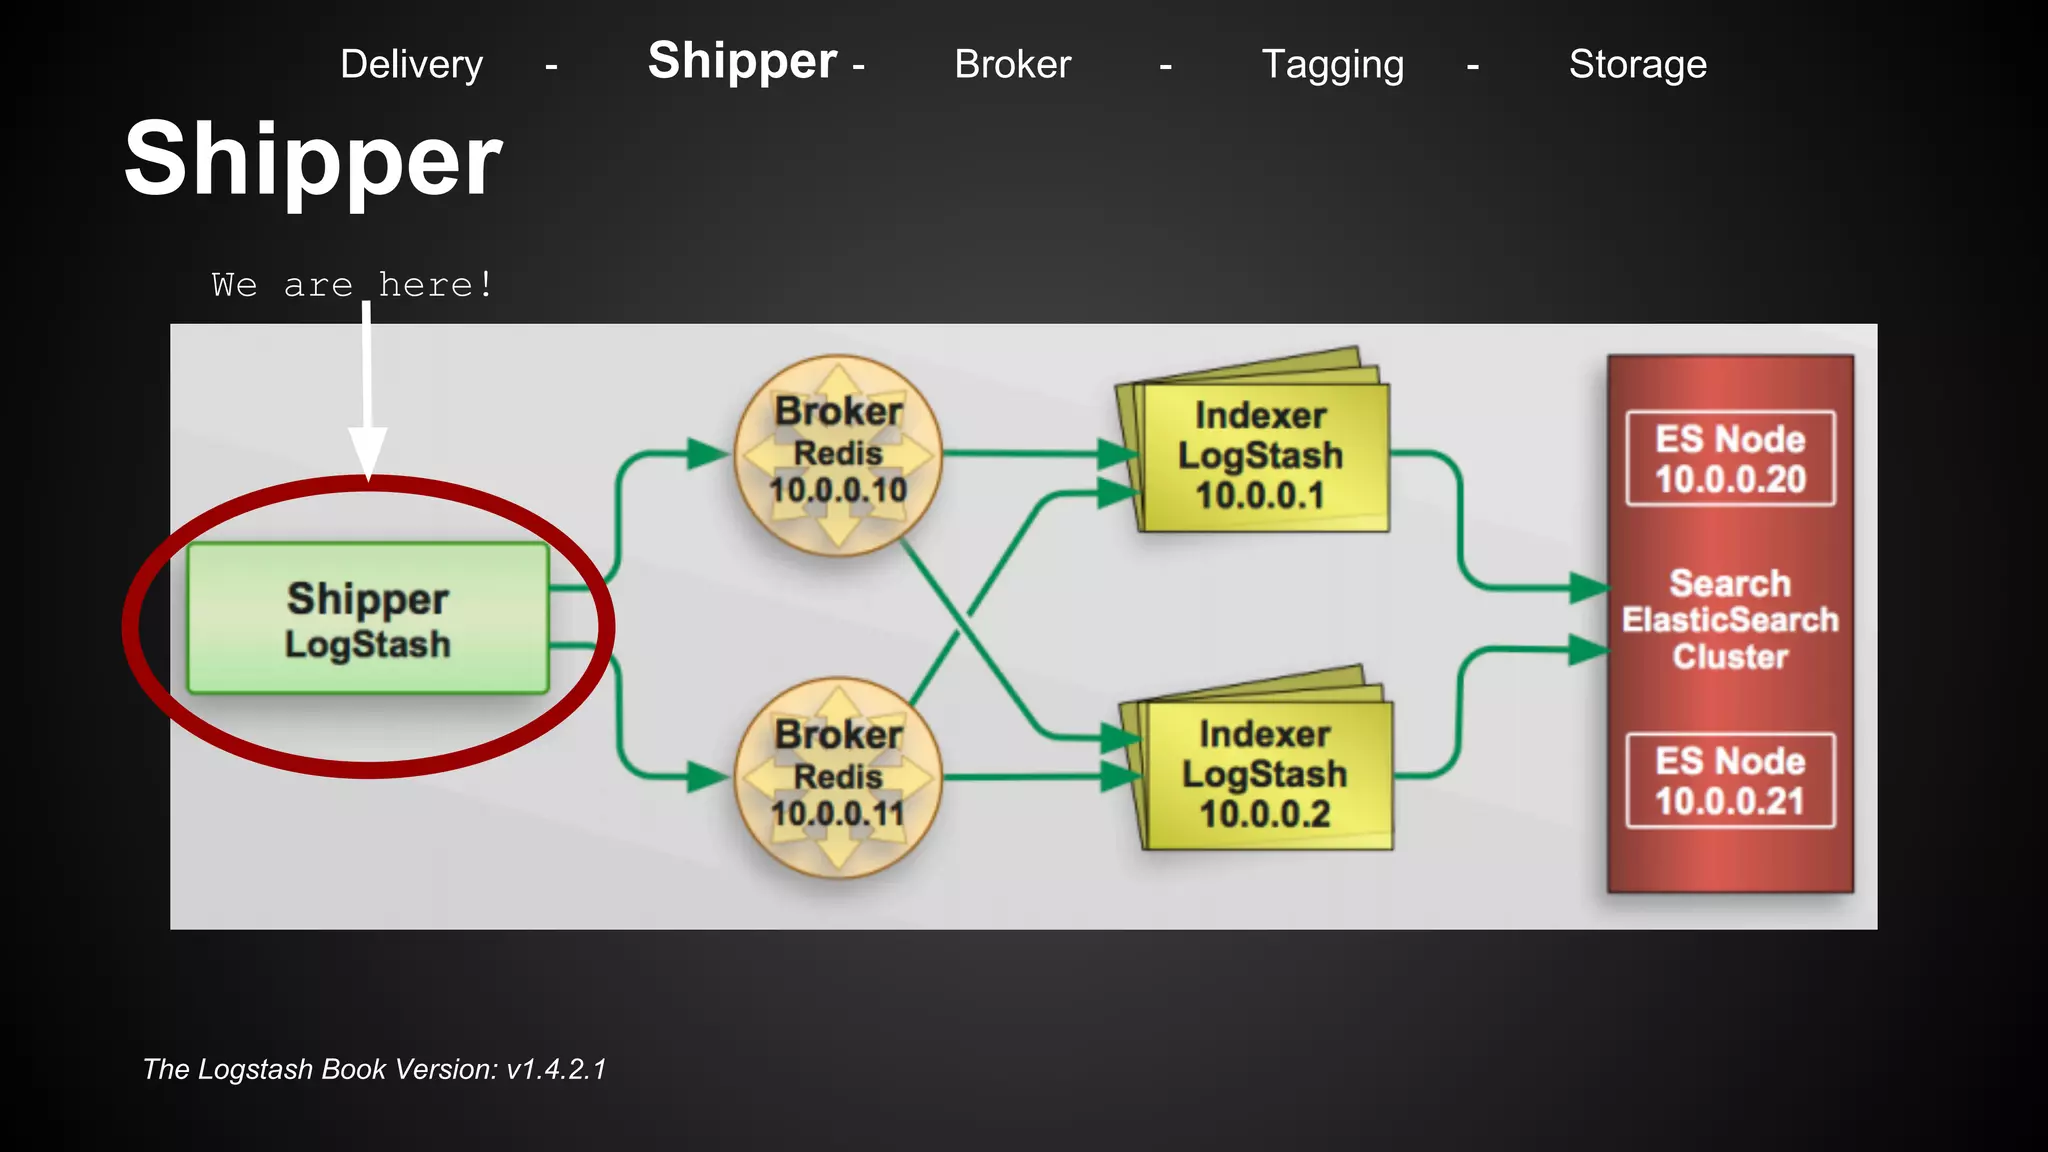
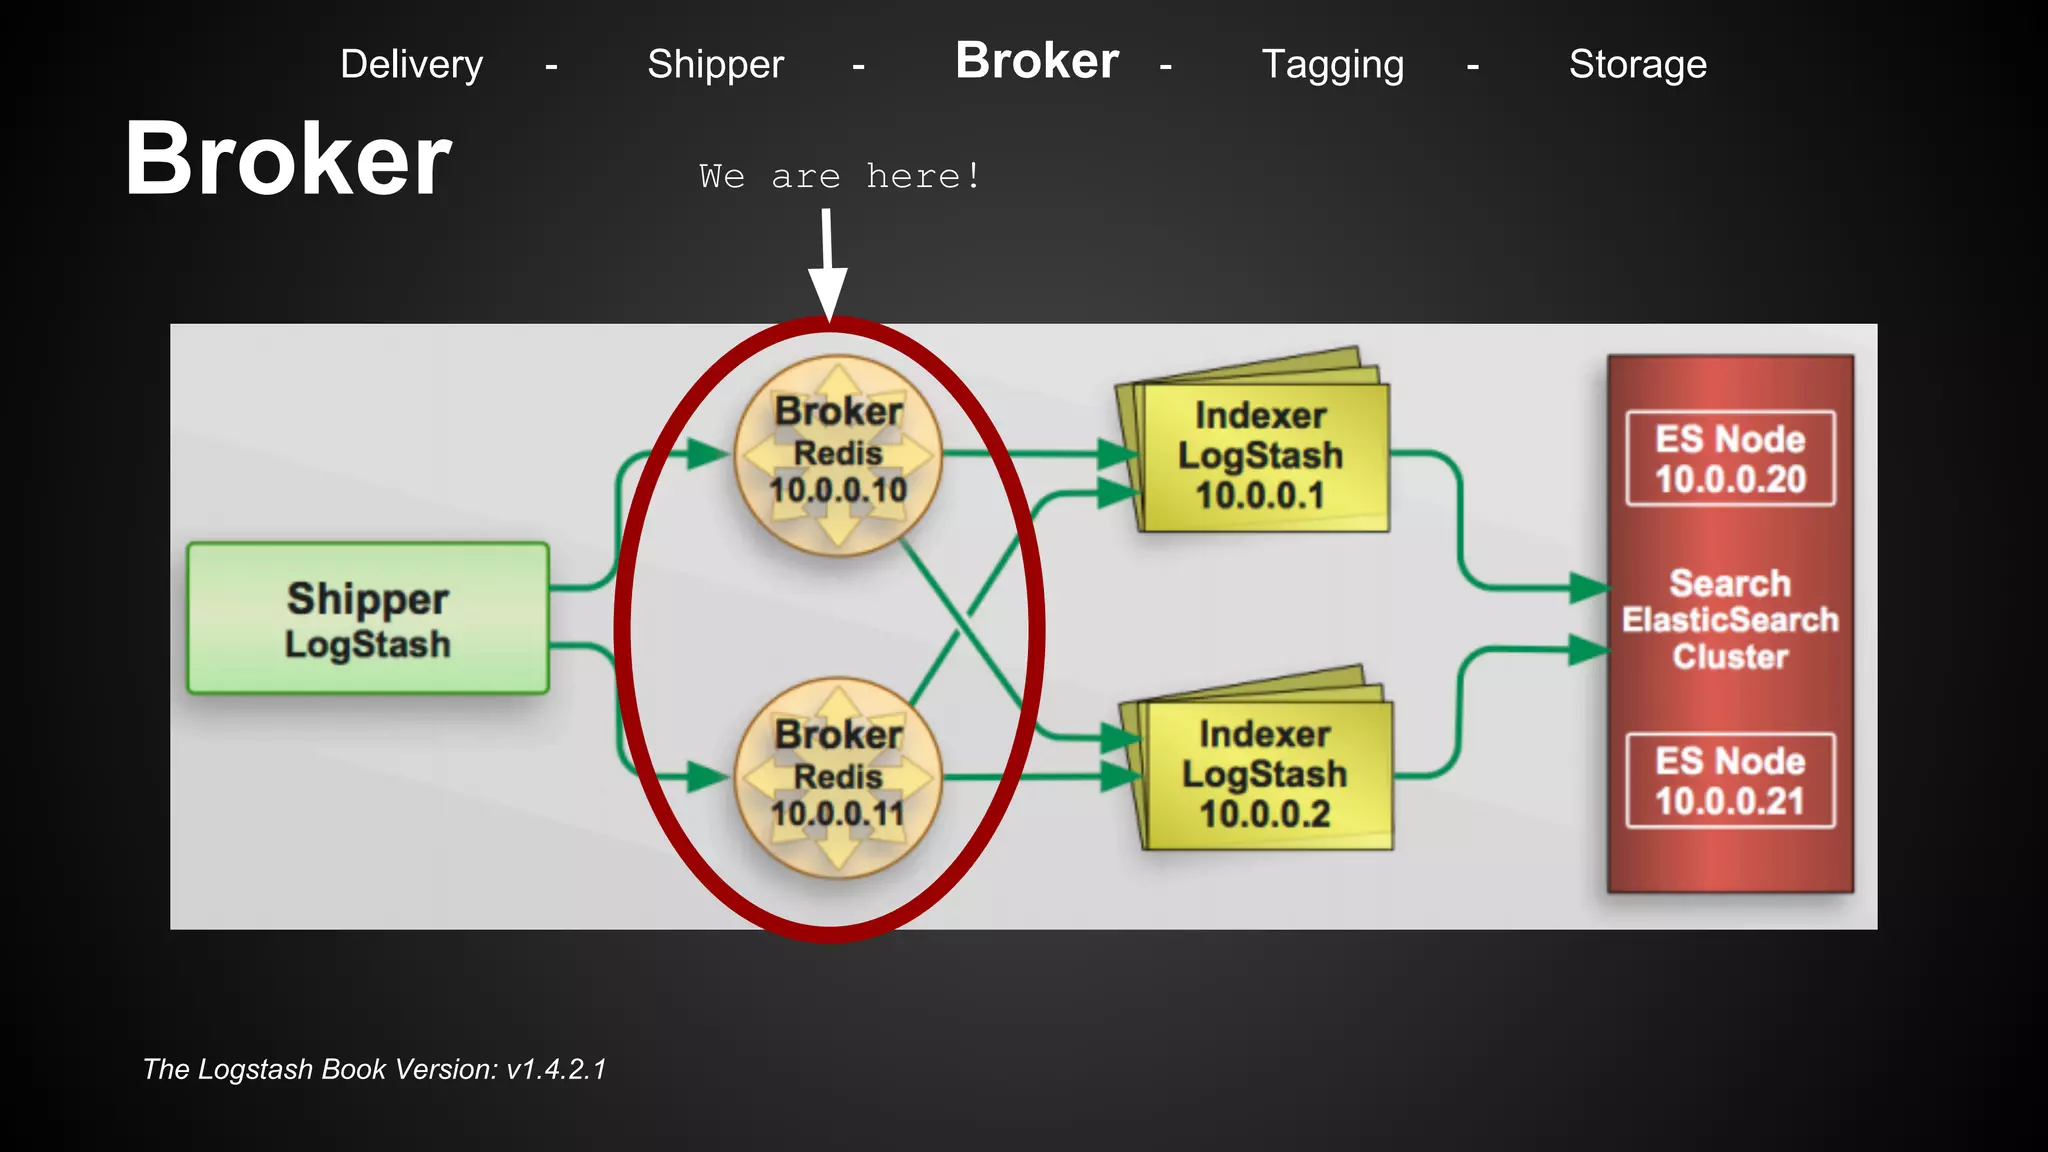
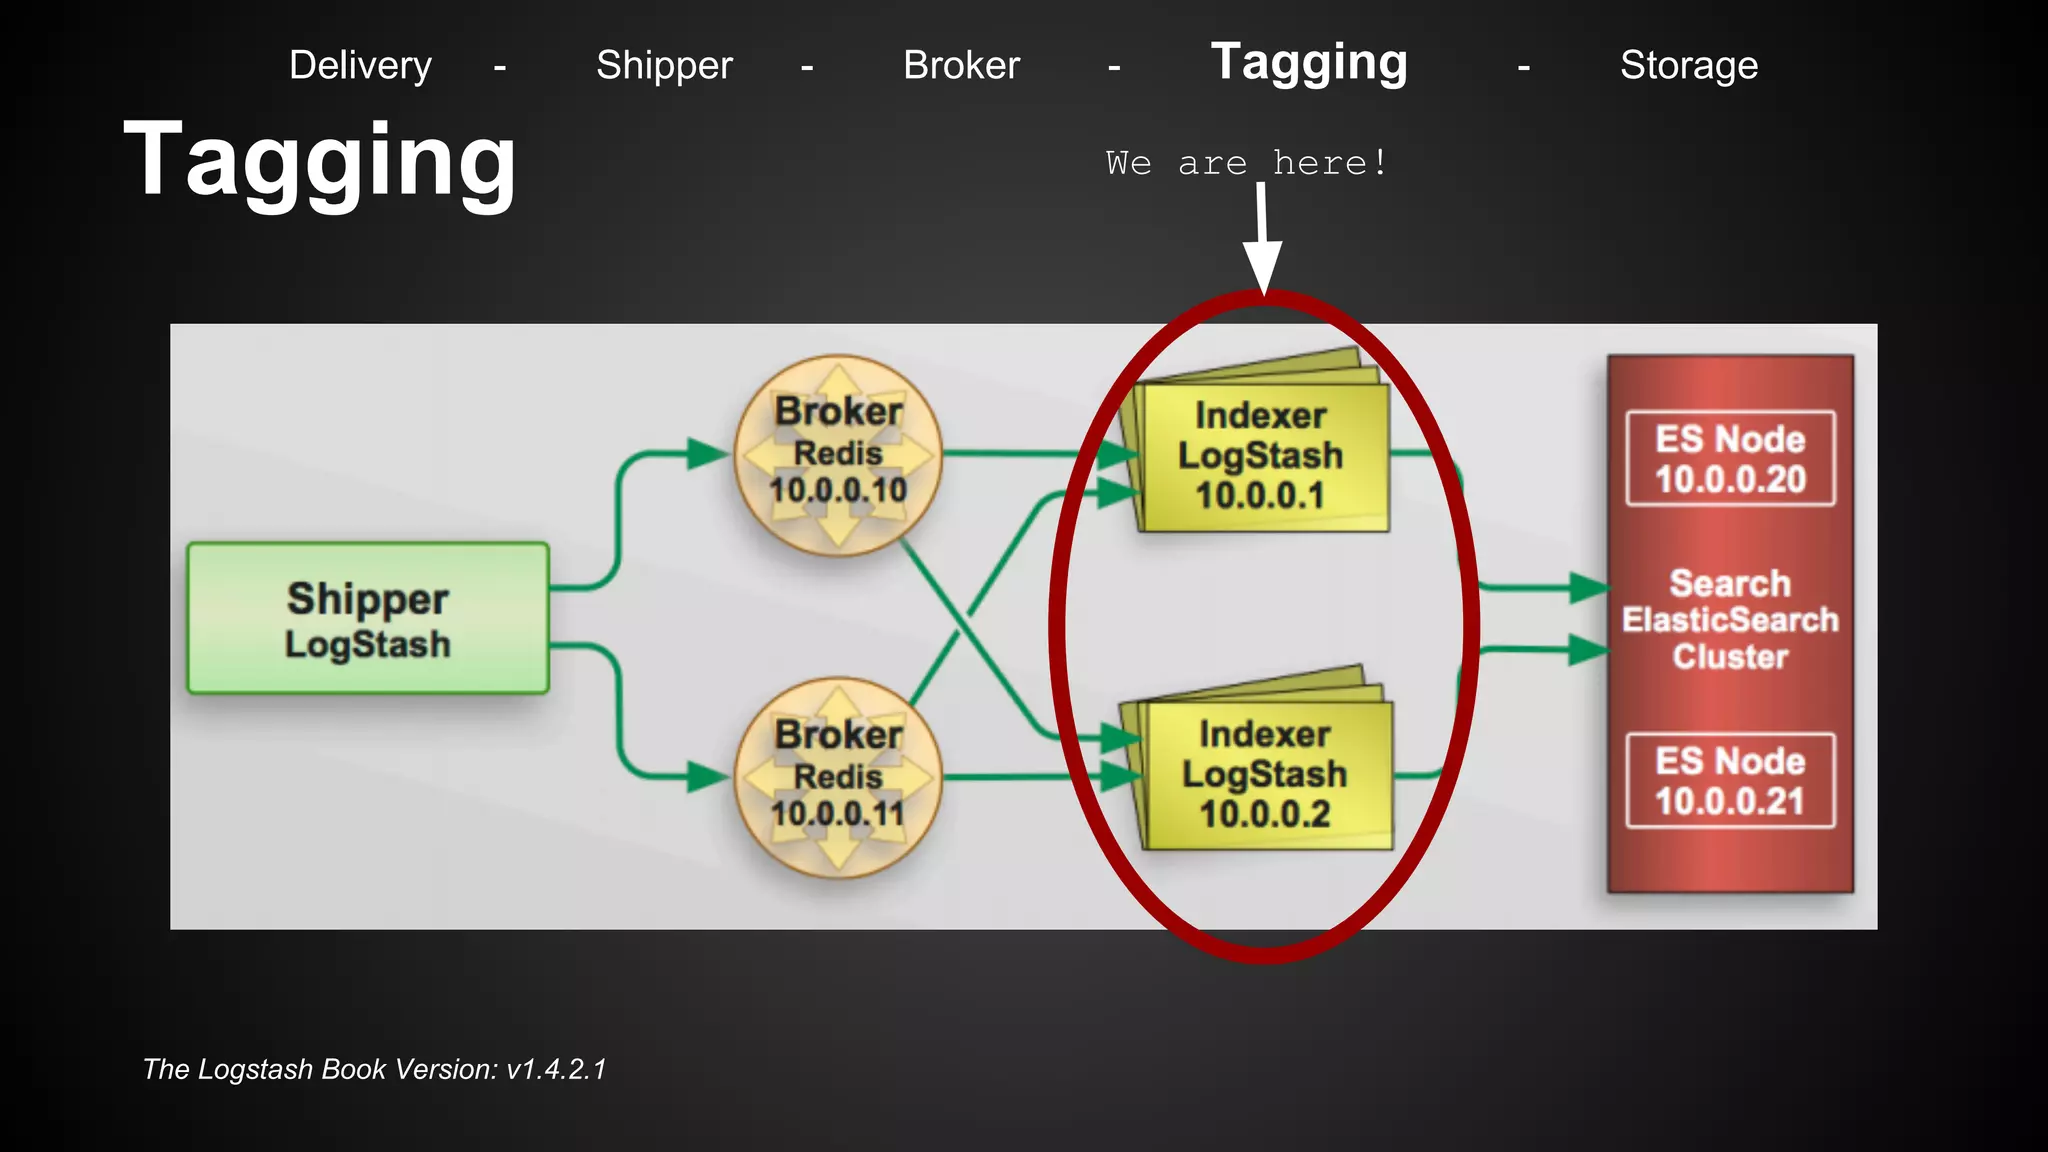
Delivery - Shipper - Broker - Tagging - Storage](https://image.slidesharecdn.com/m7hym80qvinnwjjyn61a-signature-307bdad223ddaf7e09c1324593a7df2c9033282cf4797356d99c7abdb7ebfaa4-poli-141103184728-conversion-gate02/75/Security-Monitoring-for-big-Infrastructures-without-a-Million-Dollar-budget-32-2048.jpg)
![The event in ElasticSearch{
"_index":"logstash-2014-10-23-sflow",
"_type":"sflow",
"_id":"JKWMv9J2T767IjxyasWjZw", …
"_source":{
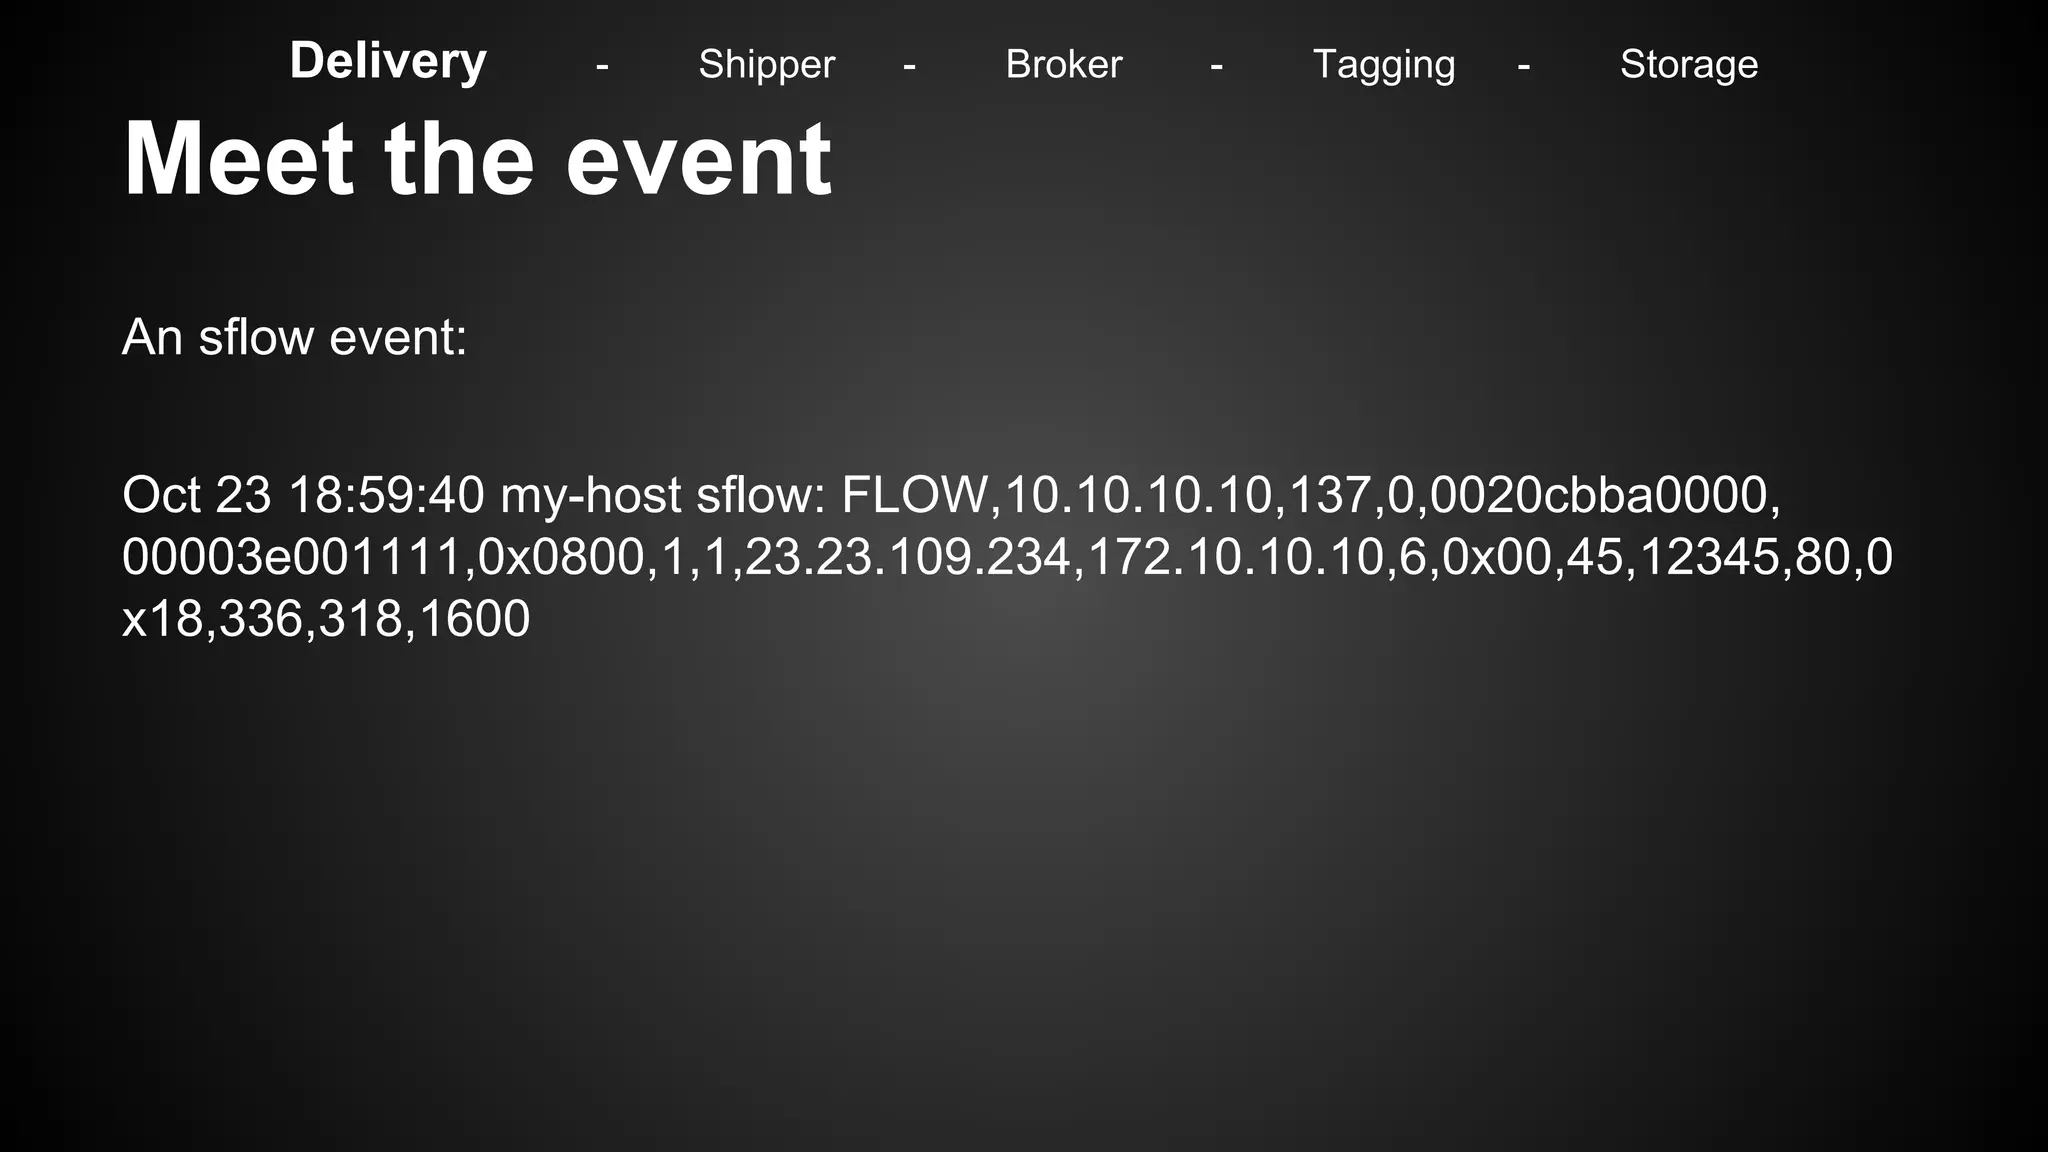
"message":"Oct 23 18:59:40 mihost sflow: FLOW,10.5.4.11,137,0,0020cbbbb000,00003eee1111,0x0800,1,1,10.10.10.100,10.10.10.10,6,0x00,45,80,14887,0x18,336,318,1600",
"@timestamp":"2014-10-23T18:59:40.000-04:00",
"@version":"1",
….
},
"sort":[
1414105180000
] }
Delivery - Shipper - Broker - Tagging - Storage](https://image.slidesharecdn.com/m7hym80qvinnwjjyn61a-signature-307bdad223ddaf7e09c1324593a7df2c9033282cf4797356d99c7abdb7ebfaa4-poli-141103184728-conversion-gate02/75/Security-Monitoring-for-big-Infrastructures-without-a-Million-Dollar-budget-38-2048.jpg)
![Example of an Alert (1)
● We look for connections to countries outside AR for this period of time
{ "query":{ "filtered":{ "query":{ "match_all":{ } }, "filter":{ "and":[ {
"bool":{ "must":{ } }, "should":{ },
"must_not":{
"regexp": { "country_code2":"AR" }
} } }, { "range":{
"@timestamp":{
"from":"2014-10-12T12:20:45-03:00",
"to":"2014-10-12T12:26:45-03:00" } } } ] } } } } }](https://image.slidesharecdn.com/m7hym80qvinnwjjyn61a-signature-307bdad223ddaf7e09c1324593a7df2c9033282cf4797356d99c7abdb7ebfaa4-poli-141103184728-conversion-gate02/75/Security-Monitoring-for-big-Infrastructures-without-a-Million-Dollar-budget-51-2048.jpg)
![Example of an Alert (2)
● Guess who we found:
{
"_index":"logstash-2014-10-23-sflow",
"_type":"sflow", "_id":"JKWMv9J2T767IjxyasWjZw", … "_source":{
….
"srcip":"172.10.10.10", "dstip":"23.23.80.130", "dns":"
ekoparty.org", ...
"dst_geo":{ "country_code2":"US" } },
"sort":[ 1414105180000 ] }](https://image.slidesharecdn.com/m7hym80qvinnwjjyn61a-signature-307bdad223ddaf7e09c1324593a7df2c9033282cf4797356d99c7abdb7ebfaa4-poli-141103184728-conversion-gate02/75/Security-Monitoring-for-big-Infrastructures-without-a-Million-Dollar-budget-52-2048.jpg)
![Example of an Alert (3)
● We check if this connection has happened in the last 3 months
{ "query":{ "filtered":{ "query":{ "match_all":{ } }, "filter":{ "and":[ {
"bool":{
"must":{ "srcip":"172.10.10.10”,"dstip":"23.23.80.130" }
}, "should":{ }, "must_not":{ } } }, {
"range":{
"@timestamp":{
"from":"2014-07-12T12:19:45-03:00",
"to":"2014-10-12T12:26:45-03:00" } } } ] } } } } }](https://image.slidesharecdn.com/m7hym80qvinnwjjyn61a-signature-307bdad223ddaf7e09c1324593a7df2c9033282cf4797356d99c7abdb7ebfaa4-poli-141103184728-conversion-gate02/75/Security-Monitoring-for-big-Infrastructures-without-a-Million-Dollar-budget-53-2048.jpg)
![Example of an Alert (4)
● Our result is:
[] => Nothing](https://image.slidesharecdn.com/m7hym80qvinnwjjyn61a-signature-307bdad223ddaf7e09c1324593a7df2c9033282cf4797356d99c7abdb7ebfaa4-poli-141103184728-conversion-gate02/75/Security-Monitoring-for-big-Infrastructures-without-a-Million-Dollar-budget-54-2048.jpg)
![Example of an Alert (5)
● We now check what users and commands happened in that timeframe in that
server for evidence to attach to the alert
{ "query":{ "filtered":{ "query":{ "match_all":{ } }, "filter":{ "and":[ {
"bool":{ "must":{ } }, "should":{ },
"must_not":{
"regexp": { “host”:”172.10.10.10” }
} } }, { "range":{
"@timestamp":{
"from":"2014-10-12T12:20:45-03:00",
"to":"2014-10-12T12:26:45-03:00" } } } ] } } } } }](https://image.slidesharecdn.com/m7hym80qvinnwjjyn61a-signature-307bdad223ddaf7e09c1324593a7df2c9033282cf4797356d99c7abdb7ebfaa4-poli-141103184728-conversion-gate02/75/Security-Monitoring-for-big-Infrastructures-without-a-Million-Dollar-budget-55-2048.jpg)

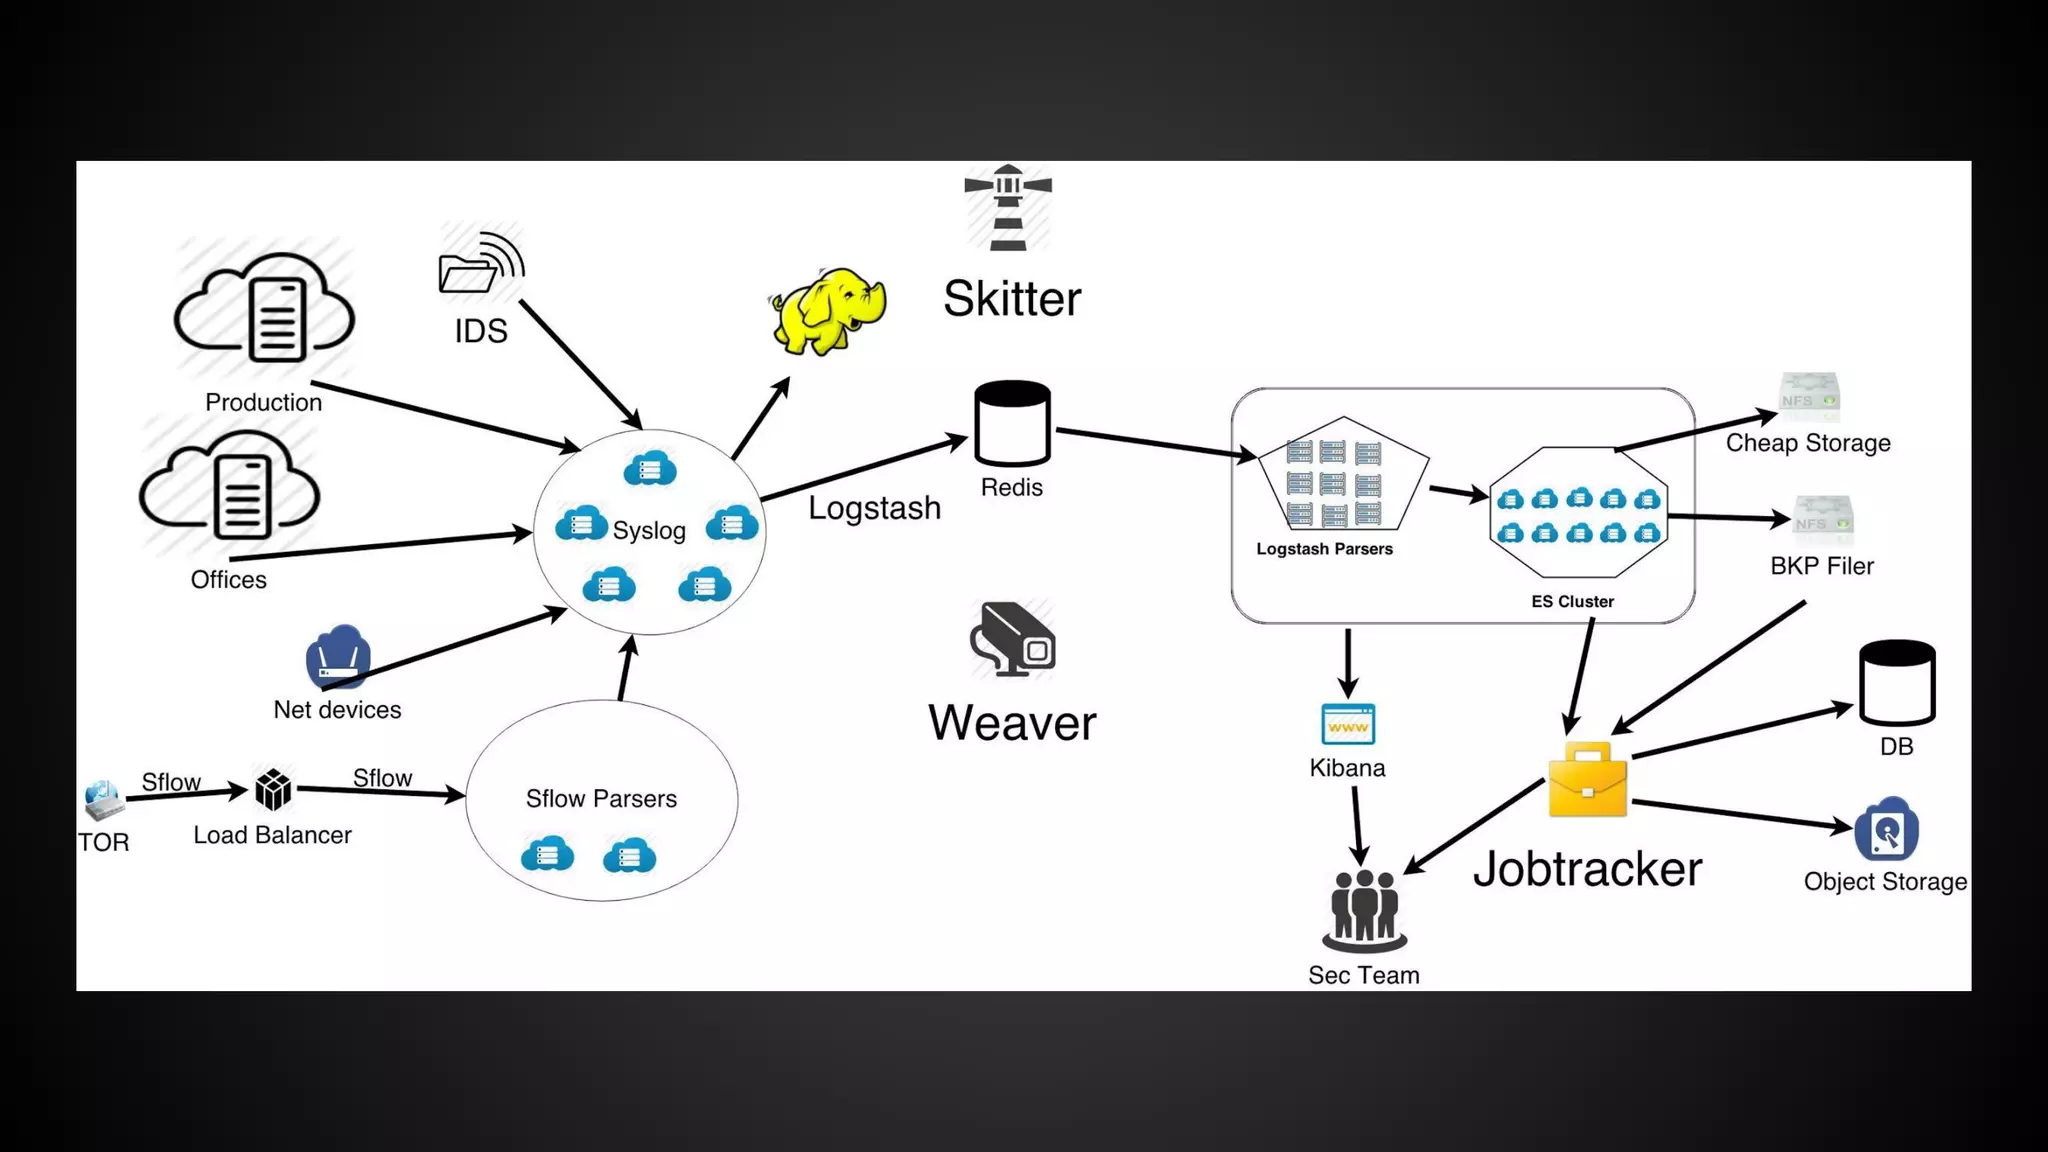


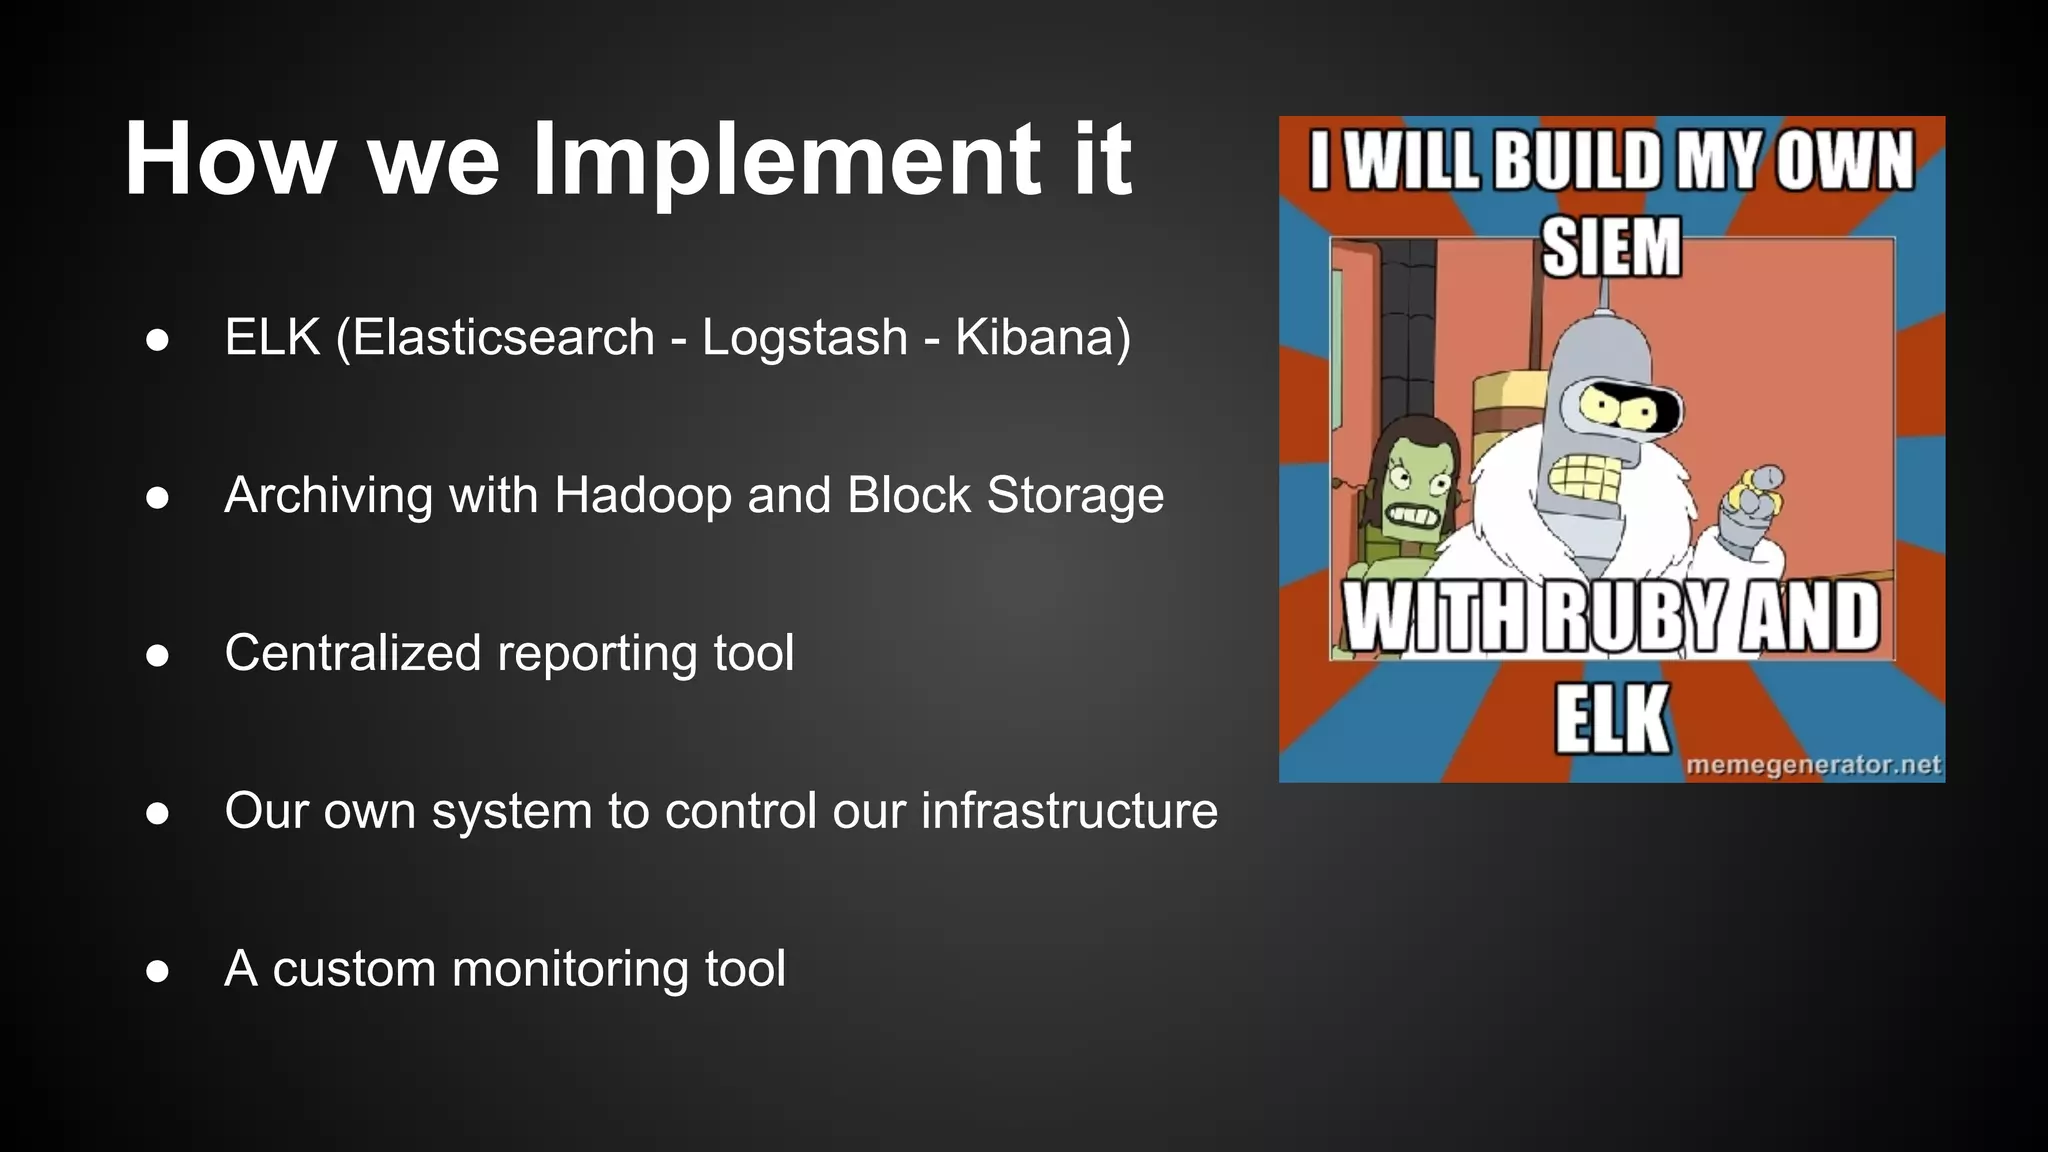
The document discusses effective security monitoring strategies for large infrastructures using open-source tools, specifically focusing on the ELK stack (Elasticsearch, Logstash, Kibana). It emphasizes the importance of comprehensive logging, incident response, and compliance in today’s security landscape, while also addressing the limitations of traditional monitoring systems. The presentation concludes with insights into implementing a scalable monitoring solution and potential future advancements in monitoring technologies.


![Coded Agents – with UiPath SDK + LangGraph [Virtual Hands-on Workshop]](https://cdn.slidesharecdn.com/ss_thumbnails/codedagentsdeck-251215155422-5497c599-thumbnail.jpg?width=640&height=640&fit=bounds)


