
Recommended
More Related Content
What's hot
What's hot (20)
Similar to SEC FDOTM Prices February 2019
Similar to SEC FDOTM Prices February 2019 (20)
Recently uploaded
Recently uploaded (20)
SEC FDOTM Prices February 2019
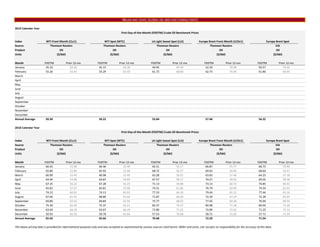
- 1. MILLER AND LENTS, GLOBAL OIL AND GAS CONSULTANTS 2019 Calendar Year First‐Day‐of‐the‐Month (FDOTM) Crude Oil Benchmark Prices Index WTI Front Month (CLc1) WTI Spot (WTC) LA Light Sweet Spot (LLS) Europe Brent Front Month (LCOc1) Europe Brent Spot Source Thomson Reuters Thomson Reuters Thomson Reuters Thomson Reuters EIA Product Oil Oil Oil Oil Oil Units ($/bbl) ($/bbl) ($/bbl) ($/bbl) ($/bbl) Month FDOTM Prior 12‐mo FDOTM Prior 12‐mo FDOTM Prior 12‐mo FDOTM Prior 12‐mo FDOTM Prior 12‐mo January 45.33 64.30 45.15 64.38 49.95 69.39 52.20 70.98 50.57 70.20 February 55.26 63.43 55.29 63.50 61.72 68.80 62.75 70.40 61.86 69.64 March April May June July August September October November December Annual Average 50.30 50.22 55.84 57.48 56.22 2018 Calendar Year First‐Day‐of‐the‐Month (FDOTM) Crude Oil Benchmark Prices Index WTI Front Month (CLc1) WTI Spot (WTC) LA Light Sweet Spot (LLS) Europe Brent Front Month (LCOc1) Europe Brent Spot Source Thomson Reuters Thomson Reuters Thomson Reuters Thomson Reuters EIA Product Oil Oil Oil Oil Oil Units ($/bbl) ($/bbl) ($/bbl) ($/bbl) ($/bbl) Month FDOTM Prior 12‐mo FDOTM Prior 12‐mo FDOTM Prior 12‐mo FDOTM Prior 12‐mo FDOTM Prior 12‐mo January 60.42 51.90 60.46 51.90 65.51 55.17 66.87 55.77 66.73 55.40 February 65.80 52.89 65.92 52.90 68.72 56.27 69.65 56.84 68.60 56.47 March 60.99 53.49 60.98 53.49 63.28 56.91 63.83 57.46 64.23 57.18 April 64.94 54.68 64.87 54.69 67.57 58.17 70.27 58.92 69.02 58.58 May 67.25 56.22 67.28 56.23 71.13 59.88 73.13 60.72 74.85 60.62 June 65.81 57.67 65.81 57.68 74.31 61.86 76.79 62.90 74.54 62.63 July 74.15 60.01 74.13 60.03 77.33 64.30 79.44 65.52 77.44 65.16 August 67.66 61.55 68.80 61.66 71.87 66.00 72.39 67.24 72.28 66.95 September 69.80 63.43 69.84 63.54 75.77 68.03 77.42 69.30 76.94 68.93 October 75.30 65.40 75.37 65.51 83.37 70.27 84.98 71.58 84.94 71.26 November 63.69 66.18 63.67 66.29 71.80 71.22 72.89 72.62 71.25 72.12 December 50.93 65.56 50.78 65.66 57.53 70.68 58.71 72.20 57.71 71.54 Annual Average 65.56 65.66 70.68 72.20 71.54 The above pricing data is provided for informational purposes only and was accepted as represented by various sources cited herein. Miller and Lents, Ltd. accepts no responsibility for the accuracy of this data.
- 2. MILLER AND LENTS, GLOBAL OIL AND GAS CONSULTANTS 2019 Calendar Year First‐Day‐of‐the‐Month (FDOTM) Gas Benchmark Prices Index Henry Hub Dominion, South Point NGPL, Midcontinent Houston Ship Channel CIG, Rockies Source Platts Platts Platts Platts Platts Product Gas Gas Gas Gas Gas Units ($/MMbtu) ($/MMbtu) ($/MMbtu) ($/MMbtu) ($/MMbtu) Month FDOTM Prior 12‐mo FDOTM Prior 12‐mo FDOTM Prior 12‐mo FDOTM Prior 12‐mo FDOTM Prior 12‐mo January 3.225 3.071 2.815 2.550 2.635 2.467 3.185 3.117 3.020 2.430 February 2.830 3.040 2.750 2.533 2.295 2.431 2.800 3.093 2.425 2.433 March April May June July August September October November December Annual Average 3.028 2.783 2.465 2.993 2.723 2018 Calendar Year First‐Day‐of‐the‐Month (FDOTM) Gas Benchmark Prices Index Henry Hub Dominion, South Point NGPL, Midcontinent Houston Ship Channel CIG, Rockies Source Platts Platts Platts Platts Platts Product Gas Gas Gas Gas Gas Units ($/MMbtu) ($/MMbtu) ($/MMbtu) ($/MMbtu) ($/MMbtu) Month FDOTM Prior 12‐mo FDOTM Prior 12‐mo FDOTM Prior 12‐mo FDOTM Prior 12‐mo FDOTM Prior 12‐mo January 3.580 2.970 3.040 2.088 3.760 2.715 4.400 3.058 3.455 2.621 February 3.205 2.987 2.955 2.101 2.725 2.705 3.090 3.067 2.385 2.585 March 2.610 2.995 2.105 2.109 2.245 2.695 2.550 3.071 2.175 2.569 April 2.755 2.967 2.475 2.080 2.195 2.652 2.850 3.050 1.820 2.502 May 2.680 2.927 2.045 2.032 1.900 2.573 2.680 3.005 1.725 2.422 June 2.885 2.917 2.515 2.055 2.510 2.560 2.935 2.987 2.190 2.385 July 2.900 2.913 2.515 2.105 2.335 2.542 3.020 2.984 2.185 2.366 August 2.815 2.911 2.490 2.158 2.140 2.503 2.860 2.990 2.305 2.345 September 2.930 2.914 2.520 2.250 2.310 2.473 3.025 2.999 2.235 2.313 October 2.990 2.922 1.315 2.298 2.075 2.434 3.200 3.023 1.965 2.283 November 3.290 2.965 2.685 2.419 2.435 2.425 3.420 3.078 2.900 2.316 December 4.565 3.100 4.160 2.568 4.100 2.561 4.590 3.218 4.250 2.466 Annual Average 3.100 2.568 2.561 3.218 2.466 The above pricing data is provided for informational purposes only and was accepted as represented by various sources cited herein. Miller and Lents, Ltd. accepts no responsibility for the accuracy of this data.