SlideShare a Scribd company logo
1 of 2
Download to read offline
MILLER AND LENTS, GLOBAL OIL AND GAS CONSULTANTS
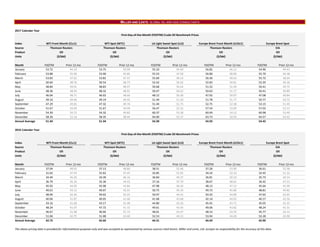
2017 Calendar Year
First‐Day‐of‐the‐Month (FDOTM) Crude Oil Benchmark Prices
Index WTI Front Month (CLc1) WTI Spot (WTC) LA Light Sweet Spot (LLS) Europe Brent Front Month (LCOc1) Europe Brent Spot
Source Thomson Reuters Thomson Reuters Thomson Reuters Thomson Reuters EIA
Product Oil Oil Oil Oil Oil
Units ($/bbl) ($/bbl) ($/bbl) ($/bbl) ($/bbl)
Month FDOTM Prior 12‐mo FDOTM Prior 12‐mo FDOTM Prior 12‐mo FDOTM Prior 12‐mo FDOTM Prior 12‐mo
January 53.72 44.14 53.75 43.99 55.10 45.69 56.82 46.12 54.96 44.43
February 53.88 45.99 53.90 45.85 55.53 47.58 56.80 48.00 55.79 46.38
March 53.83 47.61 53.82 47.47 55.60 49.14 56.36 49.63 55.72 48.04
April 50.60 48.76 50.54 48.73 52.42 50.42 52.83 50.81 52.20 49.36
May 48.84 49.01 48.83 48.97 50.68 50.64 51.52 51.09 50.41 49.75
June 48.36 48.95 48.32 48.91 50.47 50.62 50.63 51.17 50.41 49.89
July 46.04 48.71 46.02 48.66 48.12 50.38 47.92 50.97 47.08 49.84
August 49.16 49.46 49.19 49.42 51.49 51.20 51.78 51.77 50.77 50.72
September 47.29 49.81 47.32 49.76 51.40 51.75 52.75 52.38 53.15 51.40
October 51.67 50.09 51.67 50.09 56.47 52.32 57.54 53.09 57.02 52.13
November 54.30 50.73 54.32 49.82 60.37 53.38 60.49 54.12 60.98 53.40
December 58.36 51.34 58.35 48.94 64.00 52.27 63.73 54.93 64.57 54.42
Annual Average 51.34 51.34 54.30 54.93 54.42
2016 Calendar Year
First‐Day‐of‐the‐Month (FDOTM) Crude Oil Benchmark Prices
Index WTI Front Month (CLc1) WTI Spot (WTC) LA Light Sweet Spot (LLS) Europe Brent Front Month (LCOc1) Europe Brent Spot
Source Thomson Reuters Thomson Reuters Thomson Reuters Thomson Reuters EIA
Product Oil Oil Oil Oil Oil
Units ($/bbl) ($/bbl) ($/bbl) ($/bbl) ($/bbl)
Month FDOTM Prior 12‐mo FDOTM Prior 12‐mo FDOTM Prior 12‐mo FDOTM Prior 12‐mo FDOTM Prior 12‐mo
January 37.04 48.93 37.13 48.80 38.51 52.48 37.28 53.90 36.61 52.58
February 31.62 47.54 31.62 47.45 32.85 51.05 34.24 52.33 32.45 51.32
March 34.40 46.26 34.39 46.16 36.84 49.37 36.81 50.19 35.73 49.14
April 36.79 45.16 35.36 44.93 37.16 47.79 38.67 48.65 36.42 47.53
May 45.92 44.05 45.98 43.84 47.98 46.36 48.13 47.12 45.64 45.99
June 49.01 43.12 49.07 42.91 50.75 45.16 49.72 45.86 48.81 44.82
July 48.99 42.46 49.02 42.25 50.97 44.41 50.35 44.89 47.65 43.65
August 40.06 41.87 40.05 41.66 41.68 43.68 42.14 44.05 40.17 42.56
September 43.16 41.68 43.17 41.48 44.80 43.26 45.45 43.71 45.05 42.25
October 48.24 41.97 47.72 41.72 49.61 43.43 49.06 43.82 48.24 42.31
November 46.67 41.98 46.66 41.73 48.01 43.47 48.14 43.70 45.77 42.13
December 51.06 42.75 51.08 42.60 52.53 44.31 53.94 44.49 52.28 42.90
Annual Average 42.75 42.60 44.31 44.49 42.90
The above pricing data is provided for informational purposes only and was accepted as represented by various sources cited herein. Miller and Lents, Ltd. accepts no responsibility for the accuracy of this data.
MILLER AND LENTS, GLOBAL OIL AND GAS CONSULTANTS
2017 Calendar Year
First‐Day‐of‐the‐Month (FDOTM) Gas Benchmark Prices
Index Henry Hub Dominion, South Point NGPL, Midcontinent Houston Ship Channel CIG, Rockies
Source Platts Platts Platts Platts Platts
Product Gas Gas Gas Gas Gas
Units ($/MMbtu) ($/MMbtu) ($/MMbtu) ($/MMbtu) ($/MMbtu)
Month FDOTM Prior 12‐mo FDOTM Prior 12‐mo FDOTM Prior 12‐mo FDOTM Prior 12‐mo FDOTM Prior 12‐mo
January 3.650 2.593 3.185 1.496 3.520 2.426 3.510 2.553 3.615 2.369
February 3.005 2.655 2.795 1.607 2.845 2.481 2.985 2.615 2.820 2.421
March 2.510 2.730 2.010 1.694 2.355 2.557 2.505 2.689 2.360 2.503
April 3.095 2.828 2.815 1.826 2.720 2.638 3.105 2.782 2.625 2.581
May 3.165 2.933 2.630 1.934 2.840 2.725 3.215 2.898 2.685 2.660
June 3.005 3.010 2.235 1.997 2.665 2.784 3.150 2.996 2.630 2.724
July 2.950 3.014 1.920 2.023 2.555 2.770 3.055 3.018 2.415 2.715
August 2.835 3.005 1.845 2.064 2.610 2.760 2.785 3.005 2.555 2.704
September 2.890 3.001 1.420 2.080 2.675 2.750 2.925 3.014 2.625 2.703
October 2.900 3.006 0.745 2.116 2.540 2.745 2.915 3.013 2.325 2.683
November 2.770 2.656 1.225 1.523 2.545 2.492 2.760 2.624 2.505 2.451
December 2.940 2.742 2.370 1.960 2.465 2.505 2.900 2.725 2.450 2.491
Annual Average 2.976 2.100 2.695 2.984 2.634
2016 Calendar Year
First‐Day‐of‐the‐Month (FDOTM) Gas Benchmark Prices
Index Henry Hub Dominion, South Point NGPL, Midcontinent Houston Ship Channel CIG, Rockies
Source Platts Platts Platts Platts Platts
Product Gas Gas Gas Gas Gas
Units ($/MMbtu) ($/MMbtu) ($/MMbtu) ($/MMbtu) ($/MMbtu)
Month FDOTM Prior 12‐mo FDOTM Prior 12‐mo FDOTM Prior 12‐mo FDOTM Prior 12‐mo FDOTM Prior 12‐mo
January 2.310 2.530 1.410 1.409 2.355 2.395 2.290 2.495 2.390 2.333
February 2.260 2.495 1.470 1.358 2.185 2.383 2.235 2.472 2.195 2.327
March 1.600 2.398 0.960 1.277 1.440 2.288 1.620 2.387 1.380 2.230
April 1.925 2.339 1.230 1.218 1.745 2.241 1.995 2.335 1.680 2.187
May 1.905 2.284 1.340 1.206 1.800 2.188 1.820 2.278 1.740 2.138
June 2.085 2.237 1.480 1.225 1.955 2.148 1.975 2.226 1.865 2.097
July 2.900 2.248 1.605 1.269 2.730 2.152 2.785 2.228 2.525 2.088
August 2.945 2.263 1.355 1.272 2.730 2.156 2.950 2.245 2.680 2.094
September 2.935 2.283 1.225 1.275 2.785 2.173 2.810 2.262 2.640 2.105
October 2.835 2.313 0.310 1.199 2.605 2.190 2.930 2.295 2.560 2.126
November 2.785 2.382 1.545 1.247 2.455 2.240 2.730 2.363 2.395 2.181
December 3.285 2.481 2.250 1.348 3.160 2.329 3.275 2.451 3.150 2.267
Annual Average 2.481 1.348 2.329 2.451 2.267
The above pricing data is provided for informational purposes only and was accepted as represented by various sources cited herein. Miller and Lents, Ltd. accepts no responsibility for the accuracy of this data.

More Related Content

Similar to SEC FDOTM Prices December 2017

Energy & Commodities
Energy & CommoditiesEnergy & Commodities
Energy & Commodities
Swedbank
 
Purchasing Managers´Index Report, May 2011
Purchasing Managers´Index Report, May 2011Purchasing Managers´Index Report, May 2011
Purchasing Managers´Index Report, May 2011
Swedbank
 
Purchasing Managers' Index
Purchasing Managers' IndexPurchasing Managers' Index
Purchasing Managers' Index
Swedbank
 

Similar to SEC FDOTM Prices December 2017 (20)

SEC FDOTM Prices December 2019
SEC FDOTM Prices December 2019SEC FDOTM Prices December 2019
SEC FDOTM Prices December 2019
 
SEC FDOTM Prices June 2019
SEC FDOTM Prices June 2019SEC FDOTM Prices June 2019
SEC FDOTM Prices June 2019
 
SEC FDOTM Prices June 2017
SEC FDOTM Prices June 2017SEC FDOTM Prices June 2017
SEC FDOTM Prices June 2017
 
SEC FDOTM Prices May 2017
SEC FDOTM Prices May 2017SEC FDOTM Prices May 2017
SEC FDOTM Prices May 2017
 
SEC FDOTM Prices February 2019
SEC FDOTM Prices February 2019SEC FDOTM Prices February 2019
SEC FDOTM Prices February 2019
 
Purchasing Managers´Index Report, February 2011
Purchasing Managers´Index Report, February 2011Purchasing Managers´Index Report, February 2011
Purchasing Managers´Index Report, February 2011
 
Energy & Commodities
Energy & CommoditiesEnergy & Commodities
Energy & Commodities
 
Purchasing Managers' Index December 2010
Purchasing Managers' Index December 2010Purchasing Managers' Index December 2010
Purchasing Managers' Index December 2010
 
Purchasing Managers´Index Report, May 2011
Purchasing Managers´Index Report, May 2011Purchasing Managers´Index Report, May 2011
Purchasing Managers´Index Report, May 2011
 
Purchasing Managers' Index
Purchasing Managers' IndexPurchasing Managers' Index
Purchasing Managers' Index
 
Purchasing Managers' Index
Purchasing Managers' IndexPurchasing Managers' Index
Purchasing Managers' Index
 
Purchasing Managers' Index Report August 2009
Purchasing Managers' Index Report August 2009Purchasing Managers' Index Report August 2009
Purchasing Managers' Index Report August 2009
 
Ended budgeting FHC AUSTRALIA OCEANIA
Ended budgeting FHC AUSTRALIA OCEANIAEnded budgeting FHC AUSTRALIA OCEANIA
Ended budgeting FHC AUSTRALIA OCEANIA
 
FHC DAUSTRALIAP 2017
FHC DAUSTRALIAP 2017FHC DAUSTRALIAP 2017
FHC DAUSTRALIAP 2017
 
FHC MADRID FORECAST BUDGETING 2019
FHC MADRID FORECAST BUDGETING 2019FHC MADRID FORECAST BUDGETING 2019
FHC MADRID FORECAST BUDGETING 2019
 
Purchasing Managers´ Index Services, May 2011
Purchasing Managers´ Index Services, May 2011Purchasing Managers´ Index Services, May 2011
Purchasing Managers´ Index Services, May 2011
 
PROJECTED BUDGETING V'OSLO'G 2017
PROJECTED BUDGETING V'OSLO'G 2017PROJECTED BUDGETING V'OSLO'G 2017
PROJECTED BUDGETING V'OSLO'G 2017
 
FHC V OSLO G 2017
FHC V OSLO G 2017FHC V OSLO G 2017
FHC V OSLO G 2017
 
FHC BUDGET NITALIAB 2017
FHC BUDGET NITALIAB 2017FHC BUDGET NITALIAB 2017
FHC BUDGET NITALIAB 2017
 
Purchasing Managers' Index Report April 2010
Purchasing Managers' Index Report April 2010Purchasing Managers' Index Report April 2010
Purchasing Managers' Index Report April 2010
 

Recently uploaded

21P35A0312 Internship eccccccReport.docx
21P35A0312 Internship eccccccReport.docx21P35A0312 Internship eccccccReport.docx
21P35A0312 Internship eccccccReport.docx
rahulmanepalli02
 

Recently uploaded (20)

Maximizing Incident Investigation Efficacy in Oil & Gas: Techniques and Tools
Maximizing Incident Investigation Efficacy in Oil & Gas: Techniques and ToolsMaximizing Incident Investigation Efficacy in Oil & Gas: Techniques and Tools
Maximizing Incident Investigation Efficacy in Oil & Gas: Techniques and Tools
 
Developing a smart system for infant incubators using the internet of things ...
Developing a smart system for infant incubators using the internet of things ...Developing a smart system for infant incubators using the internet of things ...
Developing a smart system for infant incubators using the internet of things ...
 
Working Principle of Echo Sounder and Doppler Effect.pdf
Working Principle of Echo Sounder and Doppler Effect.pdfWorking Principle of Echo Sounder and Doppler Effect.pdf
Working Principle of Echo Sounder and Doppler Effect.pdf
 
Independent Solar-Powered Electric Vehicle Charging Station
Independent Solar-Powered Electric Vehicle Charging StationIndependent Solar-Powered Electric Vehicle Charging Station
Independent Solar-Powered Electric Vehicle Charging Station
 
21P35A0312 Internship eccccccReport.docx
21P35A0312 Internship eccccccReport.docx21P35A0312 Internship eccccccReport.docx
21P35A0312 Internship eccccccReport.docx
 
Circuit Breakers for Engineering Students
Circuit Breakers for Engineering StudentsCircuit Breakers for Engineering Students
Circuit Breakers for Engineering Students
 
8th International Conference on Soft Computing, Mathematics and Control (SMC ...
8th International Conference on Soft Computing, Mathematics and Control (SMC ...8th International Conference on Soft Computing, Mathematics and Control (SMC ...
8th International Conference on Soft Computing, Mathematics and Control (SMC ...
 
Diploma Engineering Drawing Qp-2024 Ece .pdf
Diploma Engineering Drawing Qp-2024 Ece .pdfDiploma Engineering Drawing Qp-2024 Ece .pdf
Diploma Engineering Drawing Qp-2024 Ece .pdf
 
History of Indian Railways - the story of Growth & Modernization
History of Indian Railways - the story of Growth & ModernizationHistory of Indian Railways - the story of Growth & Modernization
History of Indian Railways - the story of Growth & Modernization
 
analog-vs-digital-communication (concept of analog and digital).pptx
analog-vs-digital-communication (concept of analog and digital).pptxanalog-vs-digital-communication (concept of analog and digital).pptx
analog-vs-digital-communication (concept of analog and digital).pptx
 
NO1 Best Powerful Vashikaran Specialist Baba Vashikaran Specialist For Love V...
NO1 Best Powerful Vashikaran Specialist Baba Vashikaran Specialist For Love V...NO1 Best Powerful Vashikaran Specialist Baba Vashikaran Specialist For Love V...
NO1 Best Powerful Vashikaran Specialist Baba Vashikaran Specialist For Love V...
 
Fuzzy logic method-based stress detector with blood pressure and body tempera...
Fuzzy logic method-based stress detector with blood pressure and body tempera...Fuzzy logic method-based stress detector with blood pressure and body tempera...
Fuzzy logic method-based stress detector with blood pressure and body tempera...
 
Passive Air Cooling System and Solar Water Heater.ppt
Passive Air Cooling System and Solar Water Heater.pptPassive Air Cooling System and Solar Water Heater.ppt
Passive Air Cooling System and Solar Water Heater.ppt
 
UNIT-2 image enhancement.pdf Image Processing Unit 2 AKTU
UNIT-2 image enhancement.pdf Image Processing Unit 2 AKTUUNIT-2 image enhancement.pdf Image Processing Unit 2 AKTU
UNIT-2 image enhancement.pdf Image Processing Unit 2 AKTU
 
Raashid final report on Embedded Systems
Raashid final report on Embedded SystemsRaashid final report on Embedded Systems
Raashid final report on Embedded Systems
 
Autodesk Construction Cloud (Autodesk Build).pptx
Autodesk Construction Cloud (Autodesk Build).pptxAutodesk Construction Cloud (Autodesk Build).pptx
Autodesk Construction Cloud (Autodesk Build).pptx
 
Research Methodolgy & Intellectual Property Rights Series 1
Research Methodolgy & Intellectual Property Rights Series 1Research Methodolgy & Intellectual Property Rights Series 1
Research Methodolgy & Intellectual Property Rights Series 1
 
Intro to Design (for Engineers) at Sydney Uni
Intro to Design (for Engineers) at Sydney UniIntro to Design (for Engineers) at Sydney Uni
Intro to Design (for Engineers) at Sydney Uni
 
5G and 6G refer to generations of mobile network technology, each representin...
5G and 6G refer to generations of mobile network technology, each representin...5G and 6G refer to generations of mobile network technology, each representin...
5G and 6G refer to generations of mobile network technology, each representin...
 
litvinenko_Henry_Intrusion_Hong-Kong_2024.pdf
litvinenko_Henry_Intrusion_Hong-Kong_2024.pdflitvinenko_Henry_Intrusion_Hong-Kong_2024.pdf
litvinenko_Henry_Intrusion_Hong-Kong_2024.pdf
 

SEC FDOTM Prices December 2017

  • 1. MILLER AND LENTS, GLOBAL OIL AND GAS CONSULTANTS 2017 Calendar Year First‐Day‐of‐the‐Month (FDOTM) Crude Oil Benchmark Prices Index WTI Front Month (CLc1) WTI Spot (WTC) LA Light Sweet Spot (LLS) Europe Brent Front Month (LCOc1) Europe Brent Spot Source Thomson Reuters Thomson Reuters Thomson Reuters Thomson Reuters EIA Product Oil Oil Oil Oil Oil Units ($/bbl) ($/bbl) ($/bbl) ($/bbl) ($/bbl) Month FDOTM Prior 12‐mo FDOTM Prior 12‐mo FDOTM Prior 12‐mo FDOTM Prior 12‐mo FDOTM Prior 12‐mo January 53.72 44.14 53.75 43.99 55.10 45.69 56.82 46.12 54.96 44.43 February 53.88 45.99 53.90 45.85 55.53 47.58 56.80 48.00 55.79 46.38 March 53.83 47.61 53.82 47.47 55.60 49.14 56.36 49.63 55.72 48.04 April 50.60 48.76 50.54 48.73 52.42 50.42 52.83 50.81 52.20 49.36 May 48.84 49.01 48.83 48.97 50.68 50.64 51.52 51.09 50.41 49.75 June 48.36 48.95 48.32 48.91 50.47 50.62 50.63 51.17 50.41 49.89 July 46.04 48.71 46.02 48.66 48.12 50.38 47.92 50.97 47.08 49.84 August 49.16 49.46 49.19 49.42 51.49 51.20 51.78 51.77 50.77 50.72 September 47.29 49.81 47.32 49.76 51.40 51.75 52.75 52.38 53.15 51.40 October 51.67 50.09 51.67 50.09 56.47 52.32 57.54 53.09 57.02 52.13 November 54.30 50.73 54.32 49.82 60.37 53.38 60.49 54.12 60.98 53.40 December 58.36 51.34 58.35 48.94 64.00 52.27 63.73 54.93 64.57 54.42 Annual Average 51.34 51.34 54.30 54.93 54.42 2016 Calendar Year First‐Day‐of‐the‐Month (FDOTM) Crude Oil Benchmark Prices Index WTI Front Month (CLc1) WTI Spot (WTC) LA Light Sweet Spot (LLS) Europe Brent Front Month (LCOc1) Europe Brent Spot Source Thomson Reuters Thomson Reuters Thomson Reuters Thomson Reuters EIA Product Oil Oil Oil Oil Oil Units ($/bbl) ($/bbl) ($/bbl) ($/bbl) ($/bbl) Month FDOTM Prior 12‐mo FDOTM Prior 12‐mo FDOTM Prior 12‐mo FDOTM Prior 12‐mo FDOTM Prior 12‐mo January 37.04 48.93 37.13 48.80 38.51 52.48 37.28 53.90 36.61 52.58 February 31.62 47.54 31.62 47.45 32.85 51.05 34.24 52.33 32.45 51.32 March 34.40 46.26 34.39 46.16 36.84 49.37 36.81 50.19 35.73 49.14 April 36.79 45.16 35.36 44.93 37.16 47.79 38.67 48.65 36.42 47.53 May 45.92 44.05 45.98 43.84 47.98 46.36 48.13 47.12 45.64 45.99 June 49.01 43.12 49.07 42.91 50.75 45.16 49.72 45.86 48.81 44.82 July 48.99 42.46 49.02 42.25 50.97 44.41 50.35 44.89 47.65 43.65 August 40.06 41.87 40.05 41.66 41.68 43.68 42.14 44.05 40.17 42.56 September 43.16 41.68 43.17 41.48 44.80 43.26 45.45 43.71 45.05 42.25 October 48.24 41.97 47.72 41.72 49.61 43.43 49.06 43.82 48.24 42.31 November 46.67 41.98 46.66 41.73 48.01 43.47 48.14 43.70 45.77 42.13 December 51.06 42.75 51.08 42.60 52.53 44.31 53.94 44.49 52.28 42.90 Annual Average 42.75 42.60 44.31 44.49 42.90 The above pricing data is provided for informational purposes only and was accepted as represented by various sources cited herein. Miller and Lents, Ltd. accepts no responsibility for the accuracy of this data.
  • 2. MILLER AND LENTS, GLOBAL OIL AND GAS CONSULTANTS 2017 Calendar Year First‐Day‐of‐the‐Month (FDOTM) Gas Benchmark Prices Index Henry Hub Dominion, South Point NGPL, Midcontinent Houston Ship Channel CIG, Rockies Source Platts Platts Platts Platts Platts Product Gas Gas Gas Gas Gas Units ($/MMbtu) ($/MMbtu) ($/MMbtu) ($/MMbtu) ($/MMbtu) Month FDOTM Prior 12‐mo FDOTM Prior 12‐mo FDOTM Prior 12‐mo FDOTM Prior 12‐mo FDOTM Prior 12‐mo January 3.650 2.593 3.185 1.496 3.520 2.426 3.510 2.553 3.615 2.369 February 3.005 2.655 2.795 1.607 2.845 2.481 2.985 2.615 2.820 2.421 March 2.510 2.730 2.010 1.694 2.355 2.557 2.505 2.689 2.360 2.503 April 3.095 2.828 2.815 1.826 2.720 2.638 3.105 2.782 2.625 2.581 May 3.165 2.933 2.630 1.934 2.840 2.725 3.215 2.898 2.685 2.660 June 3.005 3.010 2.235 1.997 2.665 2.784 3.150 2.996 2.630 2.724 July 2.950 3.014 1.920 2.023 2.555 2.770 3.055 3.018 2.415 2.715 August 2.835 3.005 1.845 2.064 2.610 2.760 2.785 3.005 2.555 2.704 September 2.890 3.001 1.420 2.080 2.675 2.750 2.925 3.014 2.625 2.703 October 2.900 3.006 0.745 2.116 2.540 2.745 2.915 3.013 2.325 2.683 November 2.770 2.656 1.225 1.523 2.545 2.492 2.760 2.624 2.505 2.451 December 2.940 2.742 2.370 1.960 2.465 2.505 2.900 2.725 2.450 2.491 Annual Average 2.976 2.100 2.695 2.984 2.634 2016 Calendar Year First‐Day‐of‐the‐Month (FDOTM) Gas Benchmark Prices Index Henry Hub Dominion, South Point NGPL, Midcontinent Houston Ship Channel CIG, Rockies Source Platts Platts Platts Platts Platts Product Gas Gas Gas Gas Gas Units ($/MMbtu) ($/MMbtu) ($/MMbtu) ($/MMbtu) ($/MMbtu) Month FDOTM Prior 12‐mo FDOTM Prior 12‐mo FDOTM Prior 12‐mo FDOTM Prior 12‐mo FDOTM Prior 12‐mo January 2.310 2.530 1.410 1.409 2.355 2.395 2.290 2.495 2.390 2.333 February 2.260 2.495 1.470 1.358 2.185 2.383 2.235 2.472 2.195 2.327 March 1.600 2.398 0.960 1.277 1.440 2.288 1.620 2.387 1.380 2.230 April 1.925 2.339 1.230 1.218 1.745 2.241 1.995 2.335 1.680 2.187 May 1.905 2.284 1.340 1.206 1.800 2.188 1.820 2.278 1.740 2.138 June 2.085 2.237 1.480 1.225 1.955 2.148 1.975 2.226 1.865 2.097 July 2.900 2.248 1.605 1.269 2.730 2.152 2.785 2.228 2.525 2.088 August 2.945 2.263 1.355 1.272 2.730 2.156 2.950 2.245 2.680 2.094 September 2.935 2.283 1.225 1.275 2.785 2.173 2.810 2.262 2.640 2.105 October 2.835 2.313 0.310 1.199 2.605 2.190 2.930 2.295 2.560 2.126 November 2.785 2.382 1.545 1.247 2.455 2.240 2.730 2.363 2.395 2.181 December 3.285 2.481 2.250 1.348 3.160 2.329 3.275 2.451 3.150 2.267 Annual Average 2.481 1.348 2.329 2.451 2.267 The above pricing data is provided for informational purposes only and was accepted as represented by various sources cited herein. Miller and Lents, Ltd. accepts no responsibility for the accuracy of this data.