SlideShare a Scribd company logo
Page 1 of 10 Any information in this report is not , and should not be regarded as investment advice or as a recommendation regarding any particular security or course of
action. We recommend seeking a licensed professional for investment advice.
SE:NYE (Sea Limited)
Electronic Gaming & Multimedia | NYE | Common Stock
Values as of 18th May, 2022
Stock Target Advisor
Detailed Stock Report
Report Date: 19th May, 2022
Last Close
USD 74.20
Change
-6.01(-7.49%)
Market Cap
USD 44.90B
1 Yr Capital Gain
-67.26%
1 Yr Dividend Return
N/A
1 Yr Total
Return
-67.26%
Earning Growth (5 yr)
-818.38%
Average Target Price
205.65(+177.16% )
Average Analyst
Rating
Strong Buy
Fundamental
Analysis
Very Bullish
Our view of the stock is Very Bullish with a score of 10 out of 10, where 0 is very bearish and 10 very bullish
What to like
High market capitalization
This is one of the largest entities in its sector and is among the top quartile. Such companies tend to be more stable.
Superior risk adjusted returns
This stock has performed well, on a risk adjusted basis, compared to its sector peers(for a hold period of at least 12 months) and is in the top quartile.
Low volatility
The stock’s annual returns have been stable and consistent compared to its sector peers(for a hold period of at least 12 months) and is in the top quartile. Although
stability is good, also keep in mind it can limit returns.
Superior total returns
The stock has outperformed its sector peers on average annual total returns basis in the past 5 years (for a hold period of at least 12 months) and is in the top
quartile.
Underpriced compared to earnings
The stock is trading low compared to its peers on a price to earning basis and is in the top quartile. It may be underpriced but do check its financial performance to
make sure there is no specific reason.
Underpriced compared to book value
The stock is trading low compared to its peers on a price to book value basis and is in the top quartile. It may be underpriced but do check its financial performance to
make sure there is no specific reason.
Underpriced on cashflow basis
The stock is trading low compared to its peers on a price to cash flow basis and is in the top quartile. It may be underpriced but do check its financial performance to
make sure there is no specific reason.
Superior return on equity
The company management has delivered better return on equity in the most recent 4 quarters than its peers, placing it in the top quartile.
Superior capital utilization
The company management has delivered better return on invested capital in the most recent 4 quarters than its peers, placing it in the top quartile.
Superior return on assets
The company management has delivered better return on assets in the most recent 4 quarters than its peers, placing it in the top quartile.
Low debt
The company is less leveraged than its peers ,, and is among the top quartile, which makes it more flexible. However, do check the news and look at its sector.
Sometimes this is low because the company is not growing and has no growth potential.
Positive cash flow
The company had positive total cash flow in the most recent four quarters.
Superior Earnings Growth
This stock has shown top quartile earnings growth in the previous 5 years compared to its sector.
Superior Revenue Growth
This stock has shown top quartile revenue growth in the previous 5 years compared to its sector.
High Gross Profit to Asset Ratio
This stock is in the top quartile compared to its peers on Gross Profit to Asset Ratio. This is a popular measure among value investors for showing superior returns in
the long run.
Page 2 of 10 Any information in this report is not , and should not be regarded as investment advice or as a recommendation regarding any particular security or course of
action. We recommend seeking a licensed professional for investment advice.
What to not like
There is nothing we particularly dislike
Page 3 of 10 Any information in this report is not , and should not be regarded as investment advice or as a recommendation regarding any particular security or course of
action. We recommend seeking a licensed professional for investment advice.
SE:NYE (Sea Limited)
Electronic Gaming & Multimedia | | Common Stock
Stock Target Advisor
Detailed Stock Report
Report Date: 19th May, 2022
Adjusted Closing Share Volume
Relative Returns Relative Performance (Total Returns)
Security Capital Gain Dividend Return Total Return
SE
Sea Limited
-67.5% 0 -67.5%
VTI
Vanguard Index Funds -
Vanguard Total Stock Market
ETF
-8.1% +1.4% -6.7%
Company Overview
Sea Limited, together with its subsidiaries, engages in the digital entertainment, e-commerce, and digital financial service businesses in
Southeast Asia, Latin America, rest of Asia, and internationally. It offers Garena digital entertainment platform for users to access mobile and
PC online games, as well as eSports operations; and access to other entertainment content, including livestreaming of gameplay and social
features, such as user chat and online forums. The company also operates Shopee e-commerce platform, a mobile-centric marketplace that
provides integrated payment and logistics infrastructure and seller services. In addition, it offers SeaMoney digital financial services to
individuals and businesses, including offline and online mobile wallet, and payment processing services, as well as other offerings across
credit, insurtech, and digital bank services under the ShopeePay, SPayLater, SeaBank, and other digital financial services brands; and
payment processing services for Shopee. The company was formerly known as Garena Interactive Holding Limited and changed its name to
Sea Limited in April 2017. Sea Limited was incorporated in 2009 and is headquartered in Singapore.
Page 4 of 10 Any information in this report is not , and should not be regarded as investment advice or as a recommendation regarding any particular security or course of
action. We recommend seeking a licensed professional for investment advice.
Company Website
https://www.sea.com
Address
1 Fusionopolis Place, Singapore, Singapore, 138522
Fiscal Year End
December
Employees
67300
Technical Indicators
Value Value
Beta 1.38 52 Week High 372.70
Short Ratio 3.61 52 Week Low 54.06
Shorted Shares 20,345,548 200 Day Moving Average 221.75
Shorted Shares Previous Month 19,682,191 50 Day Moving Average 99.77
Shares Held By Insiders 3,290.90% Short Percentage 4.00%
Shares Held by Institutions 61.23 Dividend Yield N/A
Page 5 of 10 Any information in this report is not , and should not be regarded as investment advice or as a recommendation regarding any particular security or course of
action. We recommend seeking a licensed professional for investment advice.
SE:NYE (Sea Limited)
Electronic Gaming & Multimedia | | Common Stock
Stock Target Advisor
Detailed Stock Report
Report Date: 19th May, 2022
Market Performance
Market Performance vs. Industry / Classification (Electronic Gaming & Multimedia) Market Performance vs. Exchange (Nasdaq Global Select)
Value Sector Median
Percentile
Rank
Grade Market Median Percentile Rank Grade
YTD
Capital Gain -66.83% -66.8% 100% -14.1% 2%
Dividend Return N/A N/A N/A 1.0% N/A
Total Return -66.83% -66.8% 100% -13.2% 2%
Trailing 12 Months
Capital Gain -67.26% -67.3% 100% -10.9% 4%
Dividend Return N/A N/A N/A 2.8% N/A
Total Return -67.26% -67.3% 100% -8.1% 4%
Trailing 5 Years
Capital Gain 82.40% 82.4% 100% 5.3% 85%
Dividend Return N/A N/A N/A 13.0% N/A
Total Return 82.40% 82.4% 100% 20.6% 82%
Average Annual (5 Year Horizon)
Capital Gain 140.78% 140.8% 100% 5.0% 98%
Dividend Return N/A N/A 100% 2.1% 0%
Total Return 140.78% 140.8% 100% 8.1% 98%
Risk Return Profile
Volatility (Standard
Deviation)
157.75% 157.8% 100% 22.8% 4%
Risk Adjusted Return 89.24% N/A 100% 40.9% 91%
Market Capitalization 44.90B 44.90B 100% 44.90B 94%
Page 6 of 10 Any information in this report is not , and should not be regarded as investment advice or as a recommendation regarding any particular security or course of
action. We recommend seeking a licensed professional for investment advice.
Key Financial Ratios
Ratios vs. Industry / Classification (Computer Hardware) Ratios vs. Exchange (Nasdaq Global Select)
Value Sector Median
Percentile
Rank
Grade Market Median Percentile Rank Grade
Market Value
peratio 40.7 40.7 100% 16.2 14%
pbratio 4.3 4.3 100% 1.6 18%
pcfratio 215.2 215.2 100% 7.3 2%
pfcfratio N/A 0.0 N/A 10.8 N/A
Management Effectiveness
retequity -37.68% -37.7% 100% 10.2% 7%
retinvcap -23.66% -23.7% 100% 5.6% 7%
retass -6.77% -6.8% 100% 2.6% 7%
debtequityratio 46.98% 47.0% 100% 68.8% 63%
Technical Ratios
yield N/A N/A N/A 3.1% N/A
sratio 3.61 3.61 100% 2.14 29%
spercent 6.87% 6.9% 100% 3.6% 36%
beta 1.38 1.38 100% 1.04 27%
Page 7 of 10 Any information in this report is not , and should not be regarded as investment advice or as a recommendation regarding any particular security or course of
action. We recommend seeking a licensed professional for investment advice.
SE:NYE (Sea Limited)
Electronic Gaming & Multimedia | | Common Stock
Stock Target Advisor
Detailed Stock Report
Report Date: 19th May, 2022
Recent Analyst Ratings
Price Action Rating Action Analyst Rating Price date
Target Down Goldman Sachs Buy USD 190 2022-05-18
Target Lowered by Cowen USD 133 » USD 115 2022-05-18
Target Lowered by Stifel Nicolaus Research USD 160 » USD 115 2022-05-18
Target Lowered by HSBC USD 150 » USD 145 2022-05-04
Initiated by CICC Research Outperform 2022-04-27
Target Lowered by Stifel Nicolaus Research USD 200 » USD 160 2022-04-25
Initiated by Goldman Sachs Buy USD 196 2022-04-10
Reiterated by Morgan Stanley Buy USD 220 2022-04-09
Target Lowered by HSBC USD 265 » USD 150 2022-03-21
Downgraded by JP Morgan & Company Overweight » Neutral USD 250 » USD 105 2022-03-04
Target Lowered by Morgan Stanley USD 225 » USD 220 2022-03-03
Maintains Barclays Overweight USD 218 » USD 201 2022-03-03
Target Lowered by Sanford Bernstein USD 330 » USD 250 2022-03-02
Target Lowered by Citigroup USD 241 » USD 221 2022-03-02
Target Lowered by Cowen USD 370 » USD 295 2022-02-28
Target Lowered by JP Morgan & Company Overweight USD 420 » USD 250 2022-02-14
Maintains Barclays Overweight USD 427 » USD 218 2022-02-07
Downgraded by Goldman Sachs Conviction-Buy » Buy 2022-01-27
Maintains Macquarie Research Outperform USD 435 » USD 285 2022-01-27
Initiates Coverage On Loop Capital Hold USD 190 2022-01-19
Target Lowered by Stifel Nicolaus Research USD 400 » USD 300 2022-01-12
Upgraded by Bank of America Securities Neutral » Buy USD 385 » USD 287 2022-01-03
Target Raised by UBS Buy USD 350 » USD 380 2021-11-17
Target Lowered by Citigroup Buy USD 424 » USD 416 2021-11-17
Downgrades Bank of America Securities Neutral USD 380 » USD 385 2021-11-17
Page 8 of 10 Any information in this report is not , and should not be regarded as investment advice or as a recommendation regarding any particular security or course of
action. We recommend seeking a licensed professional for investment advice.
SE:NYE (Sea Limited)
Electronic Gaming & Multimedia | | Common Stock
Stock Target Advisor
Detailed Stock Report
Report Date: 19th May, 2022
Annual Financial (USD)
Page 9 of 10 Any information in this report is not , and should not be regarded as investment advice or as a recommendation regarding any particular security or course of
action. We recommend seeking a licensed professional for investment advice.
SE:NYE (Sea Limited)
Electronic Gaming & Multimedia | | Common Stock
Stock Target Advisor
Detailed Stock Report
Report Date: 19th May, 2022
Quarterly Financial (USD)
Page 10 of 10 Any information in this report is not , and should not be regarded as investment advice or as a recommendation regarding any particular security or course of
action. We recommend seeking a licensed professional for investment advice.
SE:NYE (Sea Limited)
Electronic Gaming & Multimedia | | Common Stock
Stock Target Advisor
Detailed Stock Report
Report Date: 19th May, 2022
Largest Industry Peers for Electronic Gaming & Multimedia
Symbol Company Name Price(Change) Market Cap
7974 Nintendo Co Ltd N/A N/A
9697 Capcom Co Ltd N/A N/A
2121 mixi Inc N/A N/A
3635 Koei Tecmo Holdings Co Ltd N/A N/A
9684 Square Enix Holdings Co Ltd N/A N/A
ETFs Containing SE
Symbol Company Name Weight Mer Price(Change) Market Cap
EMQQ EMQQ The Emerging Markets Inte.. 0.00 % 0.86 % -1.01 (-0.5%) USD 0.65B
EMQQ:LSE EMQQ Emerging Markets Internet.. 0.00 % 0.00 % -0.12 (-0.5%) USD 0.22B
ESGB:LSE VanEck Vectors Video Gaming an.. 0.00 % 0.00 % +0.01 (+-0.5%) N/A
HERO Global X Funds - Global X Vide.. 0.00 % 0.00 % -0.16 (-0.5%) USD 0.26B
TGRW T. Rowe Price Growth Stock ETF 0.00 % 0.00 % -1.13 (-0.5%) N/A
TCHP T. Rowe Price Exchange-Traded .. 0.00 % 0.00 % -1.17 (-0.5%) N/A
MMLG First Trust Exchange-Traded Fu.. 0.00 % 0.00 % -0.83 (-0.5%) N/A
IWFH iShares Virtual Work and Life .. 0.00 % 0.00 % -0.50 (-0.5%) N/A
XMAS:LSE Xtrackers - MSCI EM Asia Swap .. 0.00 % 0.00 % -25.00 (-0.5%) USD 0.29B
XMAD:LSE Xtrackers - MSCI EM Asia Swap .. 0.00 % 0.00 % -0.59 (-0.5%) USD 0.29B
The Stock Target Advisor platform run millions of calculations every day on over 30,000 Canadian and American stocks, comparing and
ranking their financial and market performance against their sectors and exchange.
We represent the percentile ranking using the following grading system.
Letter Grade Percentage Letter Grade Percentage Letter Grade Percentage
A+ 97%-100% A 93%-96% A- 90%-92%
B+ 97%-89% B 83%-86% B- 80%-82%
C+ 77%-79% C 73%-76% C- 70%-72%
D+ 67%-69% D 63%-66% D- 60%-62%
F 0%-59%

More Related Content

Similar to Sea Limited (SE) Stock Analysis

Similar to Sea Limited (SE) Stock Analysis (20)

Target Corporation.pdf
Target Corporation.pdfTarget Corporation.pdf
Target Corporation.pdf
 
LUMN-Lumen Technologies Inc
LUMN-Lumen Technologies Inc LUMN-Lumen Technologies Inc
LUMN-Lumen Technologies Inc
 
Cenovus Energy Inc (CVE) Stock Analysis Report
Cenovus Energy Inc (CVE) Stock Analysis ReportCenovus Energy Inc (CVE) Stock Analysis Report
Cenovus Energy Inc (CVE) Stock Analysis Report
 
Block Inc (SQ) Stock Analysis Report
Block Inc (SQ) Stock Analysis ReportBlock Inc (SQ) Stock Analysis Report
Block Inc (SQ) Stock Analysis Report
 
Enthusiast Gaming Holdings Inc (EGLX) Stock Analysis
Enthusiast Gaming Holdings Inc (EGLX) Stock AnalysisEnthusiast Gaming Holdings Inc (EGLX) Stock Analysis
Enthusiast Gaming Holdings Inc (EGLX) Stock Analysis
 
Gilead Sciences Inc (GILD) Stock Analysis Report
 Gilead Sciences Inc (GILD) Stock Analysis Report Gilead Sciences Inc (GILD) Stock Analysis Report
Gilead Sciences Inc (GILD) Stock Analysis Report
 
Albemarle Corporation (ALB) Stock Analysis Report
Albemarle Corporation (ALB) Stock Analysis ReportAlbemarle Corporation (ALB) Stock Analysis Report
Albemarle Corporation (ALB) Stock Analysis Report
 
Target Corporation (TGT) Stock Analysis Report
 Target Corporation (TGT) Stock Analysis Report Target Corporation (TGT) Stock Analysis Report
Target Corporation (TGT) Stock Analysis Report
 
Tourmaline Oil Corp (TOU) Stock Analysis
 Tourmaline Oil Corp (TOU) Stock Analysis Tourmaline Oil Corp (TOU) Stock Analysis
Tourmaline Oil Corp (TOU) Stock Analysis
 
Digital Turbine Inc (APPS) Stock Analysis
Digital Turbine Inc (APPS) Stock AnalysisDigital Turbine Inc (APPS) Stock Analysis
Digital Turbine Inc (APPS) Stock Analysis
 
Entergy Corporation (ETR) Stock Analysis
Entergy Corporation (ETR) Stock AnalysisEntergy Corporation (ETR) Stock Analysis
Entergy Corporation (ETR) Stock Analysis
 
Coupa Software Incorporated (COUP) Stock Analysis Report
Coupa Software Incorporated (COUP) Stock Analysis ReportCoupa Software Incorporated (COUP) Stock Analysis Report
Coupa Software Incorporated (COUP) Stock Analysis Report
 
Welltower Inc
Welltower IncWelltower Inc
Welltower Inc
 
Cineplex Inc (CGX) Stock Analysis Report
Cineplex Inc (CGX) Stock Analysis ReportCineplex Inc (CGX) Stock Analysis Report
Cineplex Inc (CGX) Stock Analysis Report
 
Kingsoft Corporation Limited stock Analysis
Kingsoft Corporation Limited stock AnalysisKingsoft Corporation Limited stock Analysis
Kingsoft Corporation Limited stock Analysis
 
Dynatrace Inc (DT) Stock Analysis
Dynatrace Inc (DT) Stock AnalysisDynatrace Inc (DT) Stock Analysis
Dynatrace Inc (DT) Stock Analysis
 
Guidewire Software Inc (GWRE) Stock Analysis Report
Guidewire Software Inc (GWRE) Stock Analysis ReportGuidewire Software Inc (GWRE) Stock Analysis Report
Guidewire Software Inc (GWRE) Stock Analysis Report
 
Progress Software Corporation.pdf
Progress Software Corporation.pdfProgress Software Corporation.pdf
Progress Software Corporation.pdf
 
Microsoft Corporation
Microsoft CorporationMicrosoft Corporation
Microsoft Corporation
 
Target Corporation (TGT) Stock Analysis
Target Corporation (TGT) Stock AnalysisTarget Corporation (TGT) Stock Analysis
Target Corporation (TGT) Stock Analysis
 

More from Stock Target Advisor

More from Stock Target Advisor (20)

Core & Main Inc (CNM) Stock
Core & Main Inc (CNM) StockCore & Main Inc (CNM) Stock
Core & Main Inc (CNM) Stock
 
ProShares Metaverse ETF
ProShares Metaverse ETFProShares Metaverse ETF
ProShares Metaverse ETF
 
Analyst ratings for ProShares Short Real Estate
Analyst ratings for ProShares Short Real EstateAnalyst ratings for ProShares Short Real Estate
Analyst ratings for ProShares Short Real Estate
 
Analyst ratings for Bragg Gaming Group Inc
Analyst ratings for Bragg Gaming Group IncAnalyst ratings for Bragg Gaming Group Inc
Analyst ratings for Bragg Gaming Group Inc
 
analyst ratings for Brookline Bancorp Inc
analyst ratings for Brookline Bancorp Incanalyst ratings for Brookline Bancorp Inc
analyst ratings for Brookline Bancorp Inc
 
Analyst Ratings for Tesla Inc
Analyst Ratings for Tesla IncAnalyst Ratings for Tesla Inc
Analyst Ratings for Tesla Inc
 
Moderna Inc (MRNA) Stock Analysis
Moderna Inc (MRNA) Stock AnalysisModerna Inc (MRNA) Stock Analysis
Moderna Inc (MRNA) Stock Analysis
 
Analyst Rating for Apple Inc.
Analyst Rating for Apple Inc.Analyst Rating for Apple Inc.
Analyst Rating for Apple Inc.
 
Bristol-Myers Squibb Company (BMY) Stock Analysis Report
 Bristol-Myers Squibb Company (BMY) Stock Analysis Report Bristol-Myers Squibb Company (BMY) Stock Analysis Report
Bristol-Myers Squibb Company (BMY) Stock Analysis Report
 
Five Below Inc (FIVE) Stock Analysis Report
 Five Below Inc (FIVE) Stock Analysis Report Five Below Inc (FIVE) Stock Analysis Report
Five Below Inc (FIVE) Stock Analysis Report
 
The Lovesac Company (LOVE) Stock Analysis Report
The Lovesac Company (LOVE) Stock Analysis ReportThe Lovesac Company (LOVE) Stock Analysis Report
The Lovesac Company (LOVE) Stock Analysis Report
 
Microsoft Corporation (MSFT) Stock Analysis Report
Microsoft Corporation (MSFT) Stock Analysis ReportMicrosoft Corporation (MSFT) Stock Analysis Report
Microsoft Corporation (MSFT) Stock Analysis Report
 
Ollies Bargain Outlet Holdings Inc (OLLI) Stock Analysis Report
Ollies Bargain Outlet Holdings Inc (OLLI) Stock Analysis ReportOllies Bargain Outlet Holdings Inc (OLLI) Stock Analysis Report
Ollies Bargain Outlet Holdings Inc (OLLI) Stock Analysis Report
 
Beam Global (BEEM) Stock Analysis Report
Beam Global (BEEM) Stock Analysis ReportBeam Global (BEEM) Stock Analysis Report
Beam Global (BEEM) Stock Analysis Report
 
Rigel Pharmaceuticals Inc (RIGL) Stock Analysis
Rigel Pharmaceuticals Inc (RIGL) Stock AnalysisRigel Pharmaceuticals Inc (RIGL) Stock Analysis
Rigel Pharmaceuticals Inc (RIGL) Stock Analysis
 
Aldeyra The (ALDX) Stock Analysis Report
 Aldeyra The (ALDX) Stock Analysis Report Aldeyra The (ALDX) Stock Analysis Report
Aldeyra The (ALDX) Stock Analysis Report
 
Couchbase Inc (BASE) Stock Analysis Report
 Couchbase Inc (BASE) Stock Analysis Report Couchbase Inc (BASE) Stock Analysis Report
Couchbase Inc (BASE) Stock Analysis Report
 
Rigel Pharmaceuticals Inc (RIGL) Stock Analysis Report
Rigel Pharmaceuticals Inc (RIGL) Stock Analysis ReportRigel Pharmaceuticals Inc (RIGL) Stock Analysis Report
Rigel Pharmaceuticals Inc (RIGL) Stock Analysis Report
 
IVERIC bio Inc (ISEE) Stock Analysis Report
 IVERIC bio Inc (ISEE) Stock Analysis Report IVERIC bio Inc (ISEE) Stock Analysis Report
IVERIC bio Inc (ISEE) Stock Analysis Report
 
Joby Aviation (JOBY) Stock Analysis Report
Joby Aviation (JOBY) Stock Analysis ReportJoby Aviation (JOBY) Stock Analysis Report
Joby Aviation (JOBY) Stock Analysis Report
 

Recently uploaded

USDA Loans in California: A Comprehensive Overview.pptx
USDA Loans in California: A Comprehensive Overview.pptxUSDA Loans in California: A Comprehensive Overview.pptx
USDA Loans in California: A Comprehensive Overview.pptx
marketing367770
 
一比一原版Adelaide毕业证阿德莱德大学毕业证成绩单如何办理
一比一原版Adelaide毕业证阿德莱德大学毕业证成绩单如何办理一比一原版Adelaide毕业证阿德莱德大学毕业证成绩单如何办理
一比一原版Adelaide毕业证阿德莱德大学毕业证成绩单如何办理
zsewypy
 

Recently uploaded (20)

how can I sell my pi coins for cash in a pi APP
how can I sell my pi coins for cash in a pi APPhow can I sell my pi coins for cash in a pi APP
how can I sell my pi coins for cash in a pi APP
 
National Financial Reporting Authority (NFRA)
National Financial Reporting Authority (NFRA)National Financial Reporting Authority (NFRA)
National Financial Reporting Authority (NFRA)
 
how to sell pi coins in Canada, Uk and Australia
how to sell pi coins in Canada, Uk and Australiahow to sell pi coins in Canada, Uk and Australia
how to sell pi coins in Canada, Uk and Australia
 
how to sell pi coins on Bitmart crypto exchange
how to sell pi coins on Bitmart crypto exchangehow to sell pi coins on Bitmart crypto exchange
how to sell pi coins on Bitmart crypto exchange
 
USDA Loans in California: A Comprehensive Overview.pptx
USDA Loans in California: A Comprehensive Overview.pptxUSDA Loans in California: A Comprehensive Overview.pptx
USDA Loans in California: A Comprehensive Overview.pptx
 
how to sell pi coins on Binance exchange
how to sell pi coins on Binance exchangehow to sell pi coins on Binance exchange
how to sell pi coins on Binance exchange
 
Webinar Exploring DORA for Fintechs - Simont Braun
Webinar Exploring DORA for Fintechs - Simont BraunWebinar Exploring DORA for Fintechs - Simont Braun
Webinar Exploring DORA for Fintechs - Simont Braun
 
how can I sell pi coins after successfully completing KYC
how can I sell pi coins after successfully completing KYChow can I sell pi coins after successfully completing KYC
how can I sell pi coins after successfully completing KYC
 
The new type of smart, sustainable entrepreneurship and the next day | Europe...
The new type of smart, sustainable entrepreneurship and the next day | Europe...The new type of smart, sustainable entrepreneurship and the next day | Europe...
The new type of smart, sustainable entrepreneurship and the next day | Europe...
 
how can I sell my locked pi coins safety.
how can I sell my locked pi coins safety.how can I sell my locked pi coins safety.
how can I sell my locked pi coins safety.
 
一比一原版Adelaide毕业证阿德莱德大学毕业证成绩单如何办理
一比一原版Adelaide毕业证阿德莱德大学毕业证成绩单如何办理一比一原版Adelaide毕业证阿德莱德大学毕业证成绩单如何办理
一比一原版Adelaide毕业证阿德莱德大学毕业证成绩单如何办理
 
Juspay Case study(Doubling Revenue Juspay's Success).pptx
Juspay Case study(Doubling Revenue Juspay's Success).pptxJuspay Case study(Doubling Revenue Juspay's Success).pptx
Juspay Case study(Doubling Revenue Juspay's Success).pptx
 
what is a pi whale and how to access one.
what is a pi whale and how to access one.what is a pi whale and how to access one.
what is a pi whale and how to access one.
 
how can I transfer pi coins to someone in a different country.
how can I transfer pi coins to someone in a different country.how can I transfer pi coins to someone in a different country.
how can I transfer pi coins to someone in a different country.
 
Industry Insights - Financial Performance & Valuation Trends
Industry Insights - Financial Performance & Valuation TrendsIndustry Insights - Financial Performance & Valuation Trends
Industry Insights - Financial Performance & Valuation Trends
 
how can I sell/buy bulk pi coins securely
how can I sell/buy bulk pi coins securelyhow can I sell/buy bulk pi coins securely
how can I sell/buy bulk pi coins securely
 
Digital Finance Summit 2024 Partners Brochure
Digital Finance Summit 2024 Partners BrochureDigital Finance Summit 2024 Partners Brochure
Digital Finance Summit 2024 Partners Brochure
 
how to sell pi coins at high rate quickly.
how to sell pi coins at high rate quickly.how to sell pi coins at high rate quickly.
how to sell pi coins at high rate quickly.
 
Jio Financial service Multibagger 2024 from India stock Market
Jio Financial service  Multibagger 2024 from India stock MarketJio Financial service  Multibagger 2024 from India stock Market
Jio Financial service Multibagger 2024 from India stock Market
 
Bitcoin Masterclass TechweekNZ v3.1.pptx
Bitcoin Masterclass TechweekNZ v3.1.pptxBitcoin Masterclass TechweekNZ v3.1.pptx
Bitcoin Masterclass TechweekNZ v3.1.pptx
 

Sea Limited (SE) Stock Analysis

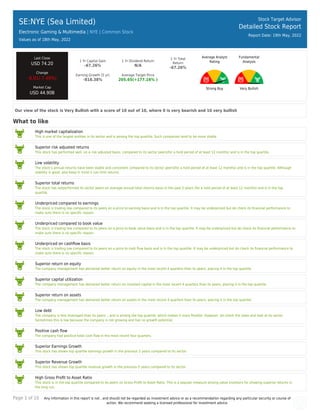
  • 1. Page 1 of 10 Any information in this report is not , and should not be regarded as investment advice or as a recommendation regarding any particular security or course of action. We recommend seeking a licensed professional for investment advice. SE:NYE (Sea Limited) Electronic Gaming & Multimedia | NYE | Common Stock Values as of 18th May, 2022 Stock Target Advisor Detailed Stock Report Report Date: 19th May, 2022 Last Close USD 74.20 Change -6.01(-7.49%) Market Cap USD 44.90B 1 Yr Capital Gain -67.26% 1 Yr Dividend Return N/A 1 Yr Total Return -67.26% Earning Growth (5 yr) -818.38% Average Target Price 205.65(+177.16% ) Average Analyst Rating Strong Buy Fundamental Analysis Very Bullish Our view of the stock is Very Bullish with a score of 10 out of 10, where 0 is very bearish and 10 very bullish What to like High market capitalization This is one of the largest entities in its sector and is among the top quartile. Such companies tend to be more stable. Superior risk adjusted returns This stock has performed well, on a risk adjusted basis, compared to its sector peers(for a hold period of at least 12 months) and is in the top quartile. Low volatility The stock’s annual returns have been stable and consistent compared to its sector peers(for a hold period of at least 12 months) and is in the top quartile. Although stability is good, also keep in mind it can limit returns. Superior total returns The stock has outperformed its sector peers on average annual total returns basis in the past 5 years (for a hold period of at least 12 months) and is in the top quartile. Underpriced compared to earnings The stock is trading low compared to its peers on a price to earning basis and is in the top quartile. It may be underpriced but do check its financial performance to make sure there is no specific reason. Underpriced compared to book value The stock is trading low compared to its peers on a price to book value basis and is in the top quartile. It may be underpriced but do check its financial performance to make sure there is no specific reason. Underpriced on cashflow basis The stock is trading low compared to its peers on a price to cash flow basis and is in the top quartile. It may be underpriced but do check its financial performance to make sure there is no specific reason. Superior return on equity The company management has delivered better return on equity in the most recent 4 quarters than its peers, placing it in the top quartile. Superior capital utilization The company management has delivered better return on invested capital in the most recent 4 quarters than its peers, placing it in the top quartile. Superior return on assets The company management has delivered better return on assets in the most recent 4 quarters than its peers, placing it in the top quartile. Low debt The company is less leveraged than its peers ,, and is among the top quartile, which makes it more flexible. However, do check the news and look at its sector. Sometimes this is low because the company is not growing and has no growth potential. Positive cash flow The company had positive total cash flow in the most recent four quarters. Superior Earnings Growth This stock has shown top quartile earnings growth in the previous 5 years compared to its sector. Superior Revenue Growth This stock has shown top quartile revenue growth in the previous 5 years compared to its sector. High Gross Profit to Asset Ratio This stock is in the top quartile compared to its peers on Gross Profit to Asset Ratio. This is a popular measure among value investors for showing superior returns in the long run.
  • 2. Page 2 of 10 Any information in this report is not , and should not be regarded as investment advice or as a recommendation regarding any particular security or course of action. We recommend seeking a licensed professional for investment advice. What to not like There is nothing we particularly dislike
  • 3. Page 3 of 10 Any information in this report is not , and should not be regarded as investment advice or as a recommendation regarding any particular security or course of action. We recommend seeking a licensed professional for investment advice. SE:NYE (Sea Limited) Electronic Gaming & Multimedia | | Common Stock Stock Target Advisor Detailed Stock Report Report Date: 19th May, 2022 Adjusted Closing Share Volume Relative Returns Relative Performance (Total Returns) Security Capital Gain Dividend Return Total Return SE Sea Limited -67.5% 0 -67.5% VTI Vanguard Index Funds - Vanguard Total Stock Market ETF -8.1% +1.4% -6.7% Company Overview Sea Limited, together with its subsidiaries, engages in the digital entertainment, e-commerce, and digital financial service businesses in Southeast Asia, Latin America, rest of Asia, and internationally. It offers Garena digital entertainment platform for users to access mobile and PC online games, as well as eSports operations; and access to other entertainment content, including livestreaming of gameplay and social features, such as user chat and online forums. The company also operates Shopee e-commerce platform, a mobile-centric marketplace that provides integrated payment and logistics infrastructure and seller services. In addition, it offers SeaMoney digital financial services to individuals and businesses, including offline and online mobile wallet, and payment processing services, as well as other offerings across credit, insurtech, and digital bank services under the ShopeePay, SPayLater, SeaBank, and other digital financial services brands; and payment processing services for Shopee. The company was formerly known as Garena Interactive Holding Limited and changed its name to Sea Limited in April 2017. Sea Limited was incorporated in 2009 and is headquartered in Singapore.
  • 4. Page 4 of 10 Any information in this report is not , and should not be regarded as investment advice or as a recommendation regarding any particular security or course of action. We recommend seeking a licensed professional for investment advice. Company Website https://www.sea.com Address 1 Fusionopolis Place, Singapore, Singapore, 138522 Fiscal Year End December Employees 67300 Technical Indicators Value Value Beta 1.38 52 Week High 372.70 Short Ratio 3.61 52 Week Low 54.06 Shorted Shares 20,345,548 200 Day Moving Average 221.75 Shorted Shares Previous Month 19,682,191 50 Day Moving Average 99.77 Shares Held By Insiders 3,290.90% Short Percentage 4.00% Shares Held by Institutions 61.23 Dividend Yield N/A
  • 5. Page 5 of 10 Any information in this report is not , and should not be regarded as investment advice or as a recommendation regarding any particular security or course of action. We recommend seeking a licensed professional for investment advice. SE:NYE (Sea Limited) Electronic Gaming & Multimedia | | Common Stock Stock Target Advisor Detailed Stock Report Report Date: 19th May, 2022 Market Performance Market Performance vs. Industry / Classification (Electronic Gaming & Multimedia) Market Performance vs. Exchange (Nasdaq Global Select) Value Sector Median Percentile Rank Grade Market Median Percentile Rank Grade YTD Capital Gain -66.83% -66.8% 100% -14.1% 2% Dividend Return N/A N/A N/A 1.0% N/A Total Return -66.83% -66.8% 100% -13.2% 2% Trailing 12 Months Capital Gain -67.26% -67.3% 100% -10.9% 4% Dividend Return N/A N/A N/A 2.8% N/A Total Return -67.26% -67.3% 100% -8.1% 4% Trailing 5 Years Capital Gain 82.40% 82.4% 100% 5.3% 85% Dividend Return N/A N/A N/A 13.0% N/A Total Return 82.40% 82.4% 100% 20.6% 82% Average Annual (5 Year Horizon) Capital Gain 140.78% 140.8% 100% 5.0% 98% Dividend Return N/A N/A 100% 2.1% 0% Total Return 140.78% 140.8% 100% 8.1% 98% Risk Return Profile Volatility (Standard Deviation) 157.75% 157.8% 100% 22.8% 4% Risk Adjusted Return 89.24% N/A 100% 40.9% 91% Market Capitalization 44.90B 44.90B 100% 44.90B 94%
  • 6. Page 6 of 10 Any information in this report is not , and should not be regarded as investment advice or as a recommendation regarding any particular security or course of action. We recommend seeking a licensed professional for investment advice. Key Financial Ratios Ratios vs. Industry / Classification (Computer Hardware) Ratios vs. Exchange (Nasdaq Global Select) Value Sector Median Percentile Rank Grade Market Median Percentile Rank Grade Market Value peratio 40.7 40.7 100% 16.2 14% pbratio 4.3 4.3 100% 1.6 18% pcfratio 215.2 215.2 100% 7.3 2% pfcfratio N/A 0.0 N/A 10.8 N/A Management Effectiveness retequity -37.68% -37.7% 100% 10.2% 7% retinvcap -23.66% -23.7% 100% 5.6% 7% retass -6.77% -6.8% 100% 2.6% 7% debtequityratio 46.98% 47.0% 100% 68.8% 63% Technical Ratios yield N/A N/A N/A 3.1% N/A sratio 3.61 3.61 100% 2.14 29% spercent 6.87% 6.9% 100% 3.6% 36% beta 1.38 1.38 100% 1.04 27%
  • 7. Page 7 of 10 Any information in this report is not , and should not be regarded as investment advice or as a recommendation regarding any particular security or course of action. We recommend seeking a licensed professional for investment advice. SE:NYE (Sea Limited) Electronic Gaming & Multimedia | | Common Stock Stock Target Advisor Detailed Stock Report Report Date: 19th May, 2022 Recent Analyst Ratings Price Action Rating Action Analyst Rating Price date Target Down Goldman Sachs Buy USD 190 2022-05-18 Target Lowered by Cowen USD 133 » USD 115 2022-05-18 Target Lowered by Stifel Nicolaus Research USD 160 » USD 115 2022-05-18 Target Lowered by HSBC USD 150 » USD 145 2022-05-04 Initiated by CICC Research Outperform 2022-04-27 Target Lowered by Stifel Nicolaus Research USD 200 » USD 160 2022-04-25 Initiated by Goldman Sachs Buy USD 196 2022-04-10 Reiterated by Morgan Stanley Buy USD 220 2022-04-09 Target Lowered by HSBC USD 265 » USD 150 2022-03-21 Downgraded by JP Morgan & Company Overweight » Neutral USD 250 » USD 105 2022-03-04 Target Lowered by Morgan Stanley USD 225 » USD 220 2022-03-03 Maintains Barclays Overweight USD 218 » USD 201 2022-03-03 Target Lowered by Sanford Bernstein USD 330 » USD 250 2022-03-02 Target Lowered by Citigroup USD 241 » USD 221 2022-03-02 Target Lowered by Cowen USD 370 » USD 295 2022-02-28 Target Lowered by JP Morgan & Company Overweight USD 420 » USD 250 2022-02-14 Maintains Barclays Overweight USD 427 » USD 218 2022-02-07 Downgraded by Goldman Sachs Conviction-Buy » Buy 2022-01-27 Maintains Macquarie Research Outperform USD 435 » USD 285 2022-01-27 Initiates Coverage On Loop Capital Hold USD 190 2022-01-19 Target Lowered by Stifel Nicolaus Research USD 400 » USD 300 2022-01-12 Upgraded by Bank of America Securities Neutral » Buy USD 385 » USD 287 2022-01-03 Target Raised by UBS Buy USD 350 » USD 380 2021-11-17 Target Lowered by Citigroup Buy USD 424 » USD 416 2021-11-17 Downgrades Bank of America Securities Neutral USD 380 » USD 385 2021-11-17
  • 8. Page 8 of 10 Any information in this report is not , and should not be regarded as investment advice or as a recommendation regarding any particular security or course of action. We recommend seeking a licensed professional for investment advice. SE:NYE (Sea Limited) Electronic Gaming & Multimedia | | Common Stock Stock Target Advisor Detailed Stock Report Report Date: 19th May, 2022 Annual Financial (USD)
  • 9. Page 9 of 10 Any information in this report is not , and should not be regarded as investment advice or as a recommendation regarding any particular security or course of action. We recommend seeking a licensed professional for investment advice. SE:NYE (Sea Limited) Electronic Gaming & Multimedia | | Common Stock Stock Target Advisor Detailed Stock Report Report Date: 19th May, 2022 Quarterly Financial (USD)
  • 10. Page 10 of 10 Any information in this report is not , and should not be regarded as investment advice or as a recommendation regarding any particular security or course of action. We recommend seeking a licensed professional for investment advice. SE:NYE (Sea Limited) Electronic Gaming & Multimedia | | Common Stock Stock Target Advisor Detailed Stock Report Report Date: 19th May, 2022 Largest Industry Peers for Electronic Gaming & Multimedia Symbol Company Name Price(Change) Market Cap 7974 Nintendo Co Ltd N/A N/A 9697 Capcom Co Ltd N/A N/A 2121 mixi Inc N/A N/A 3635 Koei Tecmo Holdings Co Ltd N/A N/A 9684 Square Enix Holdings Co Ltd N/A N/A ETFs Containing SE Symbol Company Name Weight Mer Price(Change) Market Cap EMQQ EMQQ The Emerging Markets Inte.. 0.00 % 0.86 % -1.01 (-0.5%) USD 0.65B EMQQ:LSE EMQQ Emerging Markets Internet.. 0.00 % 0.00 % -0.12 (-0.5%) USD 0.22B ESGB:LSE VanEck Vectors Video Gaming an.. 0.00 % 0.00 % +0.01 (+-0.5%) N/A HERO Global X Funds - Global X Vide.. 0.00 % 0.00 % -0.16 (-0.5%) USD 0.26B TGRW T. Rowe Price Growth Stock ETF 0.00 % 0.00 % -1.13 (-0.5%) N/A TCHP T. Rowe Price Exchange-Traded .. 0.00 % 0.00 % -1.17 (-0.5%) N/A MMLG First Trust Exchange-Traded Fu.. 0.00 % 0.00 % -0.83 (-0.5%) N/A IWFH iShares Virtual Work and Life .. 0.00 % 0.00 % -0.50 (-0.5%) N/A XMAS:LSE Xtrackers - MSCI EM Asia Swap .. 0.00 % 0.00 % -25.00 (-0.5%) USD 0.29B XMAD:LSE Xtrackers - MSCI EM Asia Swap .. 0.00 % 0.00 % -0.59 (-0.5%) USD 0.29B The Stock Target Advisor platform run millions of calculations every day on over 30,000 Canadian and American stocks, comparing and ranking their financial and market performance against their sectors and exchange. We represent the percentile ranking using the following grading system. Letter Grade Percentage Letter Grade Percentage Letter Grade Percentage A+ 97%-100% A 93%-96% A- 90%-92% B+ 97%-89% B 83%-86% B- 80%-82% C+ 77%-79% C 73%-76% C- 70%-72% D+ 67%-69% D 63%-66% D- 60%-62% F 0%-59%