Download as PDF, PPTX
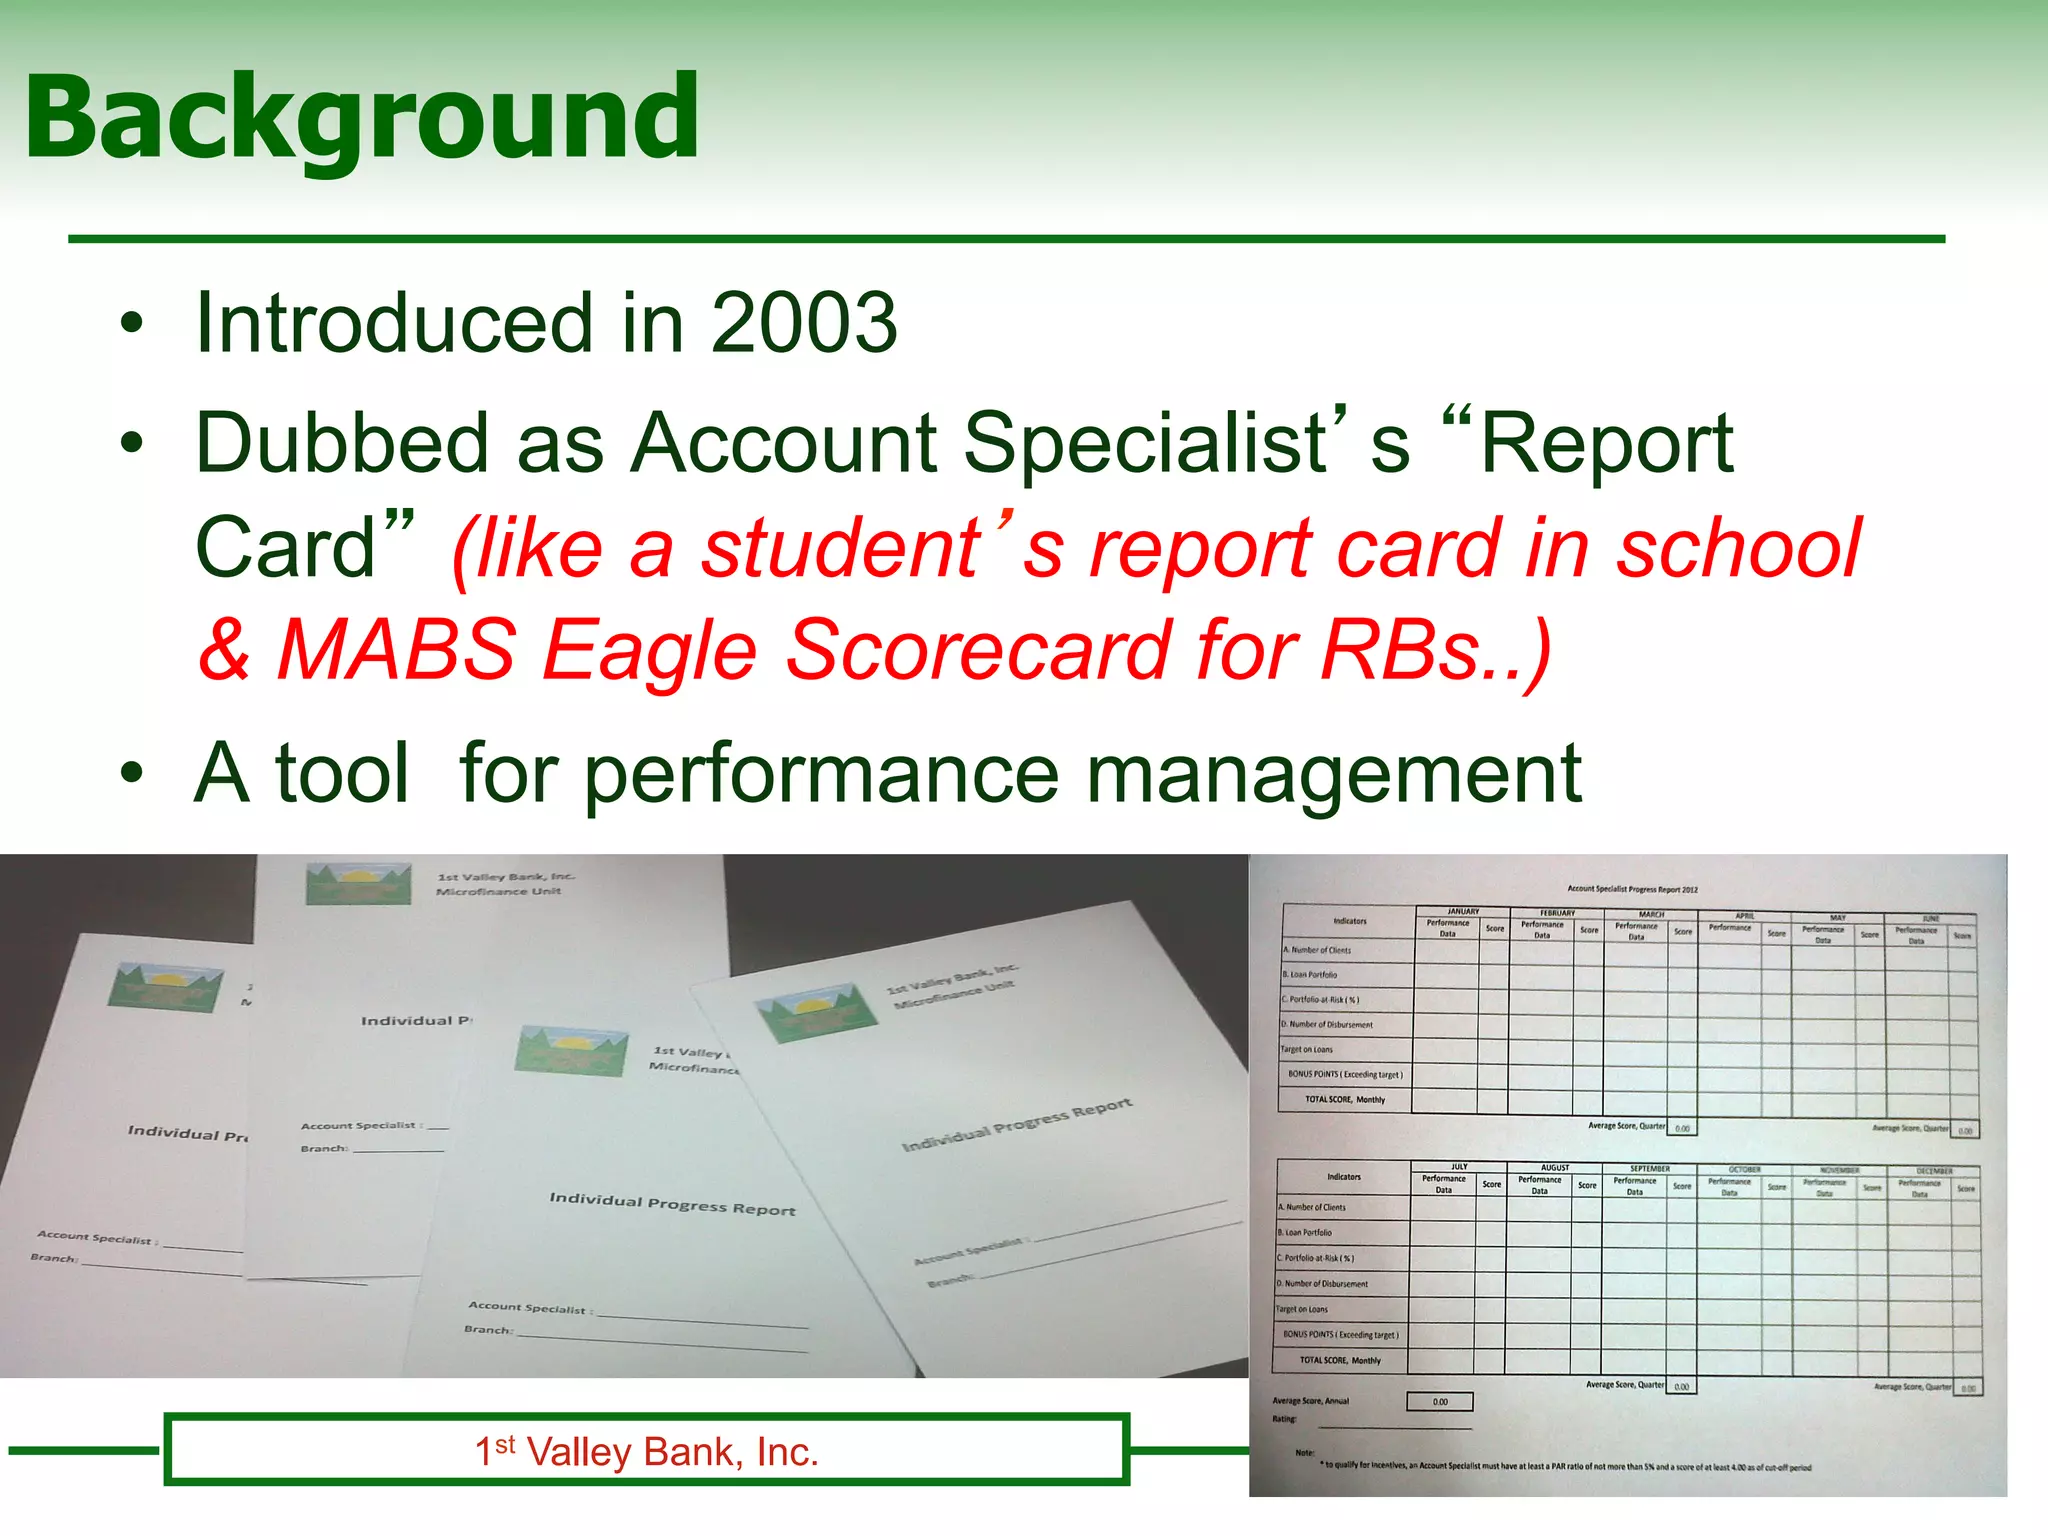
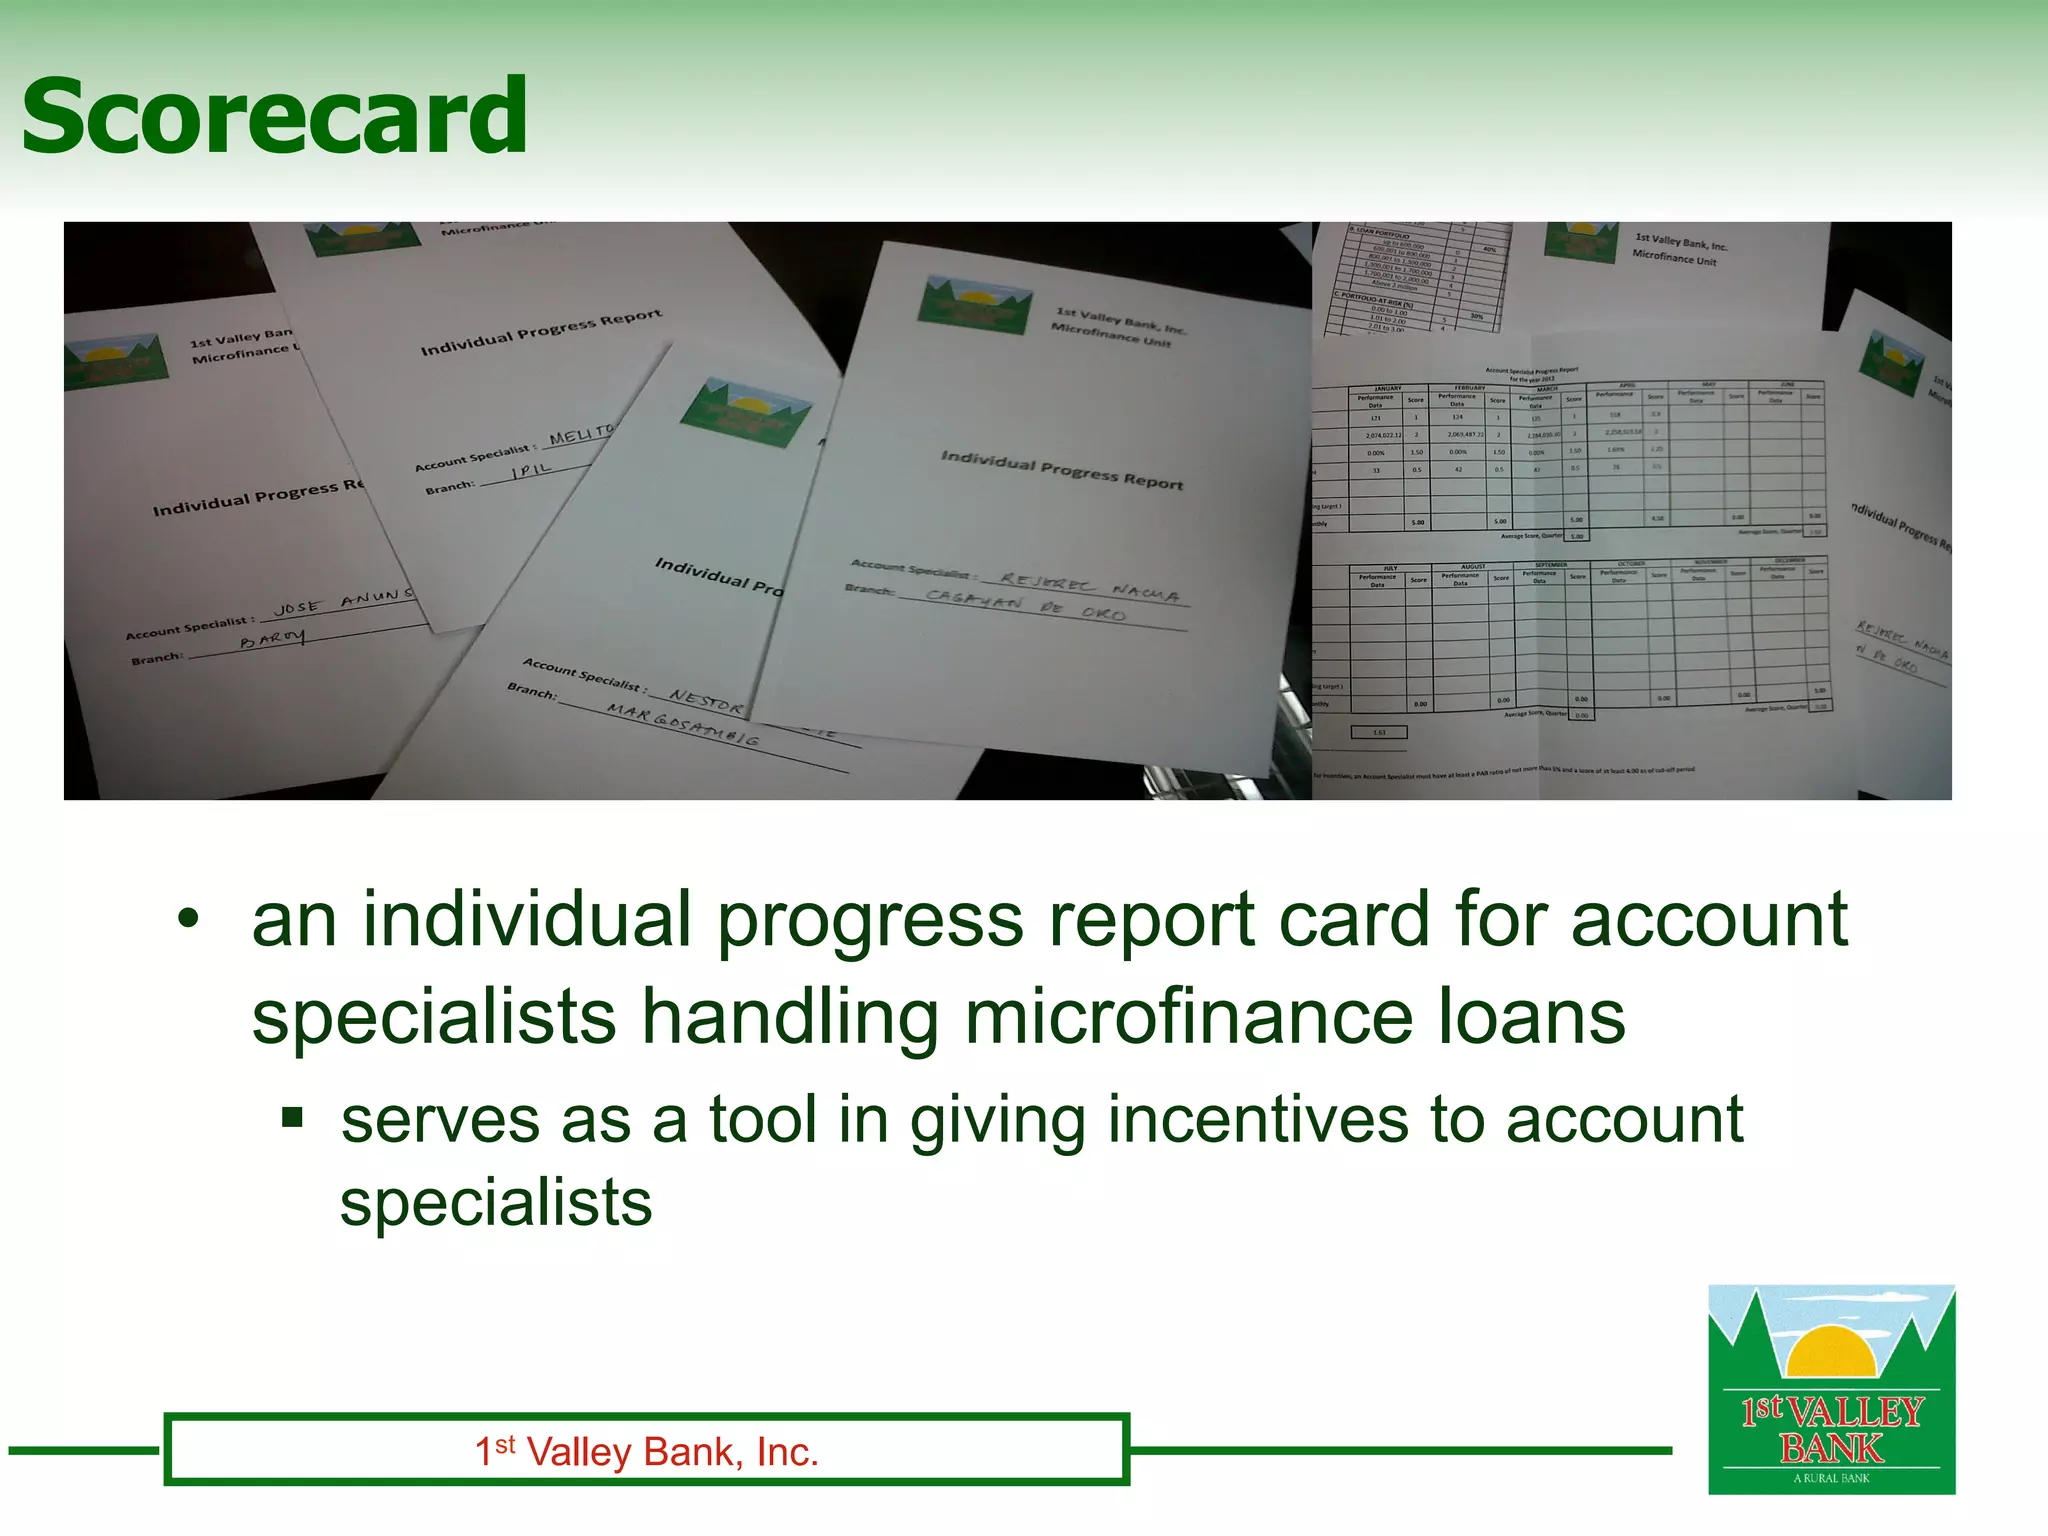
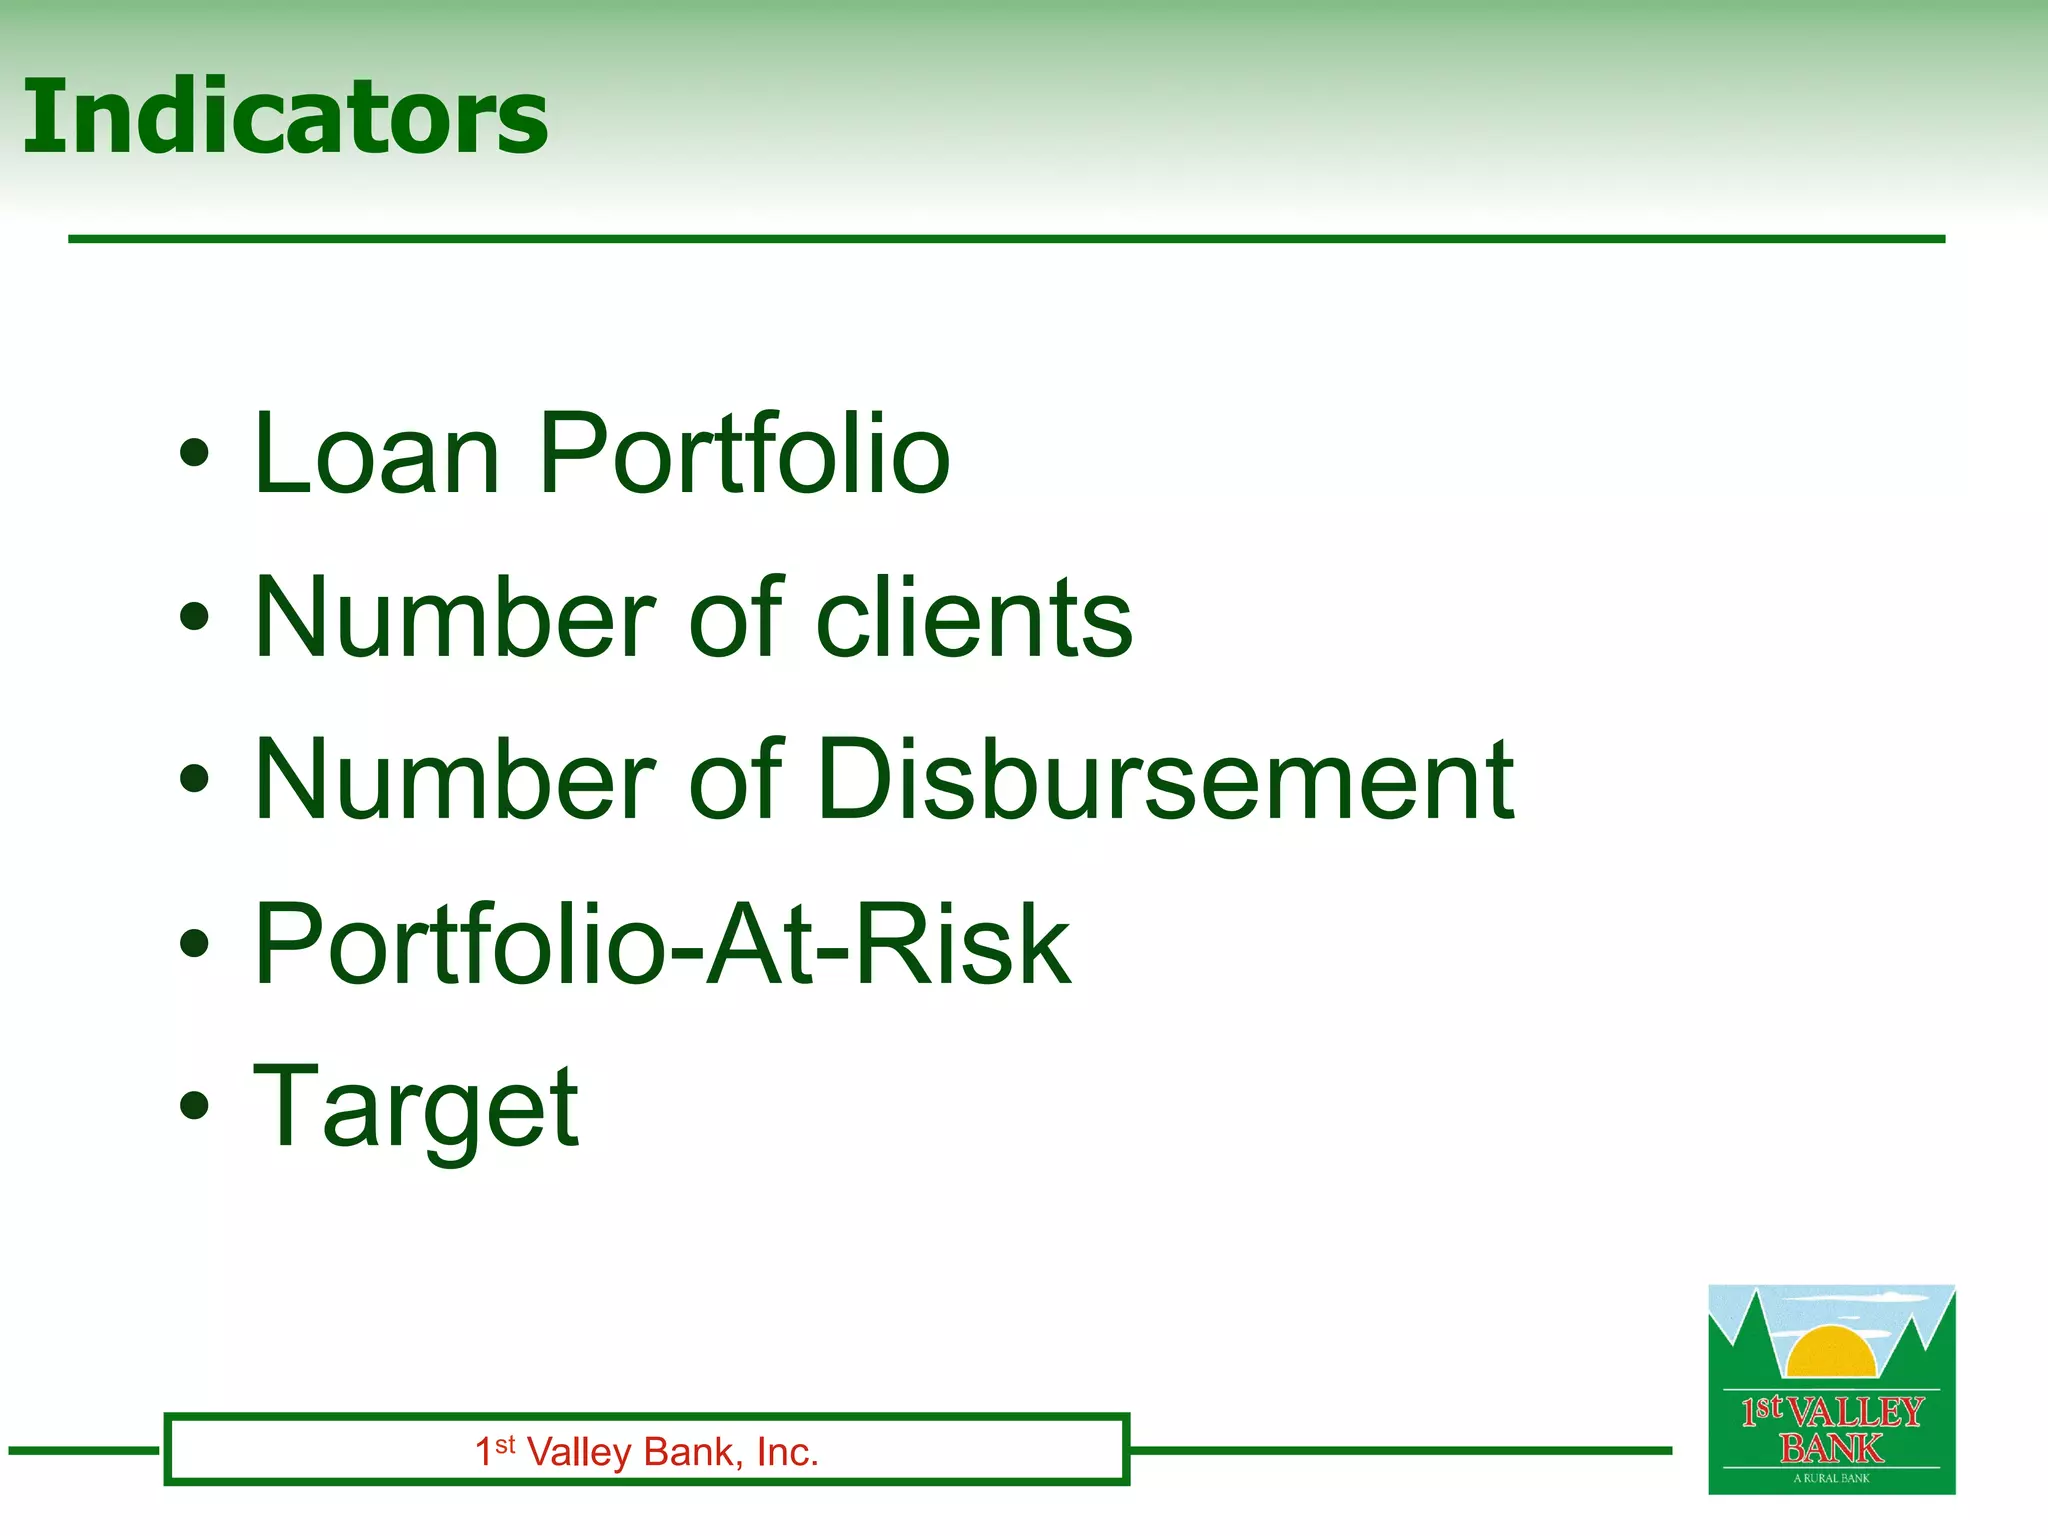
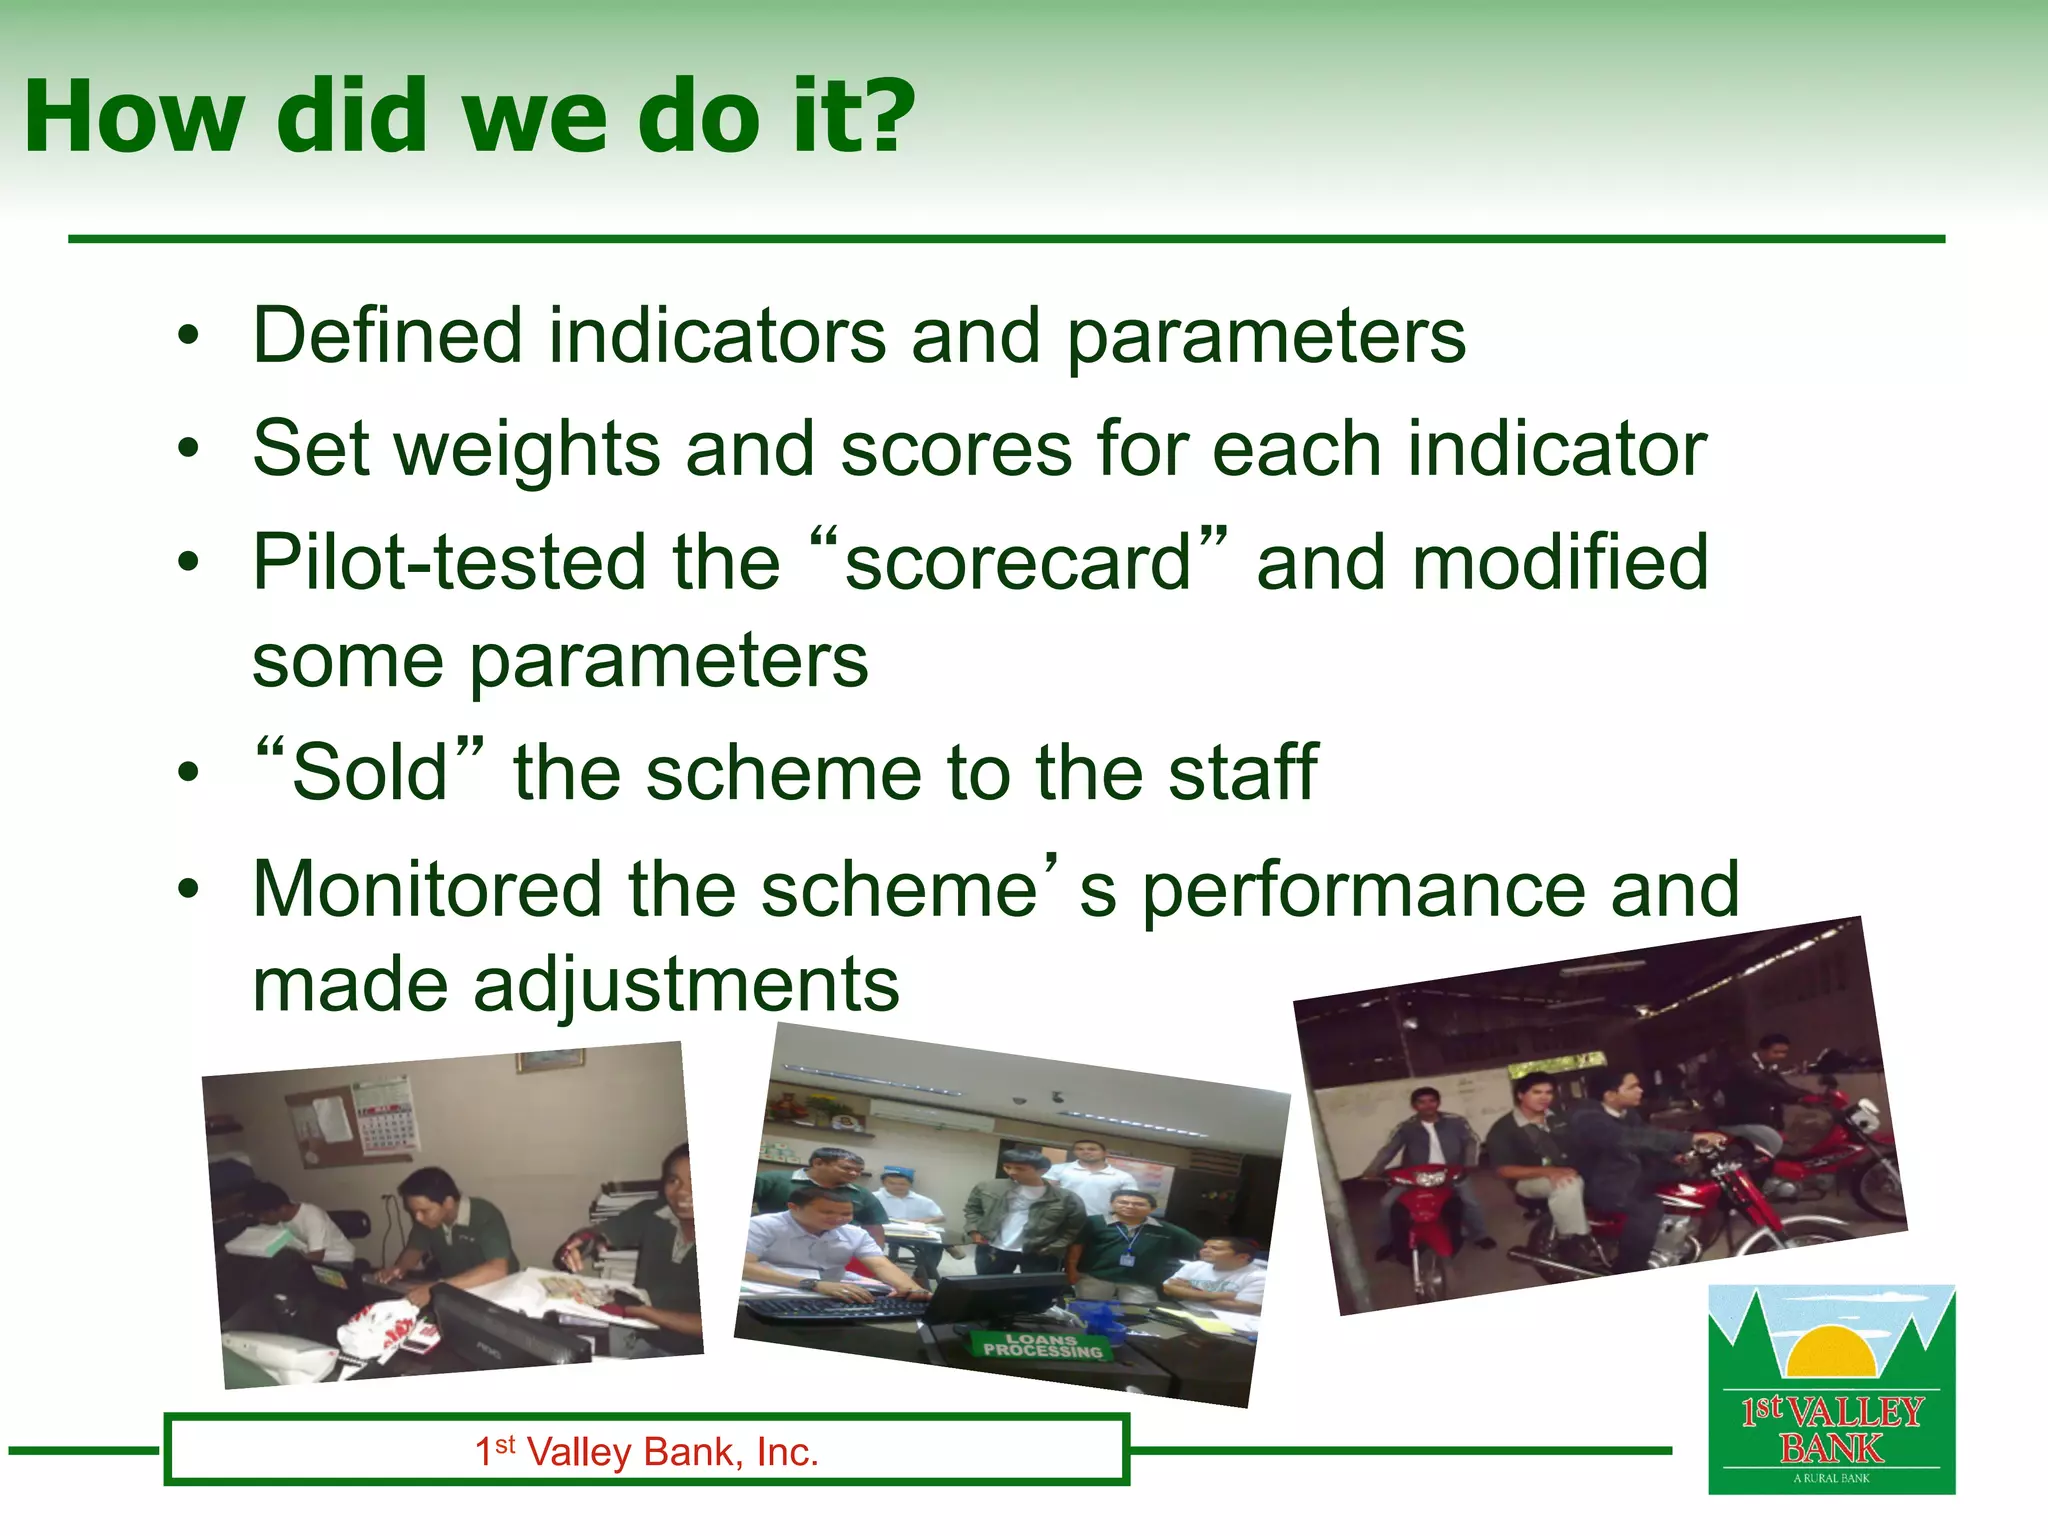
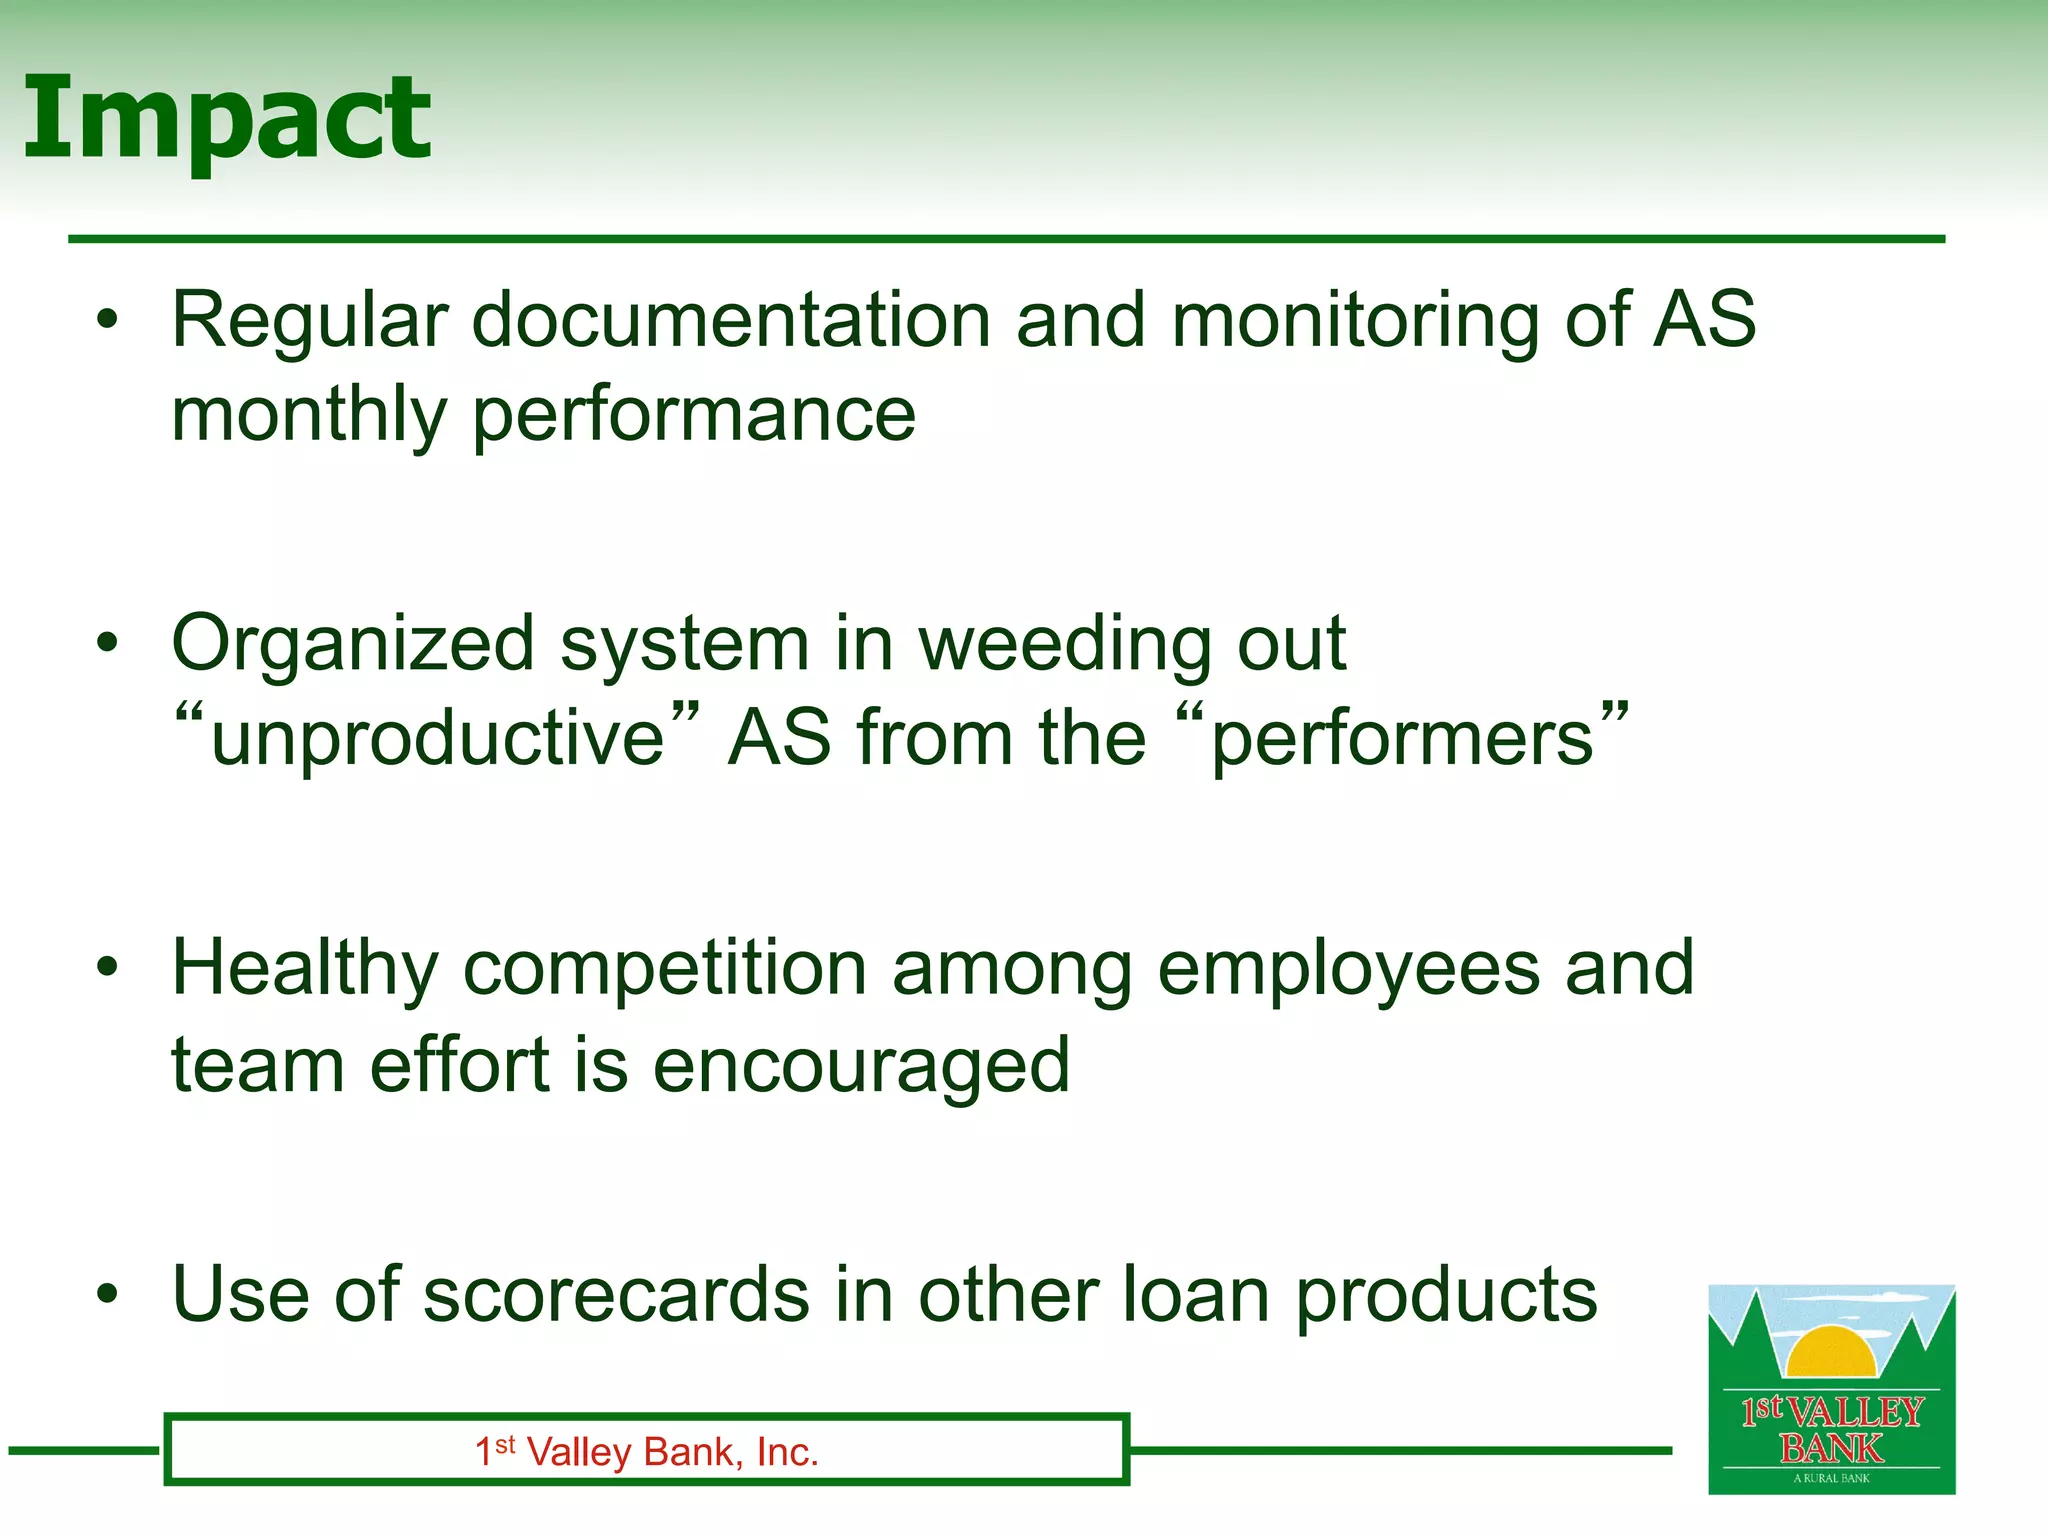
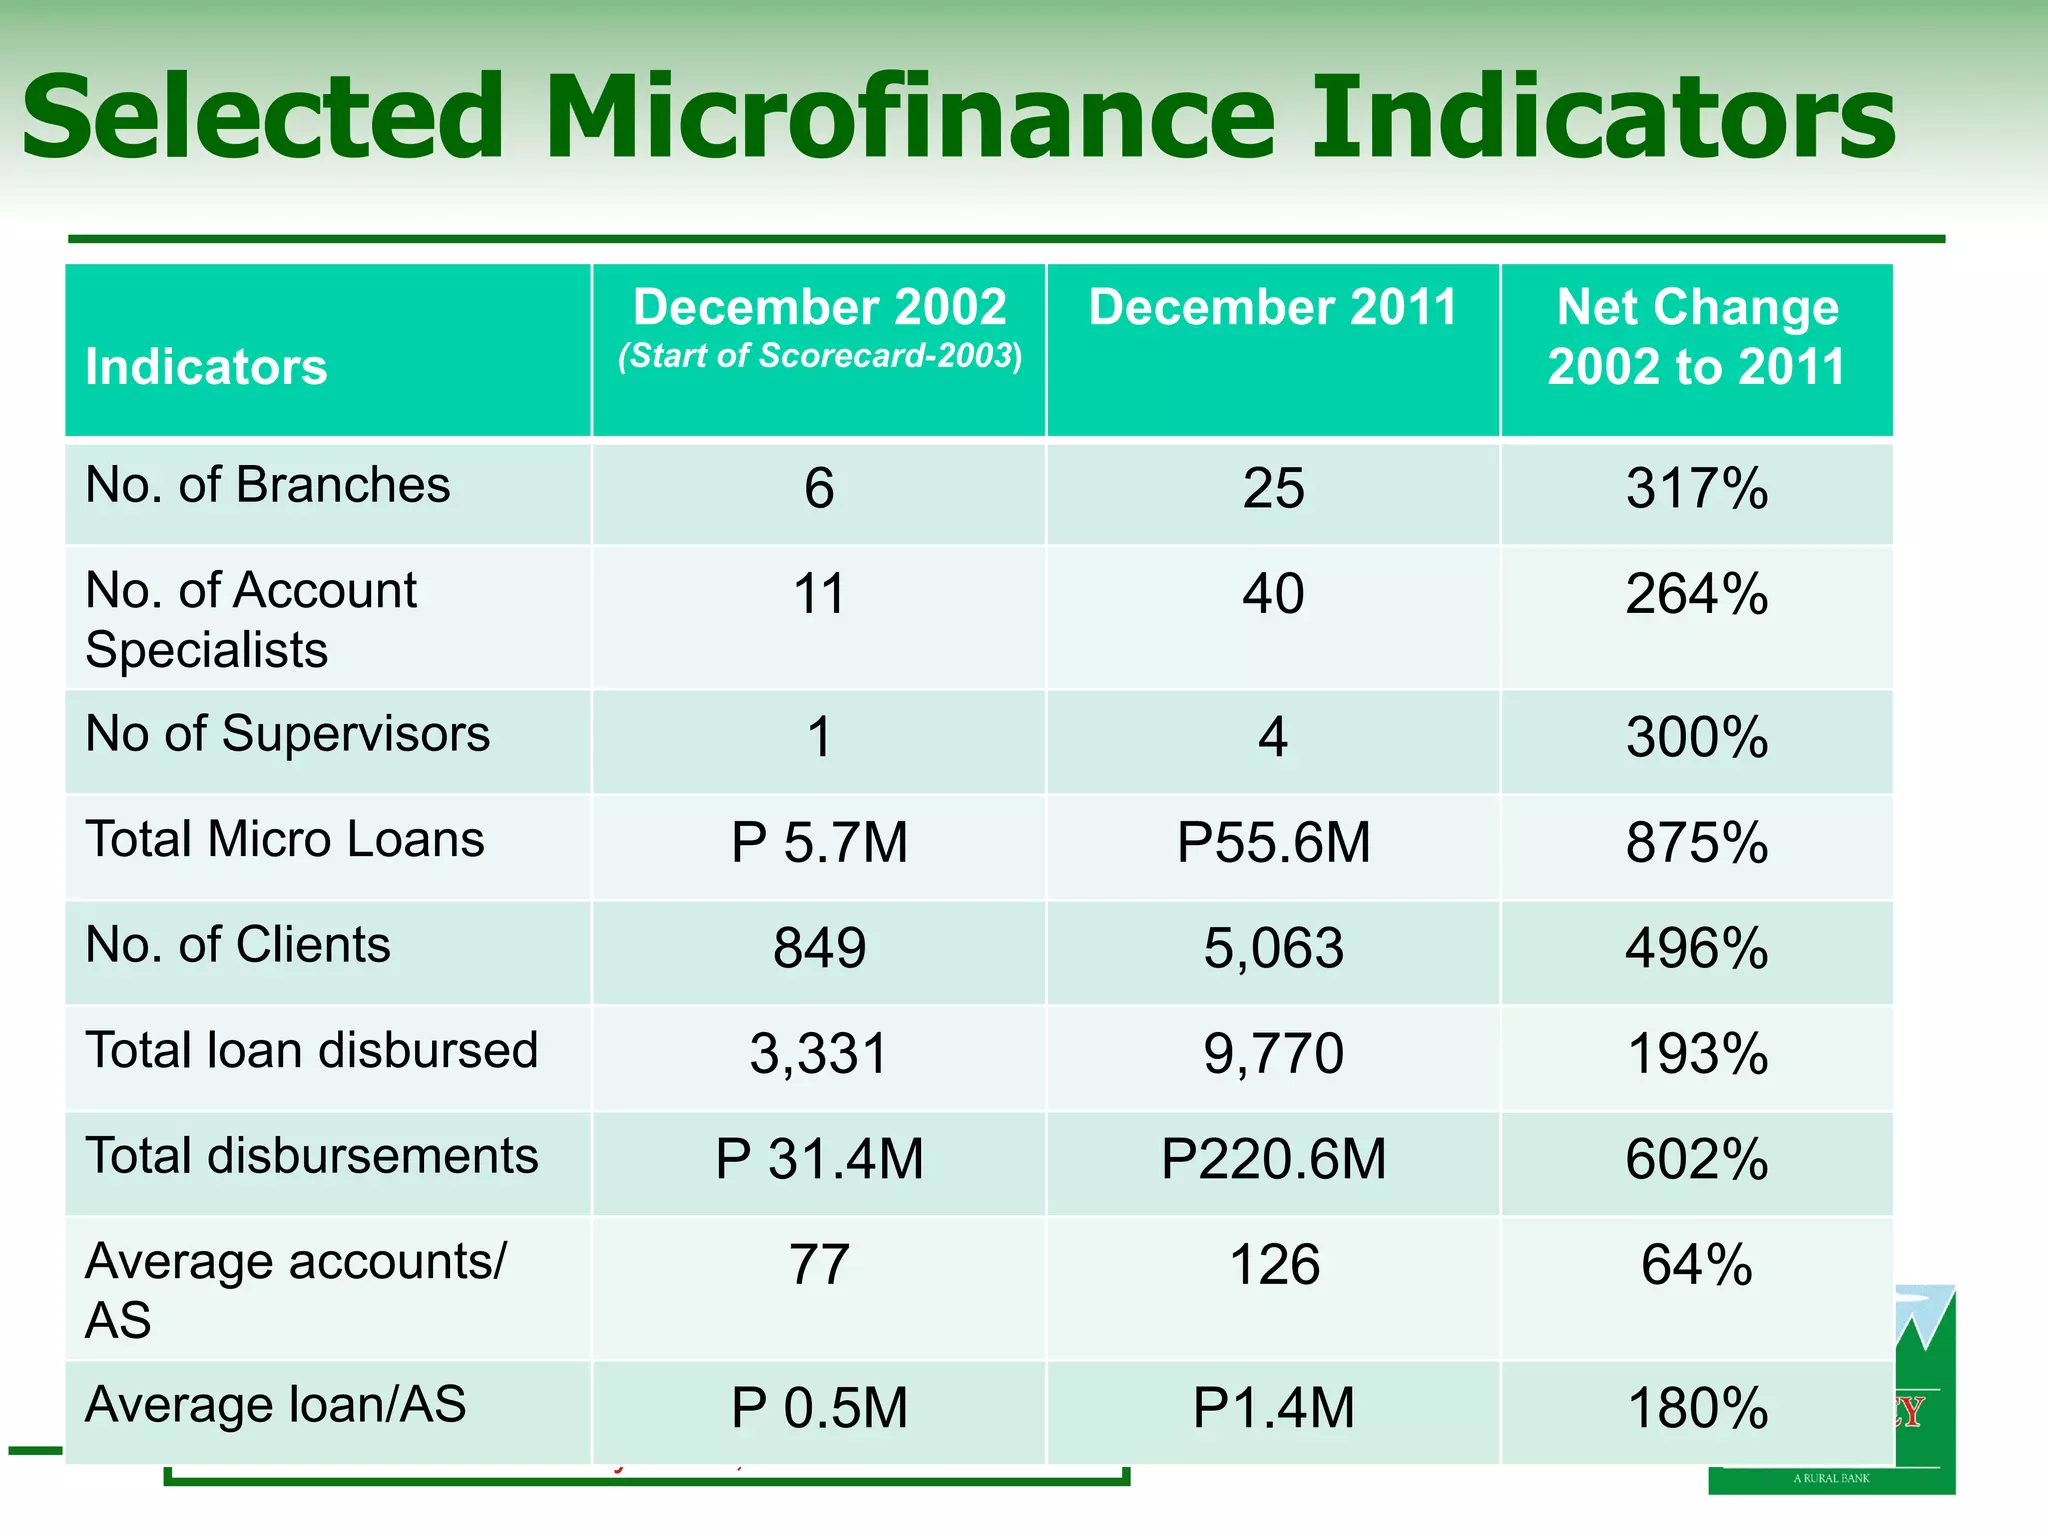
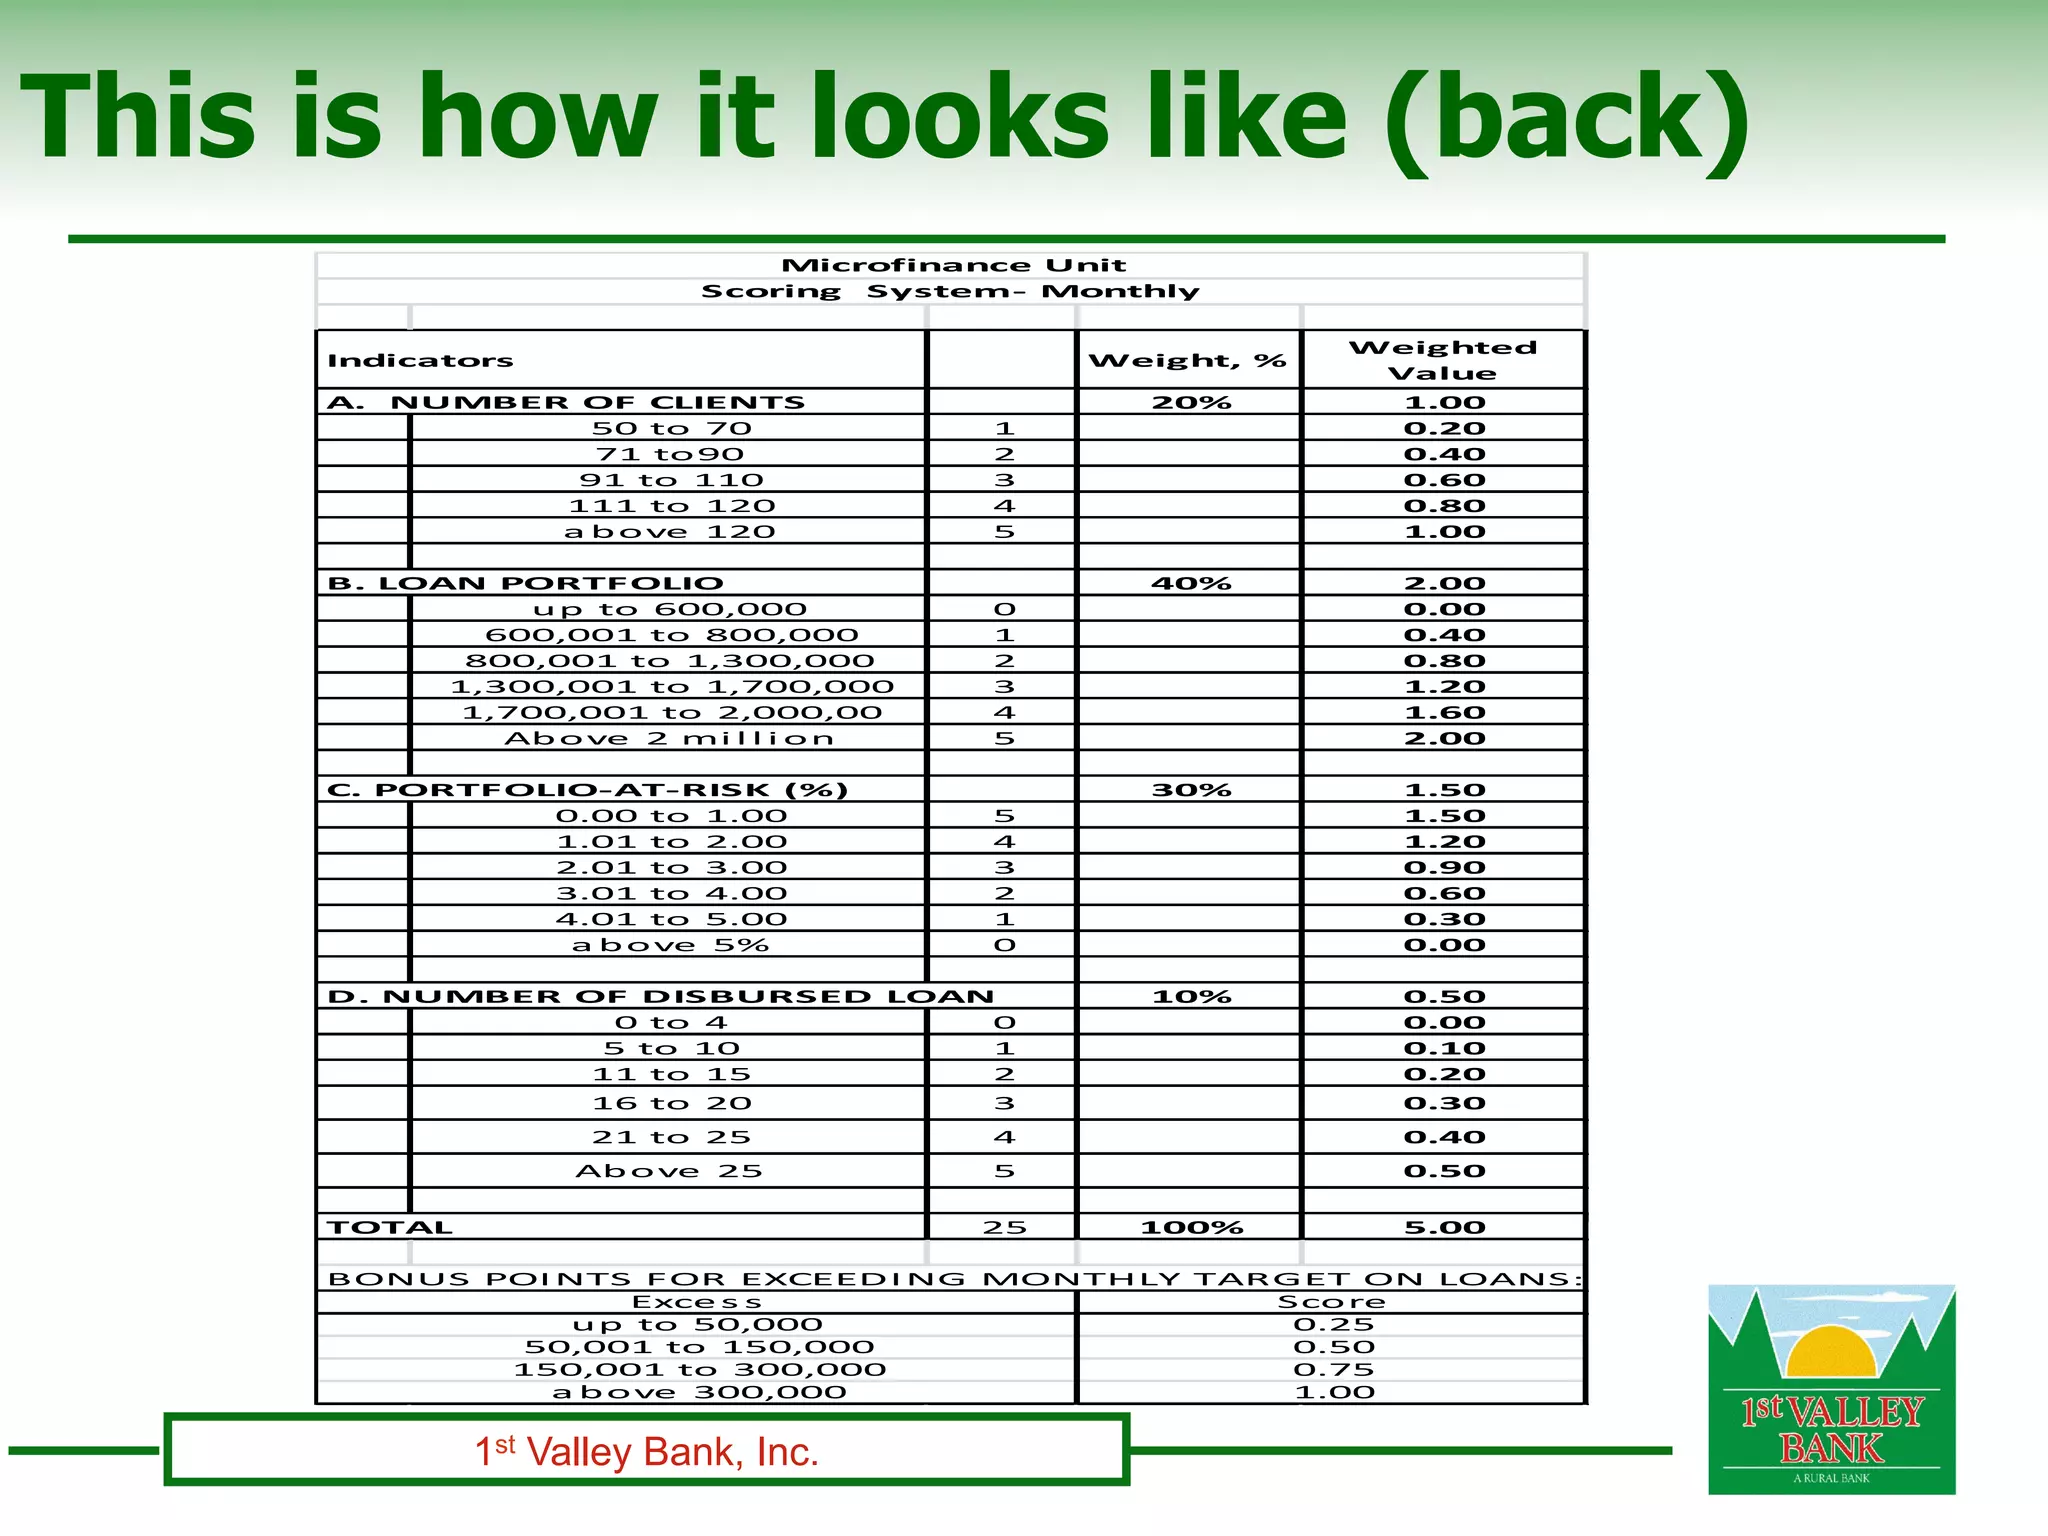


The document presents the implementation of a 'scorecard' incentive system at 1st Valley Bank for account specialists in microfinance, aimed at rewarding outstanding performance and meeting bank targets. It outlines the structure of the scorecard, including defined indicators and how it has fostered competition and improved documentation of employee performance since its introduction in 2003. The results demonstrate significant growth in key metrics such as loan disbursement and number of clients, while also serving as a model for performance management across other loan products.


