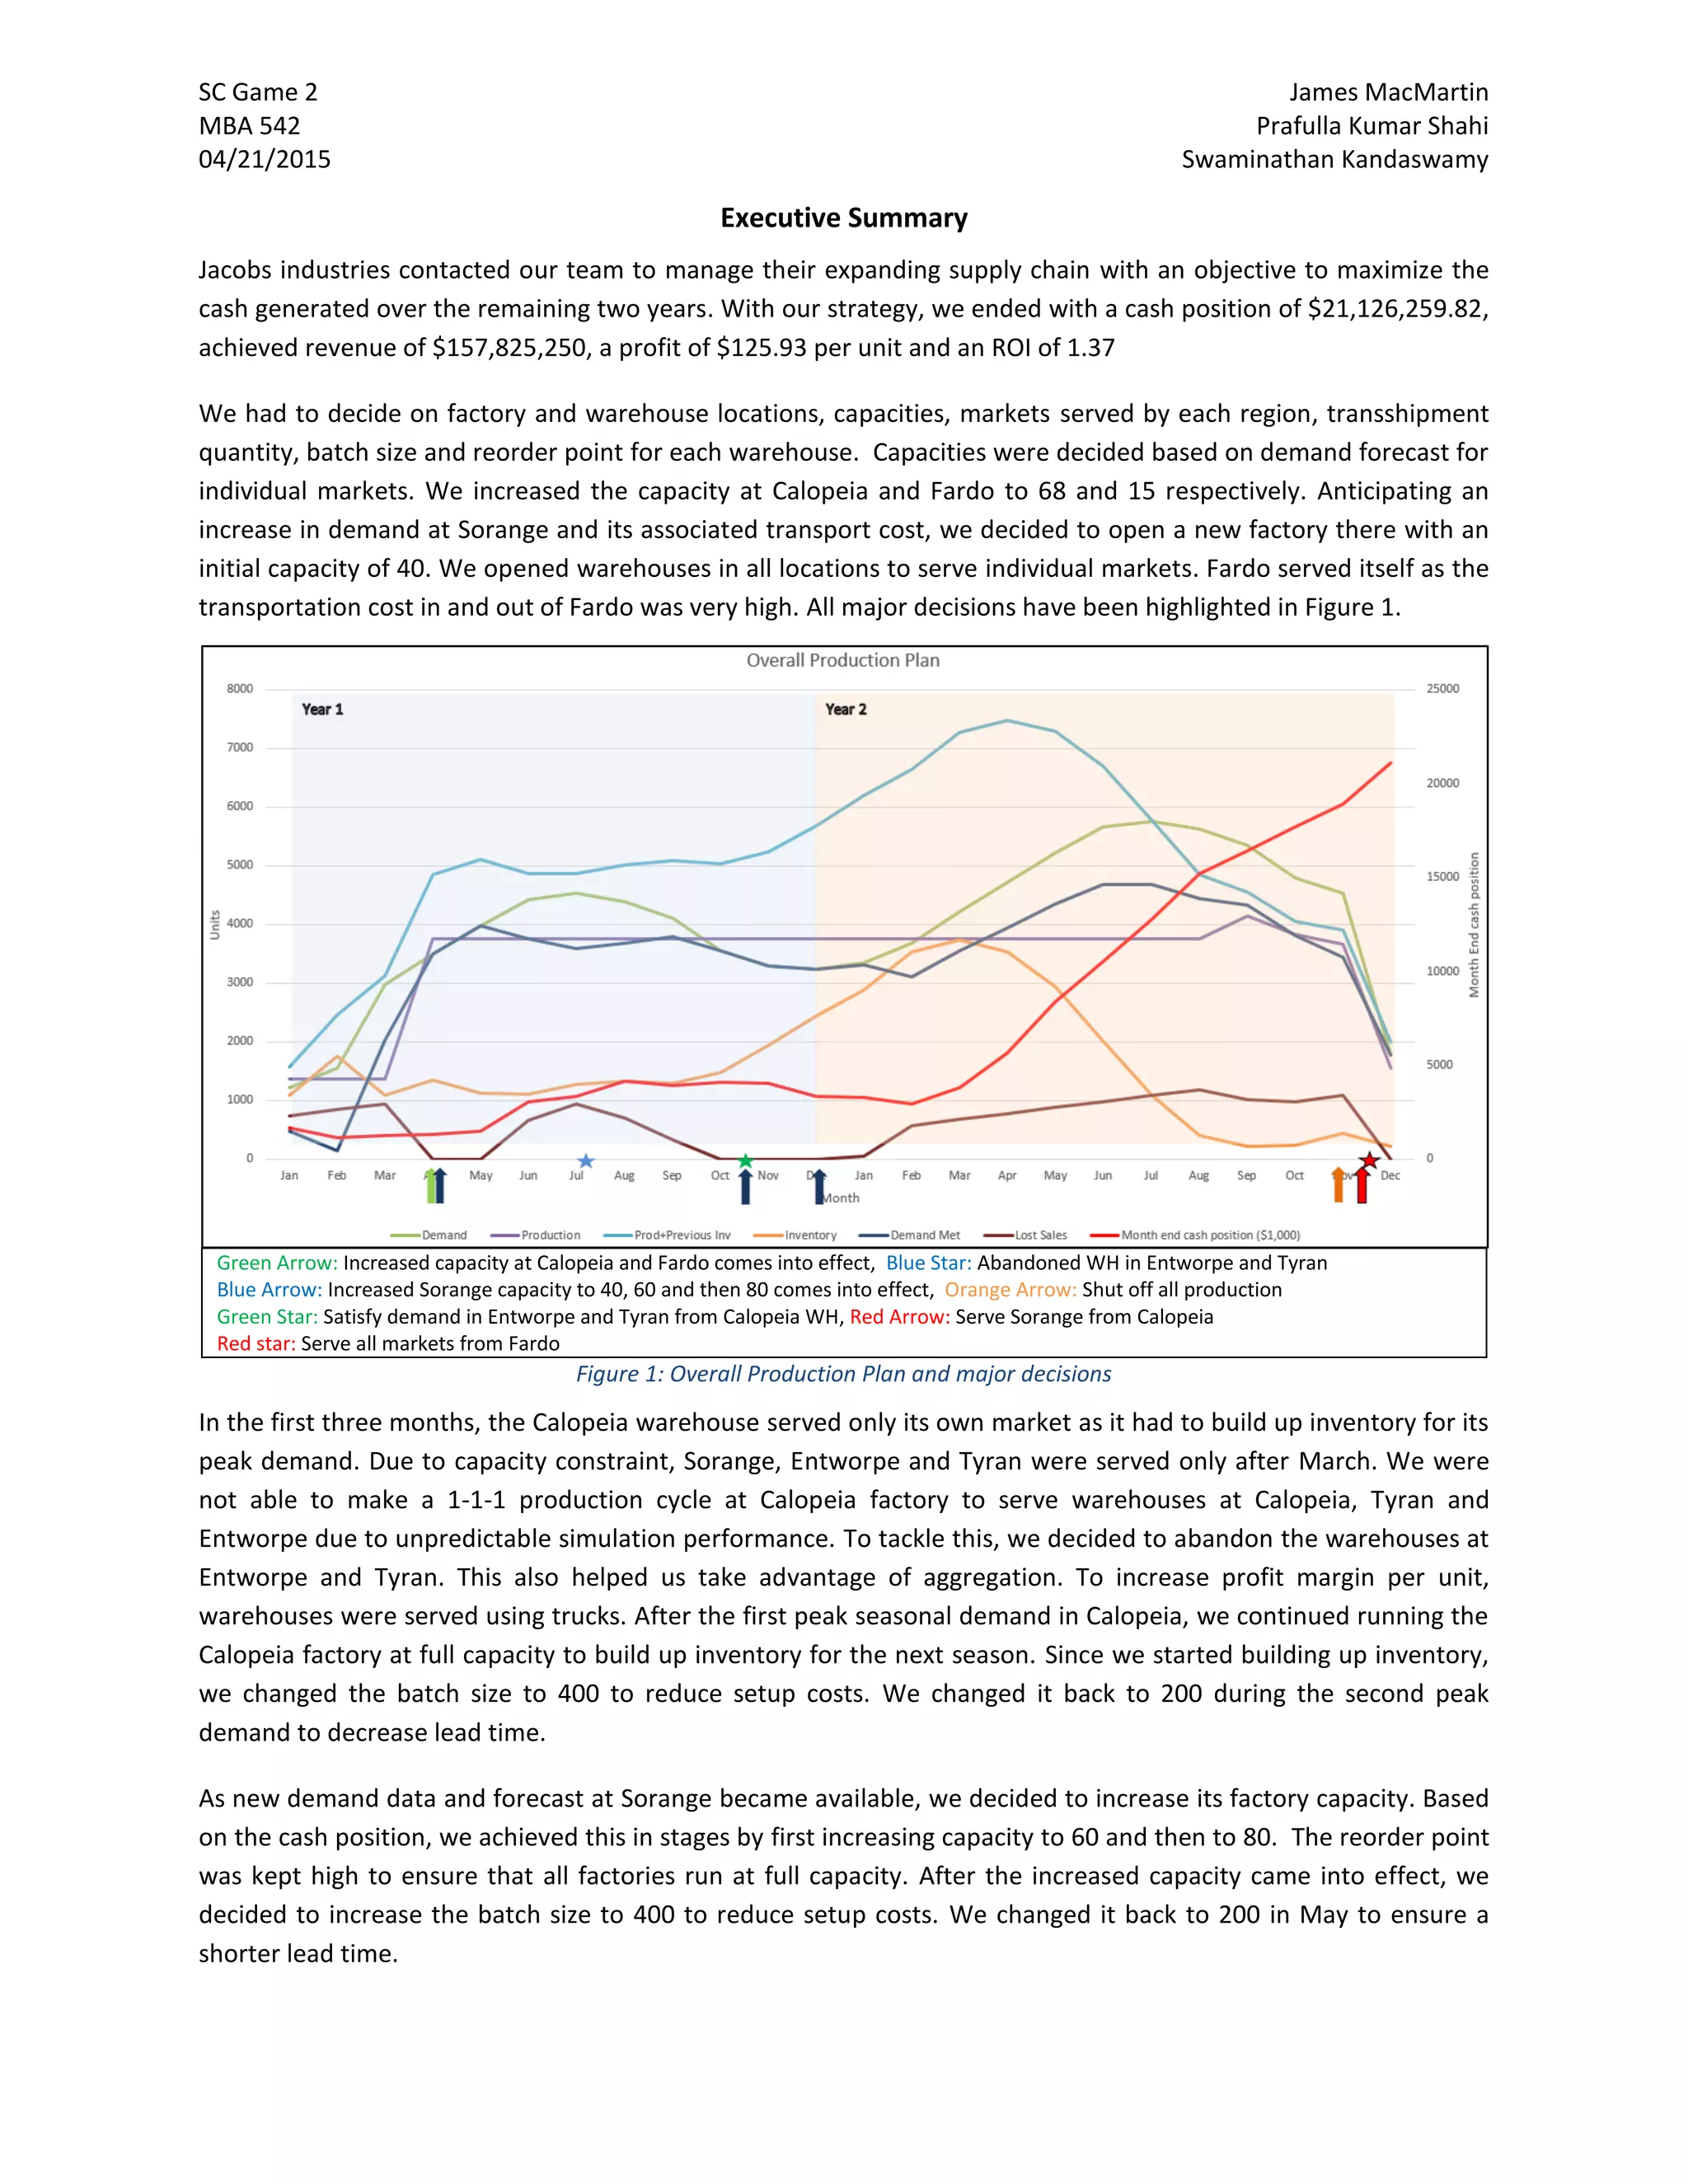
SC Game 2 James MacMartin
MBA 542 Prafulla Kumar Shahi
04/21/2015 Swaminathan Kandaswamy
Executive Summary
Jacobs industries contacted our team to manage their expanding supply chain with an objective to maximize the
cash generated over the remaining two years. With our strategy, we ended with a cash position of $21,126,259.82,
achieved revenue of $157,825,250, a profit of $125.93 per unit and an ROI of 1.37
We had to decide on factory and warehouse locations, capacities, markets served by each region, transshipment
quantity, batch size and reorder point for each warehouse. Capacities were decided based on demand forecast for
individual markets. We increased the capacity at Calopeia and Fardo to 68 and 15 respectively. Anticipating an
increase in demand at Sorange and its associated transport cost, we decided to open a new factory there with an
initial capacity of 40. We opened warehouses in all locations to serve individual markets. Fardo served itself as the
transportation cost in and out of Fardo was very high. All major decisions have been highlighted in Figure 1.
Green Arrow: Increased capacity at Calopeia and Fardo comes into effect, Blue Star: Abandoned WH in Entworpe and Tyran
Blue Arrow: Increased Sorange capacity to 40, 60 and then 80 comes into effect, Orange Arrow: Shut off all production
Green Star: Satisfy demand in Entworpe and Tyran from Calopeia WH, Red Arrow: Serve Sorange from Calopeia
Red star: Serve all markets from Fardo
Figure 1: Overall Production Plan and major decisions
In the first three months, the Calopeia warehouse served only its own market as it had to build up inventory for its
peak demand. Due to capacity constraint, Sorange, Entworpe and Tyran were served only after March. We were
not able to make a 1-1-1 production cycle at Calopeia factory to serve warehouses at Calopeia, Tyran and
Entworpe due to unpredictable simulation performance. To tackle this, we decided to abandon the warehouses at
Entworpe and Tyran. This also helped us take advantage of aggregation. To increase profit margin per unit,
warehouses were served using trucks. After the first peak seasonal demand in Calopeia, we continued running the
Calopeia factory at full capacity to build up inventory for the next season. Since we started building up inventory,
we changed the batch size to 400 to reduce setup costs. We changed it back to 200 during the second peak
demand to decrease lead time.
As new demand data and forecast at Sorange became available, we decided to increase its factory capacity. Based
on the cash position, we achieved this in stages by first increasing capacity to 60 and then to 80. The reorder point
was kept high to ensure that all factories run at full capacity. After the increased capacity came into effect, we
decided to increase the batch size to 400 to reduce setup costs. We changed it back to 200 in May to ensure a
shorter lead time.
SC Game 2 James MacMartin
MBA 542 Prafulla Kumar Shahi
04/21/2015 Swaminathan Kandaswamy
As the product life cycle approached its end, in November we decided to cut off all production. When the Sorange
warehouse stocked out, Calopeia started serving that market. The next decision was to serve all markets from
Fardo to unload the remaining inventory. When the game ended, all the inventory was used up and we lost only 5
units in Fardo to obsolescence.
This game taught us the importance of key concepts in supply chain management:
ď‚· Aggregation and its impact on inventory: Abandoning warehouses and moving to a centralized warehouse
for Calopeia, Tyran and Entworpe helped us reduce inventory and cope with demand variation.
ď‚· Capacity planning: We missed the cost difference in truck transport cost during initial calculations. With
correct calculations, a local factory at Tyran would have yielded a savings of $300k.
ď‚· Forecasting: We cut off Sorange production too early anticipating a sharp decline and eventually lost a
few weeks’ demand even though we had capacity. We should have cut-off production at Fardo earlier.
ď‚· Management and Decision Execution: We had planned not to serve other markets from Calopeia until its
capacity increase came into effect. Since we did not understand the interface correctly, we served Tyran
from Calopeia using mail during the first 3 months, resulting in a loss of profit margin.

SCgame2

  • 1.
    SC Game 2James MacMartin MBA 542 Prafulla Kumar Shahi 04/21/2015 Swaminathan Kandaswamy Executive Summary Jacobs industries contacted our team to manage their expanding supply chain with an objective to maximize the cash generated over the remaining two years. With our strategy, we ended with a cash position of $21,126,259.82, achieved revenue of $157,825,250, a profit of $125.93 per unit and an ROI of 1.37 We had to decide on factory and warehouse locations, capacities, markets served by each region, transshipment quantity, batch size and reorder point for each warehouse. Capacities were decided based on demand forecast for individual markets. We increased the capacity at Calopeia and Fardo to 68 and 15 respectively. Anticipating an increase in demand at Sorange and its associated transport cost, we decided to open a new factory there with an initial capacity of 40. We opened warehouses in all locations to serve individual markets. Fardo served itself as the transportation cost in and out of Fardo was very high. All major decisions have been highlighted in Figure 1. Green Arrow: Increased capacity at Calopeia and Fardo comes into effect, Blue Star: Abandoned WH in Entworpe and Tyran Blue Arrow: Increased Sorange capacity to 40, 60 and then 80 comes into effect, Orange Arrow: Shut off all production Green Star: Satisfy demand in Entworpe and Tyran from Calopeia WH, Red Arrow: Serve Sorange from Calopeia Red star: Serve all markets from Fardo Figure 1: Overall Production Plan and major decisions In the first three months, the Calopeia warehouse served only its own market as it had to build up inventory for its peak demand. Due to capacity constraint, Sorange, Entworpe and Tyran were served only after March. We were not able to make a 1-1-1 production cycle at Calopeia factory to serve warehouses at Calopeia, Tyran and Entworpe due to unpredictable simulation performance. To tackle this, we decided to abandon the warehouses at Entworpe and Tyran. This also helped us take advantage of aggregation. To increase profit margin per unit, warehouses were served using trucks. After the first peak seasonal demand in Calopeia, we continued running the Calopeia factory at full capacity to build up inventory for the next season. Since we started building up inventory, we changed the batch size to 400 to reduce setup costs. We changed it back to 200 during the second peak demand to decrease lead time. As new demand data and forecast at Sorange became available, we decided to increase its factory capacity. Based on the cash position, we achieved this in stages by first increasing capacity to 60 and then to 80. The reorder point was kept high to ensure that all factories run at full capacity. After the increased capacity came into effect, we decided to increase the batch size to 400 to reduce setup costs. We changed it back to 200 in May to ensure a shorter lead time.
  • 2.
    SC Game 2James MacMartin MBA 542 Prafulla Kumar Shahi 04/21/2015 Swaminathan Kandaswamy As the product life cycle approached its end, in November we decided to cut off all production. When the Sorange warehouse stocked out, Calopeia started serving that market. The next decision was to serve all markets from Fardo to unload the remaining inventory. When the game ended, all the inventory was used up and we lost only 5 units in Fardo to obsolescence. This game taught us the importance of key concepts in supply chain management:  Aggregation and its impact on inventory: Abandoning warehouses and moving to a centralized warehouse for Calopeia, Tyran and Entworpe helped us reduce inventory and cope with demand variation.  Capacity planning: We missed the cost difference in truck transport cost during initial calculations. With correct calculations, a local factory at Tyran would have yielded a savings of $300k.  Forecasting: We cut off Sorange production too early anticipating a sharp decline and eventually lost a few weeks’ demand even though we had capacity. We should have cut-off production at Fardo earlier.  Management and Decision Execution: We had planned not to serve other markets from Calopeia until its capacity increase came into effect. Since we did not understand the interface correctly, we served Tyran from Calopeia using mail during the first 3 months, resulting in a loss of profit margin.